EVALUATING AND IMPROVING THE PERFORMANCE OF COLD
ASPHALT EMULSION MIXES
I Nyoman Arya Thanaya
Lecturer Civil Engineering Department, Faculty of Engineering, Udayana University, Denpasar, Bali, currently post doctorate research program, Leeds University, United Kingdom (UK).
Email: [email protected]
ABSTRACT
This paper describes investigation on the performances of cold asphalt emulsion mixes (CAEMs). The type of emulsion used was a cationic asphalt emulsion. The investigation was carried out at Leeds University, United Kingdom (UK). The objective of the experiments was to evaluate and to improve the performances of cold mixes and compared with hot mixes. For optimising the performances of the cold mixes, a target porosity of five to ten percent and indirect tensile stiffness modulus (ITSM) value of 2000 MPa was selected, suitable for low to medium trafficked roads. A simplified mix design procedure was used for producing the cold mixes. It was found that when properly designed, at full curing conditions, the stiffness (ITSM) of CAEMs were found to be very comparable to those of hot mixes. Test results also show that the addition of cement in the amount of one to two percent by mass of aggregates significantly improved the mechanical performance of cold asphalt mixes.
Keywords: cold mix, asphalt emulsion.
INTRODUCTION
CAEMs principally can incorporate any materials that are used in hot mixes. However, they are still considered inferior to hot asphalt mixes. This is due to three main concerns with respect to CAEMs, namely: high porosity of the compacted mixture, weak early life strength (caused mainly by the trapped water) and the long curing times (evaporation of water/volatiles content and setting of the emulsion) required to achieve maximum performance [1].
In general, CAEMs are simple to produce and suitable for; low to medium traffic conditions; works in remote areas; and small scale jobs (at numerous locations) such as reinstatement works. However, currently there is no universally accepted mix design method for CAEMs.
The hot mixes used for stiffness (ITSM) comparison were produced using the same materials with the cold mixes. Creep and fatigue comparison was done using data available from previous publication [2,3,4].
The CAEMs results presented in this paper were obtained using a simplified design procedure re-commended by the author [5]. This simplified design
Note: Discussion is expected before November, 1st 2007, and will be published in the “Civil Engineering Dimension” volume 10, number 1, March 2008.
Received 19 September 2006; revised 12 December 2006; accepted 15 January 2007.
procedure is considered more practical. The target compacted mix porosity was five to ten percent [6] and a minimum stiffness value (ITSM) of 2000 MPa was set [7,8], that are suitable for low to medium trafficked roads.
The objective of the experiments was to evaluate and improve the performances of cold mixes and compared with hot mixes.
AGGREGATE GRADATIONS
FOR THE MIXES
The aggregate gradations of all the design mixes used in this investigation were based on Cooper’s formula [9] as shown below:
F 075
. 0 D
) 075 . 0 d )( F 100 ( P
n n
n n
+ −
− −
= (1)
limit-UL, and lower limit-LL) specified by Nikolaides [11] for comparison, the CAEMs aggregate grading chosen closely follows the lower limit of Nikolaides grading.
0.01 0.10 1.00 10.00 100.00
Sieve Size (mm)
Figure 1. Aggregate Grading of CAEMs compared with Specification of Nikolaides [8].
Materials Used for The CAEMs
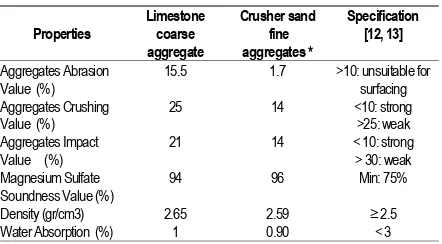
The coarse and fine aggregates used for the CAEMs and their properties are given in Table1. The filler was fly ash from Eggborough power station with density 2.2 gram/cm3.
Table 1. Properties of the aggregate materials used for the CAEMs. Soundness Value (%)
94 96 Min: 75%
Density (gr/cm3) 2.65 2.59 ≥ 2.5 Water Absorption (%) 1 0.90 < 3
* By-product of aggregate crushing
It can be seen in Table 1, the aggregates used are not suitable for surface courses in heavy trafficked roads. As CAEMs are suitable for low to medium trafficked road, hence the materials were incorporated.
The optimum residual asphalt content of the CAEMs was already previously determined at six percent [5]. The binder used for the CAEMs was a cationic asphalt emulsion (60 % asphalt content) with 100 pen. grade base asphalt obtained from Nynas Asphalts, UK. The specific gravity of the base asphalt was 1.02.
Mixture Designation of The CAEMs
Depending on the material types incorporated, the CAEMs were designated as shown in Table 2.
Table 2. Mixture designation and composition of the CAEMs.
Name of mix Coarse aggregates (56.61 %)
Fine Aggregates (39.39 %)
Filler (4 %)
CAEM Limestone Crusher sand fly ash CAEM+cement Ditto Ditto + (1-2) % cement by
mass of aggregates
Ditto
In cases where an accelerated rate of strength gain desired, ordinary Portland cement in the amount of one to two percent (by mass of the aggregates) is commonly added into the mix.
Mix Design, Compaction, and Curing Proce-dures for The CAEMs
The design procedure recommended by the author [5] overcomes the impractical requirement of the determination of optimum water content at compact-tion on site. It ensures that the porosity requirement is met; the retained stability is evaluated at opti-mum residual asphalt content only, which reduces the number of samples needed; and provides data on the ultimate strength of the CAEMs under full curing conditions.
Compaction of the CAEMs specimens was carried out using a Gyropac (Figure 2) compactor set at 240 kPa axial pressure (for 100 mm diameter samples) with an angle of gyration of 2°. The two compaction levels routinely used with this type of equipment are: Medium compaction level: 80 revolutions in the Gyropac, which is equivalent to the compaction effort generated when applying 50 blows each end using a Marshall hammer.
Heavy compaction level: 120 revolutions in the Gyropac, which is equivalent to the compaction effort generated when applying 75 blows each end using a Marshall hammer.
Following several compaction trials with the Gyro-pac it was found that in order to achieve the target air void content of five to ten percent the compaction level had to be increased by up to two times the heavy compacttion level routinely specified. This higher compaction level was subsequently referred to as extra heavy compaction [5].
Laboratory curing of the CAEMs were carried out in an oven set at 40°C. Full curing conditions were achieved when the specimens following repeated weighing, maintained a constant mass at 40°C. Typically, full curing conditions were achieved within 18 to 21 days for samples with porosity values in the range of eight to nine percent.
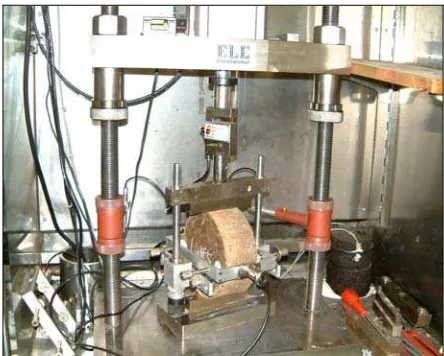
Mechanical Properties Tested
creep at 40 °C, and fatigue at 20 °C [15]. The specimens were tested using a universal Materials Testing Apparatus (MATTA), as shown in Figures 3, 4, and 5. Three samples were tested for each type of mix and the results were averaged.
Figure 2. Gyropac Compactor and Principle of Gyratory Com-paction.
Stiffness Comparison of The CAEMs to Hot Mixes (100 pen. grade)
The stiffness (ITSM) performances of the CAEMs were compared to hot mixes composed of the same materials. The hot mixes were also of six percent asphalt content (100 pen. grade). The mixing and compaction temperatures were set at 140°C and 125°C, respectively[16].
Three hot mix samples were compacted in medium compaction effort and three others were in heavy compaction. The results were averaged and presen-ted in Table 3.
Figure 3. Configuration of Indirect Tensile Stiffness Modulus (ITSM) Test.
Figure 4. Configuration of Dynamic Creep Test.
Figure 5. Configuration of Fatigue Test.
Table 3. Properties of the CAEMs compared to Hot Mixes.
Mixture type Compaction effort Porosity (%) ITSM (MPa)
CAEM 2 × heavy compaction 9.7 2275 (full curing) CAEM + 1% cement * 2 × heavy compaction 9.4 3378 (full curing) CAEM + 2 % cement * 2 × heavy compaction 9.2 4970 (full curing) 100pen. Hot Mix Medium compaction 4.7 2150 100pen. Hot Mix Heavy compaction 3.4 2520 * by mass of aggregates
Referring to Table 3, in order to meet the target porosity range of five to ten percent, the CAEMs required two times the heavy compaction level. Even at this compaction level, only porosity values in the range of eight to nine percent could be achieved. This is because the CAEMs become stiffer as more bitumen droplet of the emulsion set (coalesce) during compaction.
Compared to CAEMs, hot asphalt mixes when mixed and compacted at the correct temperatures normally possess better coating and workability. This is evident from the porosity and compaction effort results shown in Table 3, where the hot mixes give lower porosity values at lower compaction efforts.
CREEP PERFORMANCE OF THE CAEMs
Dynamic creep tests were carried at the following test conditions: Pulse width 1000 millisecond (ms), Pulse Period 2000 ms, Test Termination Strain 100000 micro-strain (µs), Terminal Pulse Count 3600 pulses, Conditioning stress 10kPa, Test loading stress 100 kPa, conditioning time 15 minutes, Pre-load rest time two minutes, recovery time two minutes. The tests were carried out at 40 °C.
Creep Performance of CAEMs Compared to Hot Mixes
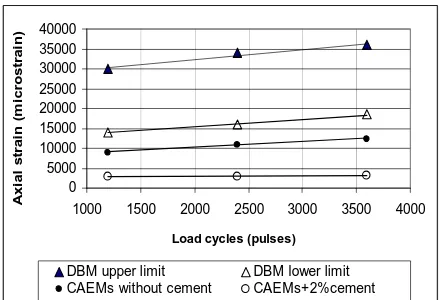
The creep performances of the CAEMs (number of load cycles vs. cumulative strain) are shown in Figure 6. As is generally the case for creep behavior, the creep curve can be divided into three main regions; the primary creep region where the strain rate decreases with the number of load cycles applied; the secondary creep region where the strain rate is almost constant, otherwise known as the steady state strain rate; and the tertiary creep region where the strain rate increases rapidly up to failure. The steady state strain rates, or creep slope values are shown in Figures 6, and 7, and Table 4.
The creep results were compared with the available data of a Dense Asphalt Macadam (DBM) 20mm max aggregate size hot mixes with five percent optimum 100 pen asphalt content, and porosity range from 2.2 – 8.6 %. Gibb [2] found their creep strain with lower and upper limit are as shown in Figures 6 and 7.
Creep slopes were derived from the linear portion of Figure 6 (as shown in Figure 7). By utilizing linear analysis (trend line), the equation and creep slopes (the coefficient of variable x), are given in Table 4.
0
0 1000 2000 3000 4000
Load cycles (pulses)
DBM upper limit DBM lower limit CAEMs without cement CAEMs + 2% cement
Figure 6. CAEMs Dynamic Creep Test Results at 40°C, Com-pared to Hot Mixes
0
1000 1500 2000 2500 3000 3500 4000
Load cycles (pulses)
DBM upper limit DBM lower limit CAEMs without cement CAEMs+2%cement
Figure 7. Creep Slopes derived from the linear portion of Figure 6.
Table 4. Creep Slope Data (Referring to Figures 6 and 7).
Mixture Test temp.
(°C)
Linear Regression
Equations and R2
Slope of Creep Curve DBM100pen lower limit [2]
40 y = 2.5x +27333 mass of aggregates [5]
40 y = 0.0396x + 2980 R2 = 0.9402
0.0396
Referring to Table 3, it revealed that although cold mixes generally of higher porosity, their stiffness were higher than hot mixes. This is also in phase with the creep slopes of the cold mixes in Table 4, where the cold mixes at full curing gave lower slopes (indicates better resistance to deformation) com-pared to hot mixes, as shown in Figure 7. This condition may have not yet fully understood as more results are needed for comparison. However, it is thought that the chemical formulation of the asphalt emulsion and its affinity with the aggregates play some roles, where at full curing condition, asphalt emulsion mixes perform at least comparable or even better than hot mixes.
Considering the creep slopes of the cold mixes shown in Table 4, and referring to Table 5, it is confirmed that cold mixes are suitable for low to medium trafficked road.
Table 5. Typical laboratory determined minimum dynamic creep slope values [17].
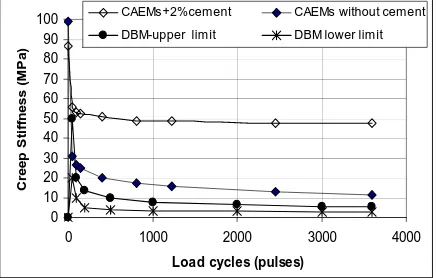
Creep Stiffness of The Mix (Smix)
The Smix value is an additional indicative of the
resistance to permanent axial deformation. For asphalt specimens the Smix is basically obtained from
the ratio of applied stress (100 kPa) to the cumula-tive compressive strain at a defined temperature and time of loading, as can be seen in Figure 8. Mixes with lower stiffness (ITSM) are common to undergo higher deformation, hence it is logical to Smix values.
Figure 8 is in line with the trend in Figure 6.
0
0 1000 2000 3000 4000
Load cycles (pulses)
CAEMs+2%cement CAEMs without cement
DBM-upper limit DBM lower limit
Figure 8. Dynamic Creep Stiffness of The Mixes.
Fatigue Performances
Fatigue is a phenomenon of fracture/failure under repeated loading. Fatigue test results can be expressed as a relation of number of loading (pulses) to strain at failure. The fatigue performances of the cold mixes were compared with a 12mm max aggregate size of asphalt concrete mixes (AC) of 100 pen asphalt with five percent porosity [3], and a 20mm max aggregate size of DBM 100pen [4] with porosity of 5.1 %. Both hot mixes were at optimum asphalt content. The fatigue lines are shown in Figure 9 (in a log-log scale).
10 100 1000
100 1000 10000 100000 1000000
Number of Cycles to Failure ( Nf )
S
CAEMs without cement CAEMs+2%cement 20mm DBM hotmix 12mm AC hotmix
Figure 9. CAEMs Fatigue Performance Compared to Hotmixes
The fatigue line equations and coefficient correlation R2 from fatigue tests are presented in Table 6.
Referring to Table 6 and Figure 9, it can be clearly seen that the fatigue lines of the CAEMs with two
percent added cement were flatter than the cold mix without cement. At a projected life to failure (Nf) of one million load (pulse) cycles, the CAEMs incur-porating two percent cement can withstand 59 micro strain, about twice the strain (deflection) of the cold mix without cement. Similarly, the number of cycles to failure (Nf) of the CAEMs incorporating cement at
a relatively low deflection value of 100 micro-strains (4.84 × 10⁴ cycles)were also much higher than that of
the cold mixture without cement. This indicates that incorporating cement signifycantly improves the performance of CAEMs, in particular at low strain levels, for example, when acting as part of a well designed pavement structure.
Table 6. Fatigue Lines Equations (exponential regression line/trend line) and Coefficient of Correlation (R2)
Mixture
Equation based on Strain (Figure 9)
Equation based on number of cycles
to failure * load cycles are plotted as the y-axis.
However, when compared with 14mm AC 100pen hot mixes, the fatigue performance of the cold mixes with added two percent cement were relatively comparable. But without cement the cold mixes were inferior. This is logical, in particular when consi-dering the porosity values of the CAEMs which in general were much higher than the hot mixes. The 20mm DBM-100pen hot mixes had the best fatigue performance as it contained the largest maximum aggregate size (20mm).
The fatigue results above should have been affected by the porosity of the mixes, where the porosity of the CAEMs were almost twice of the hot mixes.
As fatigue is a parameter among other parameters for evaluating the performance of asphalt mixes, it is possible that one mixture perform better in one parameter but inferior in others. This could only be explained by the lack of repeatability of test results between different investigators.
CONCLUSIONS
1. Cold asphalt emulsion mixes (CAEMs) when properly designed and at full curing condition, even without the addition of cement were comparable in stiffness (ITSM) to hot mixes (of equivalent grade asphalt), although the porosity values were generally higher than in hot mixes. This is likely due to the effect of the quality of asphalt emulsion.
2. The addition of one to two percent cement by mass of aggregates into cold asphalt emulsion mixes significantly improves the overall mecha-nical performances of the CAEMs.
3. The application of heavier compaction level is inevitable in cold mixes, as the emulsion set (the bitumen droplets of the emulsion coalesce) hence the mixes stiffen during compaction.
Acknowledgment
The author would like to express his gratitude and deep appreciation to his Ph.D. study supervisorDr. S.E. Zoorob who had given guidance’s and supports during the course of investigation.
REFERENCES
1. Leech D., Cold Asphalt Materials for Use in the Structural Layers of Roads, Transport Research Laboratory, Project Report 75, UK, 1994.
2. Gibb, J.M., Evaluation of Resistance to Perma-nent Deformations in the Design of Asphalt Paving Mixes. Thesis submitted to the University of Nottingham for the degree of Doctor of Philosophy. Nottingham University, UK, 1996.
3. Nikolaides, A.F., Effect of binder content varia-tion on the stiffness and fatigue of asphaltic concrete, Proceedings of the Second European Symposium on Performance and Durability of Asphalt Materials, University of Leeds , Editor: J.G. Cabrera, Aedificatio Publishers, Zurich, 1997, pp. 227 to 240.
4. Read, J.M. and Brown, S.F., Fatigue Characte-risation of Asphalt Mixes Using a Simplified Test Method. Proceedings of the First European Symposium on Performance and Durability of Asphalt Materials, University of Leeds , March 1994 , Editor : J.G. Cabrera and J.R. Dixon , E & FN Spon , London, 1994, pp. 158 to 172.
5. Thanaya I.N.A, Improving The Performance of Cold Bituminous Emulsion Mixes (CAEMs) Incorporating Waste Materials, PhD Thesis, School of Civil Engineering, the University of Leeds, 2003.
6. Ministry of Public Works Republic of Indonesia (MPW-RI), Paving Specifications Utilizing As-phalt Emulsions, Jakarta – Indonesia, 1990.
7. Highway Authorities and Utilities Committee-HAUC, New Roads and Streetworks Act 1991– Specification for the Reinstatement of Opening in Highways, U.K, 1992.
8. Milton, L.J. and Earland, M.G., Design Guide and Specification for Structural Maintenance of Highway Pavements by Cold in-situ Recycling, Transport Research Laboratory Report 386, UK, 1999.
9. Cooper K.E., Brown S.F. and Pooley G.R., The Design of Aggregate Gradings for Asphalt Base Courses, Journal of The Association of Asphalt Paving Technologists, Vol. 54, 1985, pp. 324 to 346.
10. British Standard (BS) 4987-1 (2003), Coated Macadam (Asphalt Concrete) for Roads and Other Paved Areas, 2003.
11. Nikolaides, A.F., A New Design Method for Dense Cold Mixtures, Proceedings of the First European Symposium on Performance and Durability of Bituminous Materials, University of Leeds , March 1994 , Editor: J.G. Cabrera and J.R. Dixon , E & FN Spon , London, 1994, pp. 259 to 269.
12. British Standard (BS)-812, Testing Aggregates, 1995.
13. Nicholls, J.C., Asphalt Surfacings, E & FN SPON, London, 1998.
14. British Standard Draft for Development, BS DD-213, Method for the Determination of the Indirect Tensile Stiffness Modulus of Asphalt Mixes,1993.
15. British Standard Draft for Development, 2nd Draft-DD for Fatigue Characteristics, DD ABF- Method for the Determination of the Fatigue Characteristics of Bituminous Mixtures using Indirect Tensile Fatigue, 2002.
16. Whitoeak D, The Shell Asphalt Hand Book, Shell Asphalt, UK, 1991.