Mi
GLO
inistry
OBAL A
GA
of Hea
Gover
ADUL
ATS IN
alth an
rnment
LT TO
NDIA
nd Fam
t of Ind
BACC
2009-2
mily We
dia
CO SU
2010
elfare
GATS India Report 2009-2010
© Ministry of Health and Family Welfare, Government of India, New Delhi. All rights reserved.
The contents in this publication may be reproduced or translated free of charge after taking prior permission of the National Tobacco Control Programme, Ministry of Health & Family Welfare, Government of India, New Delhi – 110 011. However, short excerpts may be reproduced without authorization, on condition that the source is indicated and duly acknowledged. The material has to be reproduced accurately and not to be used in a derogatory manner or in a misleading context. The permission to reproduce this material shall not extend to any material which is identified as being copyright of a third party. The authorization to reproduce such material must be obtained from the departments/copyright holders concerned. This publication is also available on the website www.iipsindia.org, www.mohfw.nic.in.
The Global Adult Tobacco Survey (GATS) India, 2009-2010 has been conducted by the International Institute for Population Sciences, Mumbai as per the standard protocol under Global Tobacco Surveillance System (GTSS).
All reasonable precautions have been taken by the Ministry of Health & Family Welfare to verify the information contained in this publication. However, the published material is being distributed without warranty of any kind, either expressed or implied.
The 2009-2010 Global Adult Tobacco Survey (GATS) in India was successfully completed with the committed efforts and support of different organizations and individuals at various stages of the survey. At the outset we acknowledge our sincere gratitude to the Ministry of Health and Family Welfare (MoHFW), Government of India, for granting responsibility of conducting the Global Adult Tobacco Survey (GATS) in India to IIPS, Mumbai, and funding this project. We express our thanks to Miss. K. Sujatha Rao, Secretary to the Government of India, MoHFW; Dr. R. K. Srivastava, Director General of Health Services (DGHS); Shri Keshav Desiraju, Additional Secretary (H); Dr. Dinesh Bhatnagar, Additional Director General, Ms. Madhubala, ADG (Stats); Shri. S.K. Das, Former Additional Director General (Stats); Sh. B.K. Prasad, Joint Secretary, and Dr. D.C. Jain, DDG (NCD); for providing overall guidance and support during the tenure of the project.
We wish to put on record the contributions of Late Prof. P. N. Mari Bhat, the former Director & Sr. Professor (2005 -2007) of the IIPS, Mumbai, who was instrumental in undertaking the GATS-India project at the initial stage. We gratefully acknowledge valuable suggestions and contributions by Ms. Anuradha Vemuri, Director, MoHFW; Dr. Rattan Chand, Chief Director (Stats); Dr. Jagdish Kaur, Chief Medical Officer and Dr. Vinayak Prasad, former Director (PH) at various stages of the survey.
We extend our appreciation to all collaborative partner organizations viz., World Health Organization (WHO) Country office for India, WHO SEARO; Centers for Disease Control and Prevention (CDC); CDC Foundation, Atlanta; Research Triangle Institute (RTI) International and Johns Hopkins Bloomberg School of Public Health (JHSPH) for providing technical support in successfully conducting the GATS in India.
We gratefully acknowledge the immense help and guidance received time to time from Dr. Samira Asma, Associate Director, Atlanta and Dr. Krishna Mohan Palipudi, Senior Survey Statistician, CDC-Atlanta for their constant involvement and support at various stages of the project.
We sincerely acknowledge the WHO’s contribution to the project with special thanks to Dr. D. N. Sinha, Regional Surveillance Officer, WHO-SEARO and Ms. Vineet Gill Munish,National Professional Officer (TFI), WHO, India.
Our special thanks to all the members of Technical Advisory Committee and Technical Review Committee in particular Dr. K. Srinath Reddy, President, Public Health Foundation of India (PHFI), New Delhi and Dr. P. C. Gupta, Director, Healis-Sekhsaria Institute for Public Health, Mumbai.
This acknowledgement cannot be concluded without expressing appreciation for the efforts and hard work put in by the field investigators and supervisors in collecting data and all data managers for timely transferring data to IIPS.
Last but not the least, credit goes to all respondents who participated in GATS-India project.
L. Ladu Singh B. Paswan S. K. Singh K. C. Das
F. Ram S. Lahiri Sulabha Parasuraman
Prof. F. Ram
Prof. S. Lahiri
Prof. Sulabha Parasuraman
Prof. L. Ladu Singh
Prof. B. Paswan
Dr. S. K. Singh
GATS India Report 2009-2010
Chairman: Additional Secretary/ Joint Secretary in-charge of Tobacco Control Programme, MoHFW, GOI
Co-Chairman: Additional DG (Stats.), Dte.GHS, MoHFW
Members:
Shri Keshav Desiraju, Additional Secretary (H), MoHFW Shri V. Venkatachalam, Additional Secretary, MoHFW Shri Prabir Krishan, Joint Secretary, MoHFW
Shri B.K. Prasad, Joint Secretary MoHFW
Dr. Amarjit Singh, Former Joint Secretary, MoHFW Dr. Dinesh Bhatnagar, Addl DG (DB), Dte.GHS, MoHFW Shri. S. K. Das, Former ADG (Stats.), MoHFW
Dr. Rattan Chand, Chief Director (Stats.), MoHFW Ms. Anuradha Vemuri, Director, MoHFW
Dr. Jagdish Kaur, Chief Medical Officer, Dte.GHS, MoHFW Dr. Vinayak M. Prasad, Former Director (PH), MoHFW Prof. F. Ram, Director, IIPS
Prof. S. Lahiri, IIPS
Prof. Sulabha Parasuraman, IIPS Prof. L. Ladu Singh, IIPS Prof. B. Paswan, IIPS
Dr. S. K. Singh,Associate Professor, IIPS Dr. K. C. Das, Associate Professor, IIPS
Dr. K. Srinath Reddy, President, Public Health Foundation of India, Delhi Dr. P. C. Gupta, Director, Healis-Sekhsaria Institute of Public Health, Mumbai Dr. D. N. Sinha, Technical Officer- TFI, WHO-SEARO
Ms. Vineet Gill Munish, NPO-Tobacco Free Initiative, WHO India Dr. Samira Asma,Associate Director, CDC, Atlanta
Dr. Krishna Mohan Palipudi, Senior Survey Statistician,CDC, Atlanta
Dr. P. C. Gupta, Director, Healis-Sekhsaria Institute of Public Health, Mumbai Dr. K. Srinath Reddy, President, Public Health Foundation of India, Delhi Ms. Monika Arora, PHFI
Ms. Anuradha Vemuri, Director, MoHFW
Dr. Jagdish Kaur, Chief Medical Officer, Dte.GHS, MoHFW Dr. D. N. Sinha, Technical Officer- TFI, WHO-SEARO Dr. Samira Asma, Associate Director, CDC, Atlanta
Dr. Krishna Mohan Palipudi, Senior Survey Statistician,CDC, Atlanta Ms. Vineet Gill Munish, NPO-Tobacco Free Initiative, WHO India Dr. Vinayak Prasad, Former Director (PH), MoHFW
Edited by: Smt. Rita Vohra
Editorial Assistant: Ms. Pooja Gupta
Mr.Anand Kumar Panjiyar
CONTENTS Page No.
TABLES……….………..…...xv
FIGURES……….……….………... xxiv
MAPS……….………...………. xxvii
EXECUTIVE SUMMARY………..………...xxviii
CHAPTER 1 INTRODUCTION.………1
1.1 Tobacco Control Policies in India………...2
1.2 Tobacco Use in India……….………...…….3
1.3 Survey Objectives………...7
CHAPTER 2 METHODOLOGY………...9
2.1 Study Population………..……...…9
2.2 Sampling Design……….…..…9
2.3 Questionnaire………...11
2.4 Questionnaire Programming and Preparation of Handheld Computers……….………....12
2.5 Recruitment, Training and Fieldwork………...13
2.6 Data Processing and Aggregation………..………...………..16
2.7 Statistical Analysis………...…17
CHAPTER 3 SAMPLE AND POPULATION CHARACTERISTICS…………..……….…………19
3.1 Sample Coverage, Household and Person-Level Response Rates………..………...….…19
3.2 Characteristics of Sampled Respondents………..…...23
3.3 States and Regional Population Distribution………..…...24
CHAPTER 4 TOBACCO USE……….………...25
4.1 Tobacco Use………..………..…25
4.2 Tobacco Smoking………...…...43
4.3 Use of Smokeless Tobacco …..……….….….72
CHAPTER 5 TOBACCO CESSATION………....…...….…97
5.1 Cessation Attempts, Health Care Seeking Behaviour of Tobacco Users and Advice by Health Care Providers………..………...…..97
5.2 Cessation Method.………...…...105
5.3 Interest in Quitting Tobacco………...110
GATS India Report 2009-2010
CHAPTER 6 SECOND-HAND SMOKE………...……….….123
6.1 Exposure to Second-Hand Smoke (SHS) in Indoor Workplaces…………...………...…123
6.2 Exposure to Second-Hand Smoke at Home……….………….…127
6.3 Exposure to Second-Hand Smoke at Various Public Places……….…....131
6.4 Designated Non-Smoking Area and Smoking in Designated Non-Smoking Area……..134
CHAPTER 7 ECONOMIC ASPECT OF TOBACCO USE………...………...139
7.1 Source of Last Purchase of Smoking and Smokeless Tobacco………....139
7.2 Brands of Smoking Tobacco……….……….…...147
7.3 Expenditure on Smoking and Smokeless Tobacco……….……...….…..…151
CHAPTER 8 MEDIA……….163
8.1 Noticed Anti-Tobacco Information in Various Media……….…..…...163
8.2 Noticing Health Warning on Various Tobacco Products and Thinking of Quitting.…...169
8.3 Noticed Marketing of Different Tobacco Products in Various Places…...173
CHAPTER 9 KNOWLEDGE, ATTITUDES AND PERCEPTIONS………...…...185
9.1 Beliefs about the Health Effects of Smoking………...185
9.2 Health Effects of Using Smokeless Tobacco………...194
9.3 Health Effects of Second-Hand Smoke (SHS)……….………….197
CHAPTER 10 CONCLUSION AND RECOMMENDATIONS……….….…..203
References……….…...207
Appendix A Sample Design……….…..…...…...211
Appendix B Sampling Error……….………...219
Appendix C Glossary of Terms……….………….…....…233
Appendix D Technical and Survey Staff………..………...239
Appendix E Questionnaire………...243
Appendix F MPOWER Summary Indicators………...……...285
Table No. Content of the Tables Page No.
CHAPTER 1 INTRODUCTION
Table 1 Prevalence of tobacco use in India………..………...…...…..6
CHAPTER 3 SAMPLE AND POPULATION CHARACTERISTICS
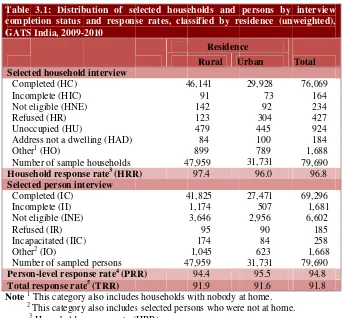
Table 3.1 Distribution of selected households and persons by interview completion status and response rates, classified by residence (unweighted), GATS
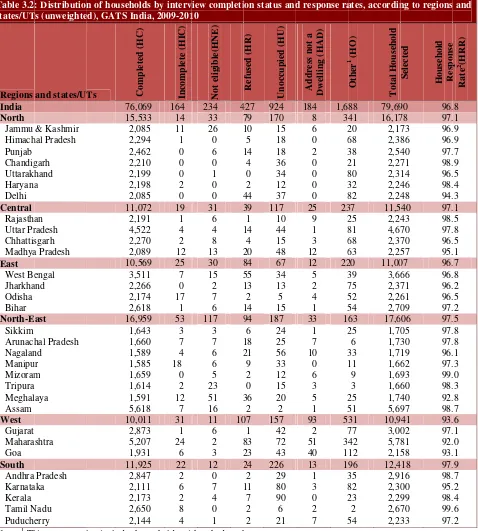
India, 2009-2010………...………....…...20 Table 3.2 Distribution of households by interview completion status and response
rates, according to regions and states/UTs (unweighted), GATS India,
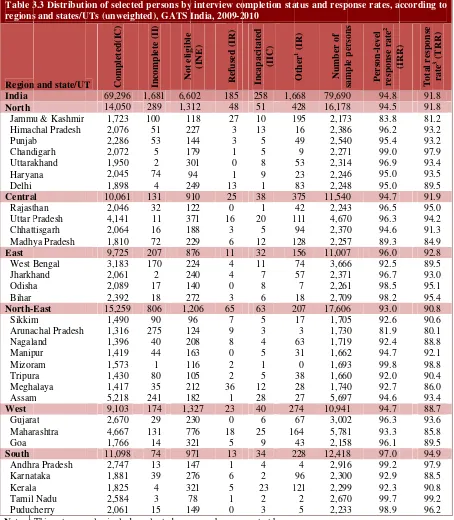
2009-2010………...……….……...21 Table 3.3 Distribution of selected persons by interview completion status and response
rates, according to regions and states/UTs (unweighted), GATS India,
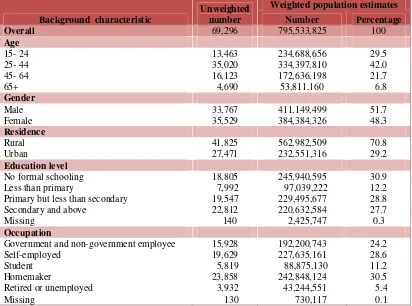
2009-2010……….……….………..……...22 Table 3.4 Unweighted sample counts and weighted population estimates according
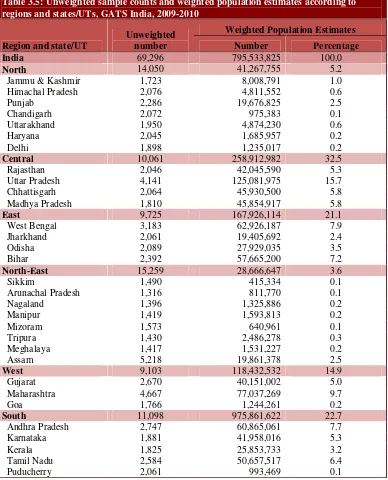
to selected background characteristics, GATS India, 2009-2010…….………..…..23 Table 3.5 Unweighted sample counts and weighted population estimates according
to regions and states/UTs, GATS India, 2009-2010………...………...24
CHAPTER 4 TOBACCO USE
Table 4.1 Percentage of adults age 15 and above by detailed status of tobacco
use, according to gender and residence, GATS India, 2009-2010…………..………..…26 Table 4.2 Number of adults age 15 and above by detailed status of tobacco use,
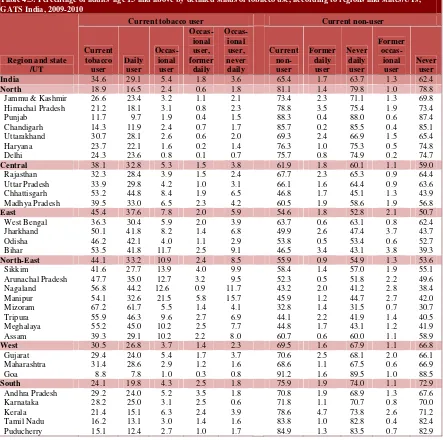
according to gender and residence, GATS India, 2009-2010……….………...26 Table 4.3 Percentage of adults age 15 and above by detailed status of tobacco use,
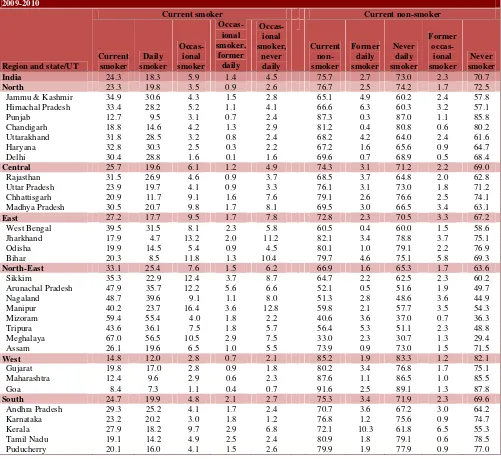
according to regions and states/UTs, GATS India, 2009-2010………...…....29 Table 4.4 Percentage of males age 15 and above by detailed status of tobacco
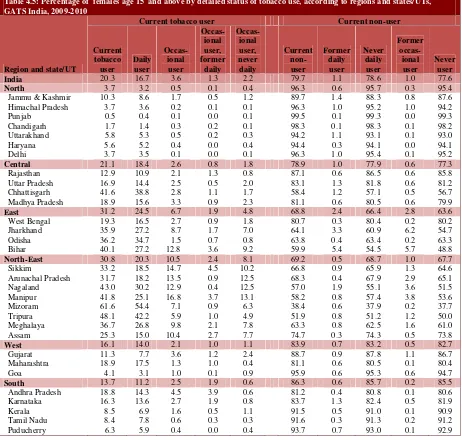
use, according to regions and states/UTs, GATS India, 2009-2010……...……...……...30 Table 4.5 Percentage of females age 15 and above by detailed status of tobacco
use, according to regions and states/UTs, GATS India, 2009-2010………….….…..….31 Table 4.6 Percent distribution of adults age 15 and above who are current tobacco
users by tobacco use pattern, according to background characteristics,
GATS India, 2009-2010……….……….……..…34 Table 4.7 Percent distribution of adults age 15 and above who are current tobacco
users by tobacco use pattern, according to regions and states/UTs, GATS
India, 2009-2010………....…...35 Table 4.8 Percent distribution of males age 15 and above who are current tobacco
users by tobacco use pattern, according to regions and states/UTs, GATS
India, 2009-2010………....…...36 Table 4.9 Percent distribution of females age 15 and above who are current tobacco
GATS India Report 2009-2010
GATS India, 2009-2010………...…..37 Table 4.10 Percent distribution of ever daily tobacco users age 20-34 by age at tobacco
use initiation and gender, according to selected background characteristics,
GATS India, 2009-2010………..………...…...38 Table 4.11 Percent distribution of age at initiation among ever daily tobacco users
age 20-34 by age at tobacco use initiation, according to regions and
states/UTs, GATS India, 2009-2010………..…...…....39 Table 4.12 Percent distribution of daily tobacco users age 15 and above by time in
minutes to first tobacco use after waking up, according to selected
background characteristics, GATS India, 2009-2010……….………..40 Table 4.13 Percent distribution of daily tobacco users age 15 and above by time in
minutes to first tobacco use after waking up among daily smokers and users of smokeless tobacco, according to regions and states/UTs,
GATS India, 2009-2010………..…...……...42 Table 4.14 Percentage of adults age 15 and above by detailed status of smoking,
according to gender and residence, GATS India, 2009-2010……….….……...…...43 Table 4.15 Number of adults age 15 and above by detailed status of smoking,
according to gender and residence, GATS India, 2009-2010……….…...…....44 Table 4.16 Percentage of adults age 15 and above by detailed status of smoking,
according to regions and states/UTs, GATS India, 2009-2010……….……...…...45 Table 4.17 Percentage of males age 15 and above by detailed status of smoking,
according to regions and states/UTs, GATS India, 2009-2010………....…46 Table 4.18 Percentage of females age 15 and above by detailed status of smoking,
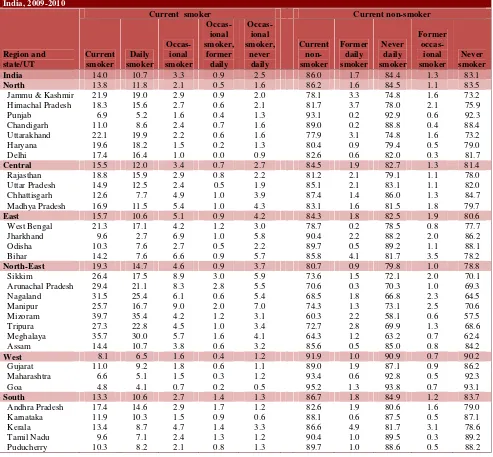
according to regions and states/UTs, GATS India, 2009-2010………...……...47 Table 4.19 Percentage of adults age 15 and above who are current smokers of various
smoked tobacco products by gender, according to background
characteristics, GATS India, 2009-2010……….….……..….…..52 Table 4.20 Number of adults age 15 and above who are current smokers of
various smoking tobacco products, according to residence and gender,
GATS India, 2009-2010……….………...53 Table 4.21 Percentage of adults age 15 and above who are current smokers of various
smoked tobacco products, according to regions and states/UTs, GATS
India, 2009-2010………...………...….54 Table 4.22 Percentage of males age 15 and above who are current smokers of various
smoked tobacco products, according to regions and states/UTs, GATS
India, 2009-2010………...….55 Table 4.23 Percentage of females age 15 and above who are current smokers of various
smoked tobacco products, according to regions and states/UTs, GATS India,
2009-2010……….………56 Table 4.24 Percent distribution of adults age 15 and above by status of smoking and
background characteristics, GATS India, 2009-2010...…..61 Table 4.27 Percent distribution of current daily cigarette smokers age 15 and above by
number of cigarettes smoked on an average per day, according to regions
and states/UTs, GATS India, 2009-2010………...…………...………62 Table 4.28 Percent distribution of current daily bidi smokers age 15 and above by
number of bidis smoked on an average per day and gender, according to
background characteristics, GATS India, 2009-2010………..……...….64 Table 4.29 Percent distribution of current daily bidi smokers age 15 and above by
number of bidis smoked on an average per day, according to regions and
states/UTs, GATS India, 2009-2010………..……..….65 Table 4.30 Percent distribution of ever daily smokers age 20-34 by age at smoking
initiation, according to selected background characteristics, GATS
India, 2009-2010………...66 Table 4.31 Percent distribution of ever daily smokers age 20-34 by age at smoking
initiation, according to regions and states/UTs, GATS India, 2009-2010……...…...67 Table 4.32 Percentage of adults age 15 and above who were former daily smokers,
percentage of ever daily smokers who were former daily smokers, according
to background characteristics, GATS India, 2009-2010……….………….68 Table 4.33 Percentage of adults age 15 and above who were former daily smokers,
percentage of ever daily smokers who were former daily smokers,
according to regions and states/UTs, GATS India, 2009-2010………...….69 Table 4.34 Percent distribution of former daily smokers age 15 and above by time
since quitting smoking, according to selected background characteristics,
GATS India, 2009-2010………..…………..70 Table 4.35 Percent distribution of former daily smokers age 15 and above by
time since quitting smoking, according to regions and states/UTs,
GATS India, 2009-2010………....…...…71 Table 4.36 Percentage of adults age 15 and above by detailed status of
smokeless tobacco use, according to gender and residence, GATS India,
2009-2010………...………..72 Table 4.37 Number of adults age 15 and above by detailed status of
use of smokeless tobacco, according to gender and residence, GATS
India, 2009-2010……….………...…….…..73 Table 4.38 Percentage of adults age 15 and above by detailed status of use of smokeless
tobacco, according to regions and states/UTs, GATS India, 2009-2010…………..…....76 Table 4.39 Percentage of males age 15 and above by detailed use of status of smokeless
tobacco, according to regions and states/UTs, GATS India, 2009-2010……….….77 Table 4.40 Percentage of females age 15 and above by detailed status of use of
smokeless tobacco, according to regions and states/UTs, GATS India, 2009-2010…....78 Table 4.41 Percentage of adults age 15 and above who are current users of various
smokeless tobacco products, by gender, according to background
characteristics, GATS India, 2009-2010………..80 Table 4.42 Number of adults age 15 and above who are current
smokers/current users of various smokeless tobacco products,
GATS India Report 2009-2010
Table 4.43 Percentage of adults age 15 and above who are current users of various smokeless tobacco products, according to regions and states/UTs,
GATS India, 2009-2010………..………...….83 Table 4.44 Percentage of males age 15 and above who are current users of various
smokeless tobacco products, according to regions and states/UTs,
GATS India, 2009-2010………...……….84 Table 4.45 Percentage of females age 15 and above who are current users of various
smokeless tobacco products, according to regions and states/UTs,
GATS India, 2009-2010………...………...….85 Table 4.46 Percent distribution of adults age 15 and above by status of use of smokeless
tobacco, by gender, according to background characteristics,
GATS India, 2009-2010………..…………...87 Table 4.47 Percent distribution of adults age 15 and above by status of
use of smokeless tobacco, according to regions and states/UTs, GATS
India, 2009-2010………..……..…...88 Table 4.48 Percent distribution of ever daily users of smokeless tobacco age 20-34 by
age at use of smokeless tobacco initiation, according to selected background
characteristics, GATS India, 2009-2010……….……....……..89 Table 4.49 Percent distribution of ever daily users of smokeless tobacco age 20-34 by
age at use of smokeless tobacco initiation, according to regions and
states/UTs, GATS India, 2009-2010………...………...…..…90
Table 4.50 Percentage of adults age 15 and above of former daily users of smokeless tobacco, percentage of ever daily users of smokeless tobacco who were former daily users of smokeless tobacco, according to background
characteristics, GATS India, 2009-2010……….………..…....91 Table 4.51 Percentage of adults age 15 and above who were former daily users of
smokeless tobacco, percentage of ever daily users of smokeless tobacco who were former daily users of smokeless tobacco, according to regions
and states/UTs, GATS India, 2009-2010……….………….92 Table 4.52 Percent distribution of former daily users of smokeless tobacco age 15 and
above by time since quitting smokeless tobacco, according to selected
background characteristics, GATS India, 2009-2010………...………93 Table 4.53 Percent distribution of former daily users of smokeless tobacco age 15 and
above by time since quitting smokeless tobacco, according to regions and
states/UTs, GATS India, 2009-2010……….………94
CHAPTER 5 TOBACCO CESSATION
and were advised to quit by the HCP in the past 12 months, according
to regions and states/UTs, GATS India, 2009-2010………...…….……100 Table 5.3 Percentage of users of smokeless tobacco age 15 and above who made
a quit attempt, visited a health care provider (HCP), were asked by the HCP if using smokeless tobacco and were advised to quit by the HCP in the past 12 months, according to background characteristics, GATS India,
2009-2010………...….……...103 Table 5.4 Percentage of users of smokeless tobacco age 15 and above who made
a quit attempt, visited a health care provider (HCP), were asked by the HCP if using smokeless tobacco and were advised to quit by the HCP in the past 12 months, according to regions and states, GATS India,
2009-2010……….…...…104 Table 5.5 Percentage of smokers age 15 and above who tried to stop smoking in
the past 12 months by use of different cessation methods during last quit attempt, according to background characteristics, GATS India,
2009-2010………..……….….…106 Table 5.6 Percentage of smokers age 15 and above who tried to stop smoking in the
past 12 months by use of different cessation methods during their last
quit attempt, according regions and states/UTs, GATS India, 2009-2010……...….…107 Table 5.7 Percentage of users of smokeless tobacco age 15 and above who tried
to stop use of smokeless tobacco in the past 12 months by use of different cessation methods during their last attempt, according to background
characteristics, GATS India, 2009-2010……….………..……...…..108 Table 5.8 Percentage of users of smokeless tobacco age 15 and above who tried
to stop use of smokeless tobacco in the past 12 months by use of different cessation methods during their last quit attempt, according to
regions and states/UTs, GATS India, 2009-2010………....…....……109 Table 5.9 Percent distribution of current smokers age 15 and above by their
interest in quitting smoking, according to background characteristics,
GATS India, 2009-2010……….………...111 Table 5.10 Percent distribution of current smokers age 15 and above by their
interest in quitting smoking, according to regions and states/UTs,
GATS India, 2009-2010………...……...112 Table 5.11 Percent distribution of current users of smokeless tobacco age 15 and
above by their interest in quitting smokeless tobacco, according to
background characteristics, GATS India, 2009-2010………...….……..114 Table 5.12 Percent distribution of current users of smokeless tobacco age 15 and
above by their interest in quitting smokeless tobacco, according to
regions and states/UTs, GATS India, 2009-2010………...….115 Table 5.13 Percent distribution of current cigarette smokers, bidi smokers and users
of smokeless tobacco age 15 and above who made a quit attempt in past 12 months by duration of stopping use of tobacco products, according to
background characteristics, GATS India, 2009-2010……….……...…..118 Table 5.14 Percent distribution of current cigarette smokers, bidi smokers and users
GATS India Report 2009-2010
months by duration of stopping use of tobacco products, according to regions and states/UTs, GATS India, 2009-2010……….…...119
CHAPTER 6 SECOND-HAND SMOKE
Table 6.1 Percentage of adults age 15 and above who work indoors and are exposed to second-hand smoke at work by smoking status, according to
background characteristics, GATS India, 2009-2010……….…..124 Table 6.2 Percentage of adults age 15 and above who work indoors and are
exposed to second-hand smoke at work by smoking status, according to
regions and states/UTs, GATS India, 2009-2010………..………...…125 Table 6.3 Percentage of adults age 15 and above who reported smoking is allowed
at home and are exposed to second-hand smoke at home by smoking status,
according to background characteristics, GATS India, 2009-2010………...128 Table 6.4 Percentage of adults age 15 and above who reported smoking is allowed
at home and are exposed to second-hand smoke at home by smoking status,
according to regions and states/UTs, GATS India, 2009-2010………...129 Table 6.5 Percentage of adults age 15 and above who visited any public place and
exposed to second-hand smoke in public places in the past 30 days, according
to background characteristics, GATS India, 2009-2010………...…..131 Table 6.6 Percentage of adults age 15 and above who visited any public place and
exposed to second-hand smoke in public places in the past 30 days, according
to regions and states/UTs, GATS India, 2009-2010………..…...…133 Table 6.7 Percentage of adults age 15 and above who have visited any restaurant and
seen a designated non-smoking area with clear sign inside the restaurant and observed smoking in designated non-smoking areas in the past 30 days,
according to background characteristics, GATS India, 2009-2010………..…....135 Table 6.8 Percentage of adults age 15 and above who have visited any restaurant seen a
designated non-smoking area with clear signs inside the restaurant and observed smoking in designated non-smoking area in the past 30 days,
according to regions and states/UTs, GATS India, 2009-2010………137
CHAPTER 7 ECONOMIC ASPECT OF TOBACCO USE
Table 7.1 Percent distribution of current cigarette smokers age 15 and above by
source of last purchase of cigarette, according to background characteristics,
GATS India, 2009-2010………..…….…….…...140 Table 7.2 Percent distribution of current cigarette smokers age 15 and above by source
of last purchase of cigarette, according to regions and states/UTs, GATS India,
India, 2009-2010………..……..…...143 Table 7.5 Percent distribution of current users of smokeless tobacco age 15 and above by
source of last purchase of smokeless tobacco, according to background
characteristics, GATS India, 2009-2010……….…...…...144 Table 7.6 Percent distribution of current users of smokeless tobacco age 15 and above by
source of last purchase of smokeless tobacco, according to regions and states/
UTs, GATS India, 2009-2010………....…...146 Table 7.7 Percent distribution of current smokers of manufactured cigarette age 15
and above by brand of cigarette purchased last, according to background
characteristics, GATS India, 2009-2010………...…...147 Table 7.8 Percent distribution of current smokers of manufactured cigarette age 15
and above by brand of cigarette purchased last, according to regions and
states/UTs, GATS India, 2009-2010………..…………....…..….…148 Table 7.9 Percent distribution of current bidi smokers age 15 and above by brand of bidi
purchased last, according to background characteristics, GATS India,
2009-2010………..…..….150 Table 7.10 Percent distribution of current bidi smokers age 15 and above by brand of bidi
purchased last, according to regions and states/UTs, GATS India, 2009-2010………...151 Table 7.11 Average tobacco expenditures (in `) in the last purchase incurred by current
cigarette smoker, bidi smoker and user of smokeless tobacco, according to
background characteristics, GATS India, 2009-2010………..………….………....153 Table 7.12 Average tobacco expenditure (in `) in the last purchase incurred by current
cigarette smoker, bidi smoker and user of smokeless tobacco, according to
regions and states/UTs, GATS India, 2009-2010……….……...…....….156 Table 7.13 Average monthly expenditures (in `) incurred by daily smoker of manufactured
cigarette and bidi, according to background characteristics, GATS India,
2009-2010………..…..….158 Table 7.14 Average monthly expenditure (in `) incurred by daily smoker of cigarette and
bidi, according to regions and states/UTs, GATS India, 2009-2010………...……...…160
CHAPTER 8 MEDIA
Table 8.1 Percentage of adults age 15 and above who noticed anti-tobacco
information during the last 30 days in various places by status of smoking
and use of smokeless tobacco, GATS India, 2009-2010...165 Table 8.2 Percentage of adults age 15 and above who noticed anti-tobacco information
during the last 30 days at any location by status of smoking and use of smokeless tobacco, according to selected background characteristics, GATS
India, 2009-2010………....…...165 Table 8.3 Percentage of adults age 15 and above who noticed anti-tobacco information
during the last 30 days at any location by status of smoking and use of smokeless tobacco, according to regions and states/UTs, GATS India,
2009-2010………..…...167 Table 8.4 Percentage of current cigarette smokers age 15 and above who noticed health
GATS India Report 2009-2010
label on cigarette packages during the last 30 days by gender, according to
background characteristics, GATS India, 2009-2010………..…...169 Table 8.5 Percentage of current bidi smokers age 15 and above who noticed health
warning on bidi package and thought of quitting because of the warning label on bidi package during the last 30 days by gender, according to background
characteristics, GATS India, 2009-2010………..….172 Table 8.6 Percentage of current users of smokeless tobacco age 15 and above who
noticed health warning on smokeless tobacco products package and thought of quitting because of the warning label on smokeless tobacco products
packages during the during the last 30 days by gender, according to background
characteristics, GATS India, 2009-2010………..……...173 Table 8.7 Percentage of adults age 15 and above who noticed cigarette, bidi and
smokeless tobacco products marketing during the last 30 days at various places
by status of smoking and use of smokeless tobacco, GATS India, 2009-2010……....…175 Table 8.8 Percentage of adults age 15 and above who noticed cigarette marketing during
the last 30 days at various places by status of smoking, according to background
characteristics, GATS India, 2009-2010……….…...177 Table 8.9 Percentage of adults age 15 and above who noticed cigarette marketing during
the last 30 days at any place by status of smoking, according to regions and
states/UTs, GATS India, 2009-2010………....….178 Table 8.10 Percentage of adults age 15 and above who noticed bidi marketing during the
last 30 days at various places by status of smoking, according to background
characteristics, GATS India, 2009-2010………...179 Table 8.11 Percentage of adults age 15 and above who noticed bidi marketing during the
last 30 days at any place by status of smoking, according to regions and
states/UTs, GATS India, 2009-2010………...….180 Table 8.12 Percentage of adults age 15 and above who noticed smokeless tobacco
marketing during the last 30 days at various places by status of smokeless
tobacco use, according to background characteristics, GATS India, 2009-2010……….181 Table 8.13 Percentage of adults age 15 and above who noticed smokeless tobacco
products marketing during the last 30 days at any place by status of smokeless
tobacco use, according to regions and states/UTs, GATS India, 2009-2010………...183
CHAPTER 9 KNOWLEDGE, ATTITUDES AND PERCEPTIONS
Table 9.1 Percentage of adults age 15 and above who believe that smoking causes serious illness, stroke, heart attack and lung cancer by status of smoking,
according to background characteristics, GATS India, 2009-2010………...…….186 Table 9.2 Percentage of males age 15 and above who believe that smoking causes serious
illness, stroke, heart attack and lung cancer by status of smoking, according to
serious illness, stroke, heart attack and lung cancer by status of smoking,
according to regions and states/UTs, GATS India, 2009-2010………...…...…..…191 Table 9.5 Percentage of adults age 15 and above who believe that use of smokeless
tobacco causes serious illness by gender and status of smokeless tobacco use,
according to background characteristics, GATS India, 2009-2010………...….195 Table 9.6 Percentage of adults age 15 and above who believe that use of smokeless
tobacco causes serious illness by gender and status of smokeless tobacco use,
according to regions and states/UTs, GATS India, 2009-2010………...……...…197 Table 9.7 Percentage of adults age 15 years and above who believe that breathing other people
smoke causes serious illness among non-smokers by gender and status of
characteristics, GATS India, 2009-2010………..…...199 Table 9.8 Percentage of adults age 15 and above who believe that breathing other people
smoke causes serious illness among non-smokers by status of smoking,
Figure No. Contents of Figures Page No.
CHAPTER 2 METHODOLOGY
Figure 2.1 Data management implementation design, GATS India, 2009-2010…….…..…………..………17
CHAPTER 4 TOBACCO USE
Figure 4.1 Percentage of current tobacco users according to states/UTs, GATS India,
2009-2010 ………..…….………27 Figure 4.2 Percentage distribution of tobacco according to gender, GATS India, 2009-2010……….…...…32 Figure 4.3 Percentage of current tobacco users by background characteristics, GATS India
2009-2010………...……….33 Figure 4.4 Percentage of current smokers age 15 and above according to states/UTs,
GATS India, 2009-2010……….……….……….…….…..48 Figure 4.5 Percentage of current smokers age 15 and above by various smoking
products, GATS India, 2009-2010……….……….…....…50 Figure 4.6 Percentage of current smokers age 15 and above by background characteristics,
GATS India, 2009-2010………...…….………51 Figure 4.7 Percent distribution of daily cigarette smokers by number of cigarettes smoked on
an average per day, according to gender, GATS India, 2009-2010……….……...60 Figure 4.8 Percent distribution of current bidi smokers by number of bidis smoked on
an average per day, according to gender, GATS India, 2009-2010………...63 Figure 4.9 Percentage of current users of smokeless tobacco according to states/UTs,
GATS India, 2009-2010………...…..…….74 Figure 4.10 Percentage of current users of smokeless tobacco age 15 and above by
various products, GATS India, 2009-2010………...………..……...….……79 Figure 4.11 Percentage of current users of smokeless tobacco by background
characteristics, GATS India, 2009-2010………....…….81
CHAPTER 5 TOBACCO CESSATION
Figure 5.1 Percentage of smokers who made a quit attempt in the past 12 months
according to states/UTs, GATS India, 2009-2010………....………....…..99 Figure 5.2 Percentage of users of smokeless tobacco age 15 and above who made a quit
attempt in the past 12 months, according to states/UTs, GATS India, 2009-2010……….….….101 Figure 5.3 Percent distribution of current smokers by interest in quitting smoking,
GATS India, 2009-2010……….….…..110 Figure 5.4 Percent distribution of current users of smokeless tobacco by interest in
quitting smokeless tobacco, GATS India, 2009-2010………...…………...……113
CHAPTER 6 SECOND-HAND SMOKE
GATS India Report 2009-2010
2009-2010………..………..…..126 Figure 6.2 Exposure to SHS among adults at home according to states/UTs, GATS India,
2009-2010………..……….…………..….130 Figure 6.3 Exposure to SHS among adults at different public places, GATS India, 2009-2010………..….132 Figure 6.4 Exposure to SHS among adults at any public place according to states/UTs,
GATS India, 2009-2010………..……...…134 Figure 6.5 Adults seen a designated non-smoking area in the restaurant and observed someone
smoking in the designated non-smoking area, GATS India, 2009-2010...136
CHAPTER 7 ECONOMIC ASPECT OF TOBACCO USE
Figure 7.1 Percent distribution of current smokers of cigarettes, bidi and users of smokeless
tobacco by source of their last purchase, GATS India, 2009-2010……...145 Figure 7.2 Average expenditure (in `) incurred by current cigarette, bidi and users of smokeless
tobacco during the last purchase, according to residence, GATS India 2009-2010…………...152 Figure 7.3 Average expenditure (in `) incurred by cigarette smokers, bidi smokers in their last
purchase according to states/UTs, GATS India, 2009-2010……….…....154 Figure 7.4 Average expenditure (in `) incurred by users of smokeless tobacco in their last
purchase according to states/UTs, GATS India, 2009-2010………….…………..…...…….…..155 Figure 7.5 Average monthly expenditure (in `)incurred by current cigarette and bidi smokers
by background characteristics, GATS India, 2009-2010………...…157 Figure 7.6 Average monthly expenditure incurred by current cigarette and bidi smokers
according to states/UTs, GATS India, 2009-2010……….………..…….159
CHAPTER 8 MEDIA
Figure 8.1 Percentage of adults who noticed anti-tobacco information during the last
30 days in various places, GATS India, 2009-2010………....…..164 Figure 8.2 Percentage of adults who noticed anti-cigarette, anti-bidi and anti-smokeless tobacco
information at any location according to states/UTs, GATS India, 2009-2010..……...…..168 Figure 8.3 Percentage of current cigarette smokers who noticed health warning on cigarette
package and who thought of quitting because of the same, according to gender,
GATS India, 2009-2010……….……….………..….…..….170
Figure 8.4
Percentage of current bidi smokers and users of smokeless tobacco who noticed health warning on bidi and smokeless tobacco product package and who thought of quitting because of the same, according to gender, GATS India,
2009-2010………...…………..………..……..….…171 Figure 8.5 Percentage of adults who noticed cigarette, bidi and smokeless tobacco product
CHAPTER 9 KNOWLEDGE, ATTITUDES AND PERCEPTIONS
Figure 9.1 Percentage of adults who believe that smoking causes stroke, heart attack
and lung cancer by smoking status, GATS India, 2009-2010………...………187 Figure 9.2 Percentage of adults who believe that smoking causes, stroke, heart attack
and lung cancer by smoking status and gender, GATS India, 2009-2010……….…...190 Figure 9.3 Percentage of adults who believe that smoking causes stroke, heart attack
according to states/UTs, GATS India, 2009-2010………...…....…193 Figure 9.4 Percentage of adults who believe that SHS causes serious illness in non-smokers
GATS India Report 2009-2010
Map No. Contents of Maps Page No.
CHAPTER 4 TOBACCO USE
Map 4.1 Percentage of current tobacco users in India and its states/UTs
GATS India, 2009-2010………..………...28 Map 4.2 Percentage of current smokers in India and its states/UTs
GATS India, 2009-2010………..………..49 Map 4.3 Percentage of current users of smokeless tobacco in India and its
states/UTs GATS India, 2009-2010………...……..….75
The Global Adult Tobacco Survey India (GATS India) is the global standard for systematically monitoring adult tobacco use (smoking and smokeless) and tracking key tobacco control indicators. Global Adult Tobacco Survey India was carried out in all 29 states of the country and 2 Union Territories of Chandigarh and Puducherry, covering about 99.9 percent of the total population of India. The major objectives of the survey were to obtain estimates of prevalence of tobacco use (smoking and smokeless tobacco); exposure to second-hand smoke; cessation; the economics of tobacco; exposure to media messages on tobacco use; and knowledge, attitudes and perceptions towards tobacco use.
The Ministry of Health & Family Welfare (MoHFW), Government of India, designated the International Institute for Population Sciences (IIPS), Mumbai, as the nodal agency for conducting GATS in India. Technical assistance was provided by the Centers for Disease Control and Prevention (CDC), the World Health Organization (WHO), the Johns Hopkins Bloomberg School of Public Health, and Research Triangle Institute International (RTI International).
GATS India was conducted in 2009–2010 as a household survey of persons age 15 and above. A nationally representative probability sample was used to provide national and regional (North, West, East, South, Central and North-East) estimates by residence (urban and rural) and gender and state estimates by gender. The survey was designed to produce internationally comparable data on tobacco use and other tobacco control indicators using a standardized questionnaire, sample design, data collection and management procedures. GATS India was the first nationwide survey in which electronic handheld devices were used for data collection and management. A total of 69,296 interviews were completed among which 33,767 and 35,529 were of males and females respectively. Out of all completed interviews, 41,825 interviews were conducted in rural areas and 27,471 interviews in urban areas. The overall response rate was 91.8 percent which ranged from the highest of 99.2 percent in Tamil Nadu to the lowest of 80.1 in Arunachal Pradesh.
Tobacco use
GATS India revealed that more than one-third (35%) of adults in India use tobacco in some form or the other. Among them 21 percent adults use only smokeless tobacco, 9 percent only smoke and 5 percent smoke as well as use smokeless tobacco. Based on these, the estimated number of tobacco users in India is 274.9 million, with 163.7 million users of only smokeless tobacco, 68.9 million only smokers, and 42.3 million users of both smoking and smokeless tobacco. The prevalence of overall tobacco use among males is 48 percent and that among females is 20 percent. Nearly two in five (38%) adults in rural areas and one in four (25%) adults in urban areas use tobacco in some form. Prevalence of smoking among males is 24 percent whereas the prevalence among females is 3 percent. The extent of use of smokeless tobacco products among males (33%) is higher than among females (18%).
The prevalence of tobacco use among all the states and Union Territories ranges from the highest of 67 percent in Mizoram to the lowest of 9 percent in Goa. Prevalence of tobacco use in Arunachal Pradesh, Bihar, Chhattisgarh, Jharkhand, Madhya Pradesh, Manipur, Meghalaya, Mizoram, Nagaland, Odisha, Sikkim, Tripura, Assam and West Bengal is higher than the national average. In most of the states/UTs,
GATS India Report 2009-2010
the prevalence of both smoking and smokeless tobacco use among males is higher than among females with exceptions in Puducherry, Tamil Nadu, Meghalaya, Tripura and Mizoram, where prevalence of smokeless tobacco is higher among females than males. More than 75 percent of tobacco users, both smokers as well as users of smokeless tobacco are daily users of tobacco. In India, khaini or tobacco-lime mixture (12%) is the most commonly used smokeless tobacco product, followed by gutkha, a mixture of tobacco, lime and areca nut mixture (8%), betel quid with tobacco (6%) and applying tobacco as dentifrice (5%). The prevalence of each of the smokeless tobacco products, except dentifrice, is higher among males than females. Among smoking tobacco products, bidi (9%) is used most commonly followed by the cigarette (6%) and the hookah (1%).
Among both males and females, the prevalence of cigarette smoking is higher in urban areas but the prevalence of all other smoking products is higher in rural areas. The prevalence of each of the smokeless tobacco product is higher in rural than urban areas, however, gutkha is almost equally prevalent in both urban and rural areas.
On an average a daily cigarette smoker in India smokes 6.2 cigarette sticks per day, and a daily bidi smoker smokes 11.6 bidi sticks per day. One-fourth of daily cigarette smokers smoke more than 10 cigarettes per day, and more than half of the daily bidi smokers smoke more than 10 bidis per day.
The mean age at initiation of daily tobacco use for tobacco users age 20–34 years is 17.8 years. The mean age at initiation of smoking as well as use of smokeless tobacco among users of respective products age 20-34 years is 17.9 years. Two in every five daily tobacco users age 20–34 had started using tobacco daily before attaining the age of 18. The quit ratio for smoking (defined as former smokers among ever daily smokers) is 13 percent, while the quit ratio for use of smokeless tobacco use (defined as former users of smokeless tobacco among ever daily users of smokeless tobacco) is 5 percent. Three in five (60%) daily tobacco users use tobacco within 30 minutes of waking up in the morning.
Tobacco Cessation
Nearly two in five smokers (38%) and users of smokeless tobacco (35%) made an attempt to quit respective tobacco use in the past 12 month period prior to the survey. Among smokers, males and females equally reported (38% of males and 39% of females) that they made a quit attempt. Among smokeless tobacco users fewer females (29%) made a quit attempt compared to males (39%). There is considerable variation in quit attempts across states/UTs. For smoking it ranges from 12 percent in Delhi to 55 percent in Andhra Pradesh. For users of smokeless tobacco it ranges from 8 percent in Delhi to 54 percent in Madhya Pradesh.
than one-third (34%) were asked by the health care provider whether they used smokeless tobacco and only 27 percent were advised to stop such use.
Second-hand smoke
GATS India shows that 52 percent of adults were exposed to second-hand smoke (SHS) at home. In rural areas 58 percent and in urban areas 39 percent were exposed to SHS at home. The SHS exposure at home ranged from the highest of 97 percent in Mizoram to the lowest of 10 percent in Tamil Nadu. Exposure to SHS in indoor workplaces who usually work indoors or both indoors and outdoors was 30 percent. The exposure to SHS was highest (68%) in Jammu & Kashmir and lowest in Chandigarh (15%). Among those who visited different public places within 30 days prior to the survey, 29 percent were exposed to SHS in any of the public places; 18 percent on public transport, 11 percent in restaurants, 7 percent in Government buildings and 5 percent at the health care facility. Exposure to SHS at any public place ranged from the highest of 54 percent in Meghalaya to the lowest of 11 percent in Chandigarh. Half of the adults (51%) who had visited restaurants during the 30 days prior to the survey had seen a designated non-smoking area in the restaurant, and 16 percent observed smoking in such an area. There was a large variation across the states/UTs in the proportion of adults who saw a designated non-smoking area in the restaurant. It varied from 17 percent in Mizoram to 89 percent in Delhi. Similar variation in observing smoking in non-smoking area was also noted. It varied from 3 percent in Chandigarh to 41 percent in Sikkim.
Economics
About half of all cigarette (51%) and bidi(49%) smokers and users of smokeless tobacco products (55%) purchased tobacco products from stores1. Kiosks2 were next common points of purchase. Thirty-one percent cigarette smokers, 39 percent bidi smokers and 32 percent smokeless tobacco users purchased tobacco products from kiosks, which included roadside paan shops. More than half (59%) of cigarette smokers purchased just two brands of cigarettes and over three-fourth (76%) of cigarette smokers purchased one of five most preferred brands. However, only about one-fifth of bidi smokers purchased bidis of one of the five most preferred brands. On an average, a daily cigarette smoker incurred an expenditure of ` 399.20 per month on cigarettes and a daily bidi smoker ` 93.40 per month on bidis. Monthly expenditure on cigarettes in urban areas (` 469.00) is higher than in rural areas (` 347.50), but monthly expenditure on bidis in urban areas (` 92.50) is slightly lower than rural areas (` 98.00). Monthly expenditure on cigarettes ranged from the lowest of ` 181.70 in Jharkhand to the highest of ` 1264.90 in Arunachal Pradesh. Monthly expenditure on bidis was lowest in Bihar (` 42.70) and highest in Rajasthan (` 147.80).
Media
A little more than half (52%) of adults in India noticed anti-cigarette information on any media/location during the last 30 days prior to the survey. A relatively higher proportion of adults noticed anti-bidi
1
A place where products and supplies, such as food, clothing, daily use commodities are offered for sale, a shop.
2
GATS India Report 2009-2010
information (61%) and anti-smokeless tobacco information (66%). The anti-tobacco information noticed by adults varied widely across states for different products. The proportion of adults who noticed anti-cigarette information ranged from 91 percent in Chandigarh to 36 percent in Bihar. The proportion of adults who noticed anti-bidi information ranged from 92 percent in Chandigarh to 31 percent in Assam. Similarly, a proportion of adults who noticed anti-smokeless tobacco information was highest in Chandigarh (93%) and lowest in West Bengal (39%). Majority of cigarette smokers (71%), bidi smokers (62%) and users of smokeless tobacco (63%) noticed health warnings on packages of the respective products. Among those who noticed health warnings on packages, 38 percent of cigarette smokers, 29 percent of bidi smokers and 34 percent of smokeless tobacco users thought of quitting such products because of warning labels on the respective packages of tobacco products. Among all adults, 28 percent noticed some form of advertisement or promotion of cigarettes, 47 percent noticed some advertisement or promotions of bidis and 55 percent noticed some advertisement or promotion of smokeless tobacco products.
Knowledge, attitudes and perceptions
Half (49%) of adults in India are aware that smoking causes stroke and less than two-thirds (64%) believe that smoking causes heart attack whereas, a large proportion (85%) believes that smoking causes lung cancer. Across all states/UTs, highest proportion of adults in Mizoram reported that smoking causes stroke (79%), heart attack (92%) and lung cancer (98%) whereas the lowest proportion of adults in Arunachal Pradesh reported it (34%, 37% and 78% respectively).
Recommendations
In view of the high prevalence of tobacco use in the country, there should be a national effort to prevent any further increase in the prevalence of tobacco use, especially among the vulnerable groups such as females, youth and children. There should also be targeted programmes addressing different types of tobacco use and different user groups with special focus on cessation. There is a need to further strengthen the implementation of Cigarettes and Other Tobacco Products (Prohibition of Advertisement and Regulation of Trade and Commerce, Production, Supply and Distribution) Act, 2003, at national, state and sub-state levels. Establishment of a comprehensive implementation and regulatory structure at the national and state level is required. Tobacco control strategies need to be mainstreamed with other national health programmes, within the overall framework of the National Rural Health Mission (NRHM). The multifaceted nature of tobacco problem in India calls for greater involvement and investment of various stakeholder ministries/departments, e.g. Human Resource Development (Education), Finance, Agriculture, Labour, Commerce, Rural Development, Information & Broadcasting, Women & Child, etc., in addition to the Ministry of Health & Family Welfare, as also the Panchayati Raj Institutions, academic/public health institutions, civil society groups, media, etc.
Tobacco use is a major preventable cause of premature death and disease, currently leading to over five million deaths each year worldwide which is expected to rise to over eight million deaths yearly by 2030.1 The vast majority of these deaths are projected to occur in developing countries. Nearly 8–9 lakh people die every year in India due to diseases related to tobacco use.2 Majority of the cardiovascular diseases, cancers and chronic lung diseases are directly attributable to tobacco consumption. Almost 40 percent of tuberculosis deaths in the country are associated with smoking.3
Globally, cigarette smoking is the dominant form of tobacco use. In the Indian context, tobacco use implies a varied range of chewing and smoking forms of tobacco available at different price points, reflecting the varying socio-economic and demographic patterns of consumption.4 Tobacco is consumed in a variety of, both smoking and smokeless forms, e.g. bidi, gutkha, khaini, paan masala, hookah, cigarettes, cigars, chillum, chutta, gul, mawa, misri, etc. Tobacco is also a part of the socio-cultural milieu in various societies, especially in the Eastern, Northern, and North-Eastern parts of the country.2
India is the second largest consumer of tobacco products and third largest producer of tobacco in the world. In order to facilitate the implementation of the tobacco control laws, bring about greater awareness regarding harmful effects of tobacco and fulfill obligation(s) under the WHO Framework Convention on Tobacco Control (WHO FCTC)5, the Government of India launched the National Tobacco Control Programme (NTCP) in the country. The Adult Tobacco Survey (ATS) is an important component of the country’s comprehensive tobacco control programme and reflects an efficient and systematic surveillance mechanism to monitor the tobacco epidemic through collection of baseline data and study of key tobacco control indicators.6
The Global Adult Tobacco Survey (GATS) is one of the components of the Global Tobacco Surveillance System (GTSS).8 GATS is a standardized household survey that enables countries to collect data on key tobacco control indicators and assist countries in the formulation, tracking and implementation of effective tobacco control interventions and international comparisons as laid out in the MPOWER policy package of WHO.1,7 The World Health Organization aims to reduce the global burden of disease and death caused by tobacco, thereby protecting present and future generations from the devastating health, social, environmental and economic consequences of tobacco consumption and exposure to tobacco smoke. This is accomplished by providing global policy leadership through promoting the WHO Framework Convention on Tobacco Control (WHO FCTC2) and the MPOWER package.1,7 The Framework Convention mandates Member States to progressively enforce its provisions, and WHO supports countries in their efforts to implement tobacco control measures through MPOWER.
GATS has been implemented in 14 countries globally where more than half of the world’s smokers live: Bangladesh, Brazil, China, Egypt, India, Mexico, Philippines, Poland, the Russian Federation, Thailand, Turkey, Ukraine, Uruguay and Vietnam. The Centers for Disease Control and Prevention (CDC), CDC Foundation, Johns Hopkins Bloomberg School of Public Health (JHSPH), Research Triangle Institute International (RTI International), the World Health Organization and many countries throughout the world worked together to design and implement GATS.
GATS India Report 2009-2010
The Global Adult Tobacco Survey India (GATS India) was carried out in all six geographical regions for both urban and rural areas of 29 states of the country and the two Union Territories of Chandigarh and Puducherry covering about 99.9 percent of the total population of India9. GATS India is unique in terms of its large sample size of 72,000 households and key survey activities having been carried out in 19 languages. The standard GATS questionnaire was adapted to India based on the prevailing pattern of tobacco use in the country and experiences from previous surveillance of tobacco use in the country.
1.1 TOBACCO CONTROL POLICIES IN INDIA
The Government of India enacted ‘Cigarettes and Other Tobacco Products (Prohibition of Advertisement and Regulation of Trade and Commerce, Production, Supply and Distribution) Act, 2003 (COTPA)’ to prohibit the consumption of cigarettes and other tobacco products, which are injurious to health, with a view to achieve improvement of public health in general, and also to prohibit the advertisement of, and provide for regulation of trade, commerce, production, supply and distribution of cigarettes and other tobacco products in the country.10 Various provisions of this Act have been enforced since 1st May 2004. The key features of the COTPA are as follows:
(i) Ban on smoking in public places, including indoor workplaces. (ii) Ban on direct and indirect advertising of tobacco products.
(iii) Ban on sale of tobacco products to minors (less than 18 years of age).
(iv) Ban on sale of tobacco products within a radius of 100 yards of educational institutions. (v) Display of mandatory pictorial health warnings on all tobacco product packages. (vi) Testing of tobacco products for tar and nicotine.
The Smoke-free Rules were revised in October, 2008, redefining ‘public places’ so as to include all workplaces and authorizing personnel responsible for enforcement of law for maintaining smoke-free public places across the country.
1.1.1 Tobacco control initiatives
(1) The National Tobacco Control Programme is under implementation in 42 districts of 21 states since 2007-2008.6 The main components of the programme are as follows:
(a) National level
i. Public awareness/mass media campaigns for awareness building and behavioural change.
(b) State level
i. Dedicated State Tobacco Control Cells to build capacity for effective implementation and monitoring of tobacco control initiatives.
ii.Developing coordination and linkages for tobacco control with all stakeholder departments and programs.
(c) District level
i. Monitoring and implementation of provisions under COTPA.
ii. Training of health and social workers, law enforcers, NGOs, Self Help Groups, Civil society organizations, etc., in tobacco control.
iii.IEC (information, education and communication) activities at grass-root level. iv.Provision of tobacco cessation facilities.
v. School-based awareness and training activities.
(2) Tobacco control initiatives are being integrated with ongoing National Health Programmes, e.g. National Cancer Control Programme (NCCP), National Programme for Prevention and Control of Diabetes, Cardiovascular Diseases and Stroke (NPDCS), National Mental Health Programme (NMHP), Revised National TB Control Programme (RNTCP) and School Health Programme (SHP).
(3) Expansion and strengthening of existing tobacco cessation facilities in the country. The states are encouraged and provided technical support to set up cessation facilities in as many institutions as possible, e.g. general hospitals, TB hospitals, Regional Cancer Centres, medical and dental colleges and other institutions.6
(4) Advocacy for tobacco control at the state and sub-state level.
(5) Capacity-building for tobacco control initiatives, e.g. training of doctors and health functionaries/staff under NRHM.
1.2 TOBACCO USE IN INDIA
Of all the prevalent smoking forms of tobacco, bidi is the most popular product in India, especially in rural areas. It is estimated that one-third of all tobacco produced in India is used for bidi making.2,11 Cigarette smoking is the second-most popular form of tobacco smoking in India, and is observed mainly in urban areas. Hookah, chuttas, dhumti, chillum, cigars, cheroots and pipes are some other forms of smoking tobacco in use in different parts of the country. Paan (betel quid) with tobacco is the most common form of chewable tobacco. Dry tobacco areca-nut preparations, such as paan masala, gutkha and
GATS India Report 2009-2010
In general, males smoke as well as chew tobacco whereas females mainly use chewing forms of tobacco, except in a few areas where prevalence of smoking among females is higher.12 In coastal areas of Andhra Pradesh and Odisha, females smoke cheroot (called chutta) in a reverse manner (i.e. with glowing end inside the mouth). In some parts of Northern India, females often smoke hookah. In addition to chewing and smoking, a range of different tobacco products in different parts of the country are applied on the teeth and gums. These products include dry snuff or tapkeer in the Western part of India, mishri in Maharashtra, gul and gudakhu in the Eastern region and creamy snuff or tobacco toothpaste in Eastern and North-Eastern regions of the country.2
1.2.1 Economic impact of tobacco use
Tobacco use has economic implications for the society and nation as a whole. Individual household’s economic implications of tobacco include direct cost of tobacco products and indirect cost due to the expenditure arising from the adverse health effects of tobacco use. A health cost study in India revealed that the direct and indirect costs of the three major tobacco-related diseases, namely cancer, coronary artery disease (CAD) and chronic obstructive lung disease (COLD) (for the year 2002-03), exceeded the total combined revenue and capital expenditure by the Centre and the States on medical and public health, water supply and sanitation.3
According to an independent study conducted in 2004, taking into account tuberculosis, respiratory diseases, cardiovascular diseases and cancers, the total economic cost of tobacco use in India was about 16 percent more than the total tax revenue collected from tobacco.13-15 An analysis of the data from the 52nd Round of the NSS reveals a higher risk of impoverishment due to borrowing and distress sale of assets during hospitalization of member of households that reported tobacco use.16 Findings of the survey also recommend the inclusion of tobacco and alcohol control in anti-poverty measures and poverty- reduction strategies and development frameworks for the poor in developing countries.
1.2.2 Health impact of tobacco use
Smoking increases the incidence of clinical tuberculosis17 and is a cause of half of the male tuberculosis deaths in India.3 Nearly half of cancers among males and one-fourth of cancers among females are tobacco related.29 The cohort study from rural India estimated the relative risk of death due to tobacco use to be 40-80 percent higher for any type of tobacco use; 50–60 percent higher for smoking and 90 percent higher for reverse smoking; and 15–30 percenthigher for use of chewing tobacco in males and females respectively and 40 percent higher for chewing tobacco and smoking combined.2
users.18 Smoking is responsible for a large and growing number of premature deaths in India. In a nationally representative study it has been estimated that in 2010 smoking will cause about 930,000 adult deaths in India; and about 70 percent of them will be between the age 30–69 years.19
1.2.3 Prevalence of smoking and smokeless tobacco
In order to arrive at an accurate level of prevalence of tobacco use by age groups, gender and place of residence, a number of surveys have been conducted in the country. The Global Youth Tobacco Survey (GYTS) under Global Tobacco Surveillance System (GTSS) covering population in the age group 13–15 was conducted in 2003 and repeated in 2006 and 2009. Similarly, the National Family Health Survey conducted in 1998–1999 and 2005–2006 did collect some information on prevalence of tobacco use among males and females. The National Sample Survey Organization (NSSO) also conducted a household survey in 1995–1996 to estimate tobacco use among the adult population in India. The Sample Registration System (SRS) for the first time included questions on tobacco use in the baseline survey conducted in 2004.20 However, except GTSS, tobacco use per se was not the focus in all these surveys.
The following nationwide surveys throw light on tobacco use among the adult population:
1. The 52nd round of the National Sample Survey (NSS) on Morbidity and Private Health Expenditure, conducted between June 1995 to June 1996 by the National Sample Survey Organization (NSSO) of the Government of India, collected information on current regular smoking and chewing of tobacco for all individuals above the age of 10 years.21
2. The National Family Health Survey (NFHS-2) conducted in 1998–1999 by the International Institute for Population Sciences (IIPS), Mumbai, India, and ORC Macro also collected information on tobacco use through household survey. The survey covered 92,486 households from 26 states in India. In the household questionnaire of NFHS-2, the head of the household was asked if any member of the household chewed paan masala or tobacco or smoked tobacco. The data was tabulated for persons age 15 and above.22
3. The third round of the National Family Health Survey (NFHS-3) conducted by International Institute for Population Sciences and Macro International in 2005–2006 also collected data on tobacco use from 124,385 females age 15–49 and 74 369 males age 15–54 from all 29 states in India. The survey collected information on current tobacco use status including cigarettes, bidis and other forms of chewing tobacco.12
4. The National Household Survey of Drugs and Alcohol Abuse in India (NHSDAA) conducted in 2002 among males covered over 40,000 individuals age 12–60 in 25 states and collected data on tobacco use.23
5. The baseline survey of Sample Registration System collected data on tobacco use covering the population age 15 and above. The prevalence is available separately for smoking, chewing (with and without tobacco) and tobacco only, and hence estimates of prevalence of smokeless tobacco cannot be computed.20
GATS India Report 2009-2010
one in two males and one in ten females in India use tobacco in some form or the other. About one-third of adult males smoke and/or chew tobacco. Among females, chewing tobacco is more common than smoking and only a small proportion of females smoke tobacco. The use of tobacco among adult males in India, especially of chewing tobacco, shows an increasing trend as given in Table 1.1.
Table1.1: Prevalence of tobacco use in India
Survey NSS 52nd
Round
NFHS-2 NHSDAA NFHS-3 SRS
Male
Tobacco users 51.3 46.5 61.0 57.6 NA
Smokers 35.3 29.3 NA 33.4 26.1
Users of smokeless tobacco 24.0 28.1 NA 36.4 NA
Female
Tobacco users 10.3 13.8 NA 10.8 NA
Smokers 2.6 2.4 NA 1.4 2.3
Users of smokeless tobacco 8.6 12.0 NA 8.4 NA
The analysis of NFHS-3 data shows that the use of tobacco and smoking are fairly common in India, particularly among males. There are some population subgroups among which smoking in females is fairly common, such as in North-Eastern states.12 Prevalence of tobacco use is relatively higher in the rural than the urban population. Tobacco use increases with age in India, though it is sizeable even among youth, especially among young males. The data also shows the tobacco use decreases with increase in education levels as well as rise in the wealth status, though more than one-third of males with 12 or more years of schooling or males in the highest wealth quintile use tobacco.
Tobacco use is much higher among both males and females in scheduled tribes compared to other caste groups. There are great many regional and state level variations in tobacco use. The use of tobacco among both females and males in all the states of the North-Eastern part of India is much higher and exceeds the national average. Tobacco use among males in the North-Eastern states ranges from 62 percent in Sikkim to 83 percent in Mizoram. The reported high prevalence of tobacco in the North-Eastern part of India is consistent with the findings of the Global School Personnel Survey in the North-Eastern part of India, 200124 and the National Household Survey of Drugs and Alcohol Abuse, 2002.23 Even the tobacco use rates in the states of the East (Odisha, West Bengal, Jharkhand and Bihar) and Central regions (Uttar Pradesh, Madhya Pradesh and Chhattisgarh) of India are higher than the national average.12