THE EFFECTS OF BUILT-UP AND GREEN AREAS ON THE LAND SURFACE
TEMPERATURE OF THE KUALA LUMPUR CITY
N. A. Isaa, W. M. N. Wan Mohda, S. A. Salleha
aCentre of Studies for Surveying Science and Geomatics Faculty of Architecture, Planning and
Surveying Universiti Teknologi MARA 40450 Shah Alam, Malaysia.
KEY WORDS: Land Surface Temperature, Urban Parameters, Multiple Linear Regression, Remote Sensing and GIS
ABSTRACT:
A common consequence of rapid and uncontrollable urbanization is Urban Heat Island (UHI). It occurs due to the negligence on climate behaviour which degrades the quality of urban climate condition. Recently, addressing urban climate in urban planning through mapping has received worldwide attention. Therefore, the need to identify the significant factors is a must. This study aims to analyse the relationships between Land Surface Temperature (LST) and two urban parameters namely built-up and green areas. Geographical Information System (GIS) and remote sensing techniques were used to prepare the necessary data layers required for this study. The built-up and the green areas were extracted from Landsat 8 satellite images either using the Normalized Difference Built-Up Index (NDBI), Normalized Difference Vegetation Index (NDVI) or Modified Normalize Difference Water Index (MNDWI) algorithms, while the mono-window algorithm was used to retrieve the Land Surface Temperature (LST). Correlation analysis and Multi-Linear Regression (MLR) model were applied to quantitatively analyse the effects of the urban parameters. From the study, it was found that the two urban parameters have significant effects on the LST of Kuala Lumpur City. The built-up areas have greater influence on the LST as compared to the green areas. The built-up areas tend to increase the LST while green areas especially the densely vegetated areas help to reduce the LST within an urban areas. Future studies should focus on improving existing urban climatic model by including other urban parameters.
1 INTRODUCTION
As a developing country, Malaysia experiences rapid urbanization which brings a lot of benefits to the citizens. Unfortunately, it’s become uncontrollable and tends to alter the environment negatively (Elsayed, 2012). The most obvious impact of urbanization is the increase in ambient temperature that leads to the formation of heat islands which degrades the urban climate (Amanollahi, Tzanis, Ramli, & Abdullah, 2016; Shahruddin, Noorazuan, Takeuchi, & Noraziah, 2014). Due to this, considerations on urban climate in urban planning activities are recommended by many authors in various studies (e.g. Agato, 2013; Ariffin & Zahari, 2013; Hebbert, 2014; Raghavan, Mandla, & Franco, 2015; Rajagopalan, Lim, & Jamei, 2014).
The concept of urban climatic mapping is introduced by previous researchers as an approach to portray the urban climate information for urban planning purposes (Ibrahim, Samah, & Fauzi, 2014; Katzschner & Burghardt, 2015; Matsuo & Tanaka, 2014; Ren, Lau, Yiu, & Ng, 2013; Ren, Ng, & Katzschner, 2010; Srivanit, Hokao, & Iamtrakul, 2014; Wong, Jusuf, Katzscher, & Ng, 2015). This mapping concept is able to characterize the urban climatic condition in a simple way so that it can be easily interpreted by urban planners and policy makers.
Previous studies related to urban climatic mapping studies by Acero, Kupski, Arrizabalaga, & Katzschner, (2015) Burghard, Katzschner, Kupski, Chao, & Spit, (2010), Cavan, Lindley, & Smith (2015), Eum, Scherer, Fehrenbach, Koppel, & Woo (2013), He, Shen, Miao, Dou, & Zhang, (2015), Houet & Pigeon (2011), Mora (2010); Ren et al. (2012), Reuter (2011), Tanaka, Ogasawara, Koshi, & Yoshida (2009), Yoda (2009) concentrated in four season countries. However, only recently related studies have been carried out in tropical countries like Singapore, Thailand and Vietnam (Katzschner & Burghardt, 2015; Srivanit et al., 2014; Wong et al., 2015).
2STUDY AREA AND DATASETS
In this study, Kuala Lumpur city is chosen as the study area. This city is selected due to rapid urbanization in the last few decades. The area covered by this study is shown in Figure 1. Located in the west coast of Peninsular Malaysia, Kuala Lumpur is the capital city of the country and is known as the densest city of the country. The city is surrounded by four towns of Selangor state; Batu Caves, Seri Kembangan, Ampang Jaya and Petaling Jaya.
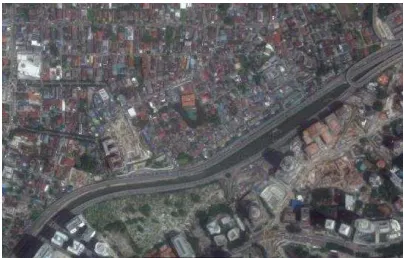
Figures 2 and 3 show two selected test sites within the study area, which are Bukit Damansara and Kampung Baru. These sites were chosen to estimate the value of LST using the model proposed by the authors. These sites were chosen due to their variability of urban settings. Kampung Baru is a compact area with urban developments. Bukit Damasara on the other hand is a mixed area of residential and vegetation.
Figure 1. The study area (Adapted: Google Map, 2017)
Figure 2. Test Site 1 : Bukit Damansara (Source: Google Map, 2017)
Figure 3. Test Site 2: Kampung Baru (Source: Google Map, 2017)
3 METHODOLOGY
The methodology of this research is organised into four (4) main stages: LST retrieval, extraction of built-up area, generation of NDVI layer and relationship assessments between LST and the selected urban parameters. A multi-spectral satellite Landsat 8 OLI/TIRS image was used in this study. The image used was captured in 29th of March 2016. This image was downloaded from the U.S Geological Survey website.
3.1 Land Surface Temperature (LST) Retrieval
In this study, the mono-window algorithm was used to retrieve the land surface temperature from the Landsat 8 OLI/TIRS data. At first, radiometric calibration was performed by converting the original pixel values into spectral radiance and brightness temperature. The vegetation proportion and land surface emissivity required in the mono- window algorithm were estimated using the NDVI derived from the same image. The LST layer was then retrieved using Equation 1.
where, Ts - LST in degree Celsius (˚C) BT - at-sensor brightness temperature
�- wavelength of emitted radiance
ɛ�- the estimated land surface emissivity and
ρ is a constant derived from Equation 2.
where, h - Planck’s constant (6.626 x 10⁻³⁴ J/s) c- the velocity of light (2.998 x 10⁸ m/s) σ - Boltzmann constant (1.38 x 10⁻²³)
3.2 Extraction of Built-Up Area
(2014) also suggested that the result of built-up areas extraction can be improved using principal component analysis (PCA) images in the NDBI layer generation, whereas common methods were used to generate the NDWI and NDVI layers. Equations 3, 4 and 5 shows the algorithm used to prepare the NDBI, NDWI and NDVI respectively.
Equation 6 shows the algorithm used to extract the built-up areas.
3.3 Generation of Normalized Difference Vegetation Layer (NDVI) Layer
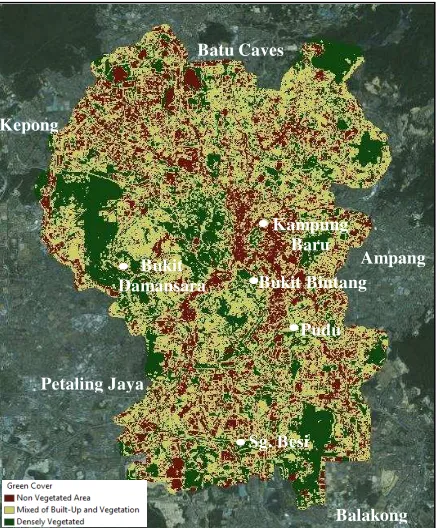
The fragmentation of the green or vegetated portions of the study area was portrayed using NDVI layer. This study used the same Equation 5 (as used in previous sub-section) to generate the NDVI layer. It is proposed that the classification of the green areas should be made based on the corresponding emissivity values of the particular areas (Buyadi et al., 2014). The classification used in this study to separate the vegetated areas from the others is shown in Table 1.
Class NDVI Range Note
1 < 0.2 Non-vegetated
2 0.2 < NDVI < 0.5 Mixed (Bared soil,
vegetation and hard surfaces)
3 > 0.5 Fully Vegetated
Table 1. NDVI Classification
3.4 Relationships between LST and Urban Parameters
The relationships between the LST and the two urban parameters were analysed through two statistical analyses. The correlations between them were tested using the Pearson correlation technique since the data prepared were normally distributed. Then, MLR analysis was carried out to characterize the effects between the LST and two urban parameters. These statistical tests and analyses were carried out using SPSS software.
4 RESULT AND ANALYSIS
The following sub-sections explained the results and analyses of the study.
4.1 Land Surface Temperature (LST), Built-up Area and Green Cover of Kuala Lumpur
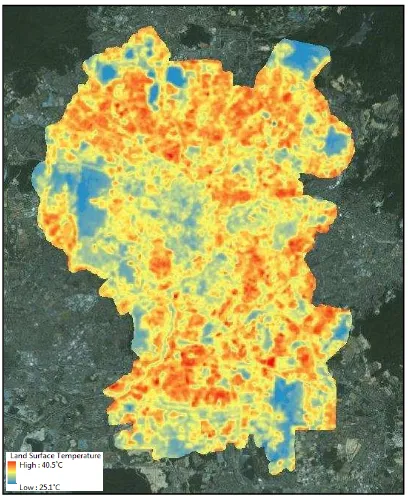
Figure 4 shows the distribution of LST of Kuala Lumpur city in the year of 2016. Based on Figure 3, the lowest and highest LST were 27.6˚C and 37.9˚C respectively. The mean LST for the entire study area was calculated as 33.7˚C. The lowest LST was found in highly vegetated areas in Bukit Tabur whereas the highest LST was found in the compact built-up area in Sri Petaling (near to Sg Besi). An initial hypothesis was made during this stage; the green cover contributes to the decrease in temperature, whereas the built-up area contributes to the increase in temperature.
Figure 4. LST distribution in Kuala Lumpur
Figure 5 shows the distribution of built-up areas in Kuala Lumpur. As shown in Figure 4, the built-up area dominates more than half of Kuala Lumpur regions. In this study, it was found that 67.8% of Kuala Lumpur was covered by built-up areas. The central regions of Kuala Lumpur are packed with man-made features which made the temperature to be higher than the surrounding regions. Table 2 shows the difference between the mean LST in built-up and non-built-up areas.
Classificati on
Mean LST
Built-up 34.7˚C
Non-built-up
31.5˚C
Table 2. The mean LST of built-up and non-built-up areas
Table 3. The mean LST within different land cover classification
Figure 5. Distribution of the Built-up Areas in Kuala Lumpur.
Figure 6. Distribution of green areas in Kuala Lumpur
4.2 The Correlation between LST and Built-Up Area and LST and Green Areas
Strong correlations between LST and both of urban parameters were found in the study area. A positive correlation was identified between LST and built-up areas with R2 = 0.791. This shows that the higher the built-up areas, the higher the LST. For green area, a negative correlation was identified between the two variables, i.e. R2 = -0.760. It can be concluded that, if the area is densely vegetated, the LST is found to be lower.
Figure 7 and Figure 8 shows the scatter plots of LST and the two urban parameters.
Figure 7. The relationship between LST and the density of built-up area
Figure 8. The relationship between LST and green area (NDVI)
4.3 The Effects of Built-Up Area and Green Cover on LST of Kuala Lumpur
Through the MLR analysis, it was found that built-up areas and green areas were significantly affected the LST of Kuala Lumpur city. The model produced through this analysis shown that these two urban parameters contributed almost 70% of the
Classification Mean LST
Non-vegetated areas 34.9˚C Mix of vegetation and built-up areas 34.1˚C Fully vegetated areas 31.3˚C
Batu Caves
Kepong
Kampung Baru Bukit
Damansara
Ampang Bukit Bintang
Pudu
Petaling Jaya
Sg. Besi
Balakong Batu Caves
Kepong
Bukit Damansara
Kampung Baru
Bukit Bintang Ampang
Pudu
Petaling Jaya
Sg. Besi
LST variations with the R2 = 0.695. Thus, the value of LST
LST - land surface temperature (LST) X1 - built-up area (in percentage) X2 - green area (NDVI value)
Based on the model produced, an increase of 26% of built-up area will elevate the value of LST by 1˚C whereas an increase of 15% in NDVI value will decrease 1˚C of LST within an area of 500m × 500m coverage. A large urban development which involves a land conversion of more than 26% will rapidly increase the LST of that particular area. An increase of 1˚C will change the thermal comfort as this value has a significant effect to human thermal comfort. Mature green cover needs to be planted and maintained within an area to balance the negative effect of built-up area. Even though the increment value seems to be lower in percentage, the increase of 15% (approximately 0.148 increments) in NDVI value is not easy.
4.4 Estimation of LST in the Selected Test Sites
The model produced in this study was used to estimate the value of LST within selected test sites in Kuala Lumpur. Different urban scenarios were set up for each of the selected test sites to estimate the value of LST. The results obtained are shown in Table 4.
The mean LST of Kampung Baru and Bukit Damansara were found to be 36.2˚C and 33˚C respectively. The mean LST of Kampung Baru was found to be higher than Bukit Damansara as the area is mostly covered by man-made features (built-up area). The mean LST of Bukit Damansara area was found to be almost 3˚C have lower compared to Kampung Baru as as the area is mainly covered by man-made features and a large portion of vegetated areas. This is consistent with the earlier research findings that states that the higher the density of the built-up areas, the higher the LST and the higher the NDVI value (greenness), the lower the LST.
Tables 4 and 5 show the simulated LST values for Kampung Baru based on the different built-up and green area percentage. Both parameters were manipulated by adding 25%, 50%, 75% and 100% increments of the built-up area and green area of the selected test sites. Based on both tables, the reduction of built-up areas is a great help to reduce the LST values.
However, it is a difficult endeavour to be conducted. Though, the increment of green areas within Kampung Baru is seen to be the most suitable measures to reduce the LST value.
Based on Table 4, the effect of the increment of built-up area in the effect of the increment of built-up area in Kampung Baru will result in severe effect (up to 3.1°C) of urban heating. It is advised that Kampung Baru should focus on mitigating the urban heating. Mature vegetation should be used in the
mitigation plan as it will decrease the LST up to 2.2˚C.
Table 4: Estimated LST value if both parameters are increased by 25%, 50%, 75% and 100% of the current built-up area and green
areas in Kampung Baru.
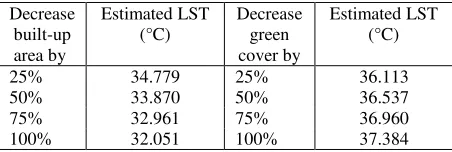
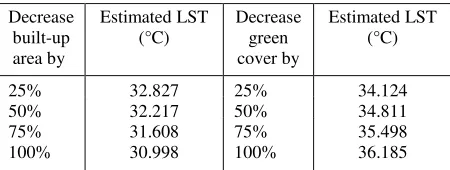
Table 5 shows that the increment of built-up areas can reduce the value of LST with 4.1°C. The reduction of green vegetation in Kampung Baru will increase the LST up to 1.2°C.
Decrease
Table 5. Estimated LST value if both parameters are decreased by 25%, 50%, 75% and 100% of the current built- up area and
green area in Kampung Baru.
Tables 6 and 7 show the estimated LST values in Bukit Damansara using manipulated values of built-up areas and green vegetation. The same increment values used for Kampung Baru were applied to Bukit Damansara. Based on both tables, Bukit Damansara has a lower effect of urban heating as compared to Kampung Baru. Nevertheless, serious urban heating can also occur in Bukit Damansara if rapid developments take place. From the estimation, the best measure to reduce the LST value in this site is to increase the green area. Therefore, Bukit Damansara should maintain its greenery areas to balance the urban heating within the residential areas. Based on Table 6, the effect of the increment of built-up area in Bukit Damansara will elevate the LST value up to 2.9°C. The increase in green vegetation will reduce the
Table 6. Estimated LST value if both parameters are increased by 25%, 50%, 75% and 100% of the current built-up area and
green cover values in Bukit Damansara.
Table 7: Estimated LST value if both parameters are decreased by 25%, 50%, 75% and 100% of the current built-up area and
green cover values in Bukit Damansara.
5 CONCLUSION AND RECOMMENDATION
This study has shown that the built-up area and green areas are the most important parameters which could balance the LST of a city such as Kuala Lumpur city. Strong correlations between the LST and both urban parameters were identified in this study. Positive correlation between the LST and built-up area indicates that this parameter contribute to urban heating, whereas, negative correlation between LST and green cover shows positive effects of urban cooling.
Through the MLR, about 70% of LST variations in Kuala Lumpur city can be explained by the built up area and green area. The estimation of LST using the proposed model on the two selected test sites has shown that Kampung Baru will be severely affected if there is no initiatives to mitigate the urban heating are taken. Bukit Damansara was found to a have lower effect of urban heating due to mature vegetation existed in the area. This study only investigates the effect of two urban parameters on the LST of Kuala Lumpur. Future studies should include more urban parameters in the model to explain the variations of LST for better accuracy of estimation.
ACKNOWLEDGEMENT
The authors would like to express their gratitude to the Universiti Teknologi MARA (UiTM) for funding this project under Research Acculturation Grant Scheme (RAGS) 600- RMI/RAGS 5/3 (66/2015).
REFERENCES
Acero, J. A., Kupski, S., Arrizabalaga, J., & Katzschner, L. (2015). Urban Climate Multi-Scale Modelling in Bilbao (Spain): a review. Procedia Engineering, 115, 3-11.
Agato, G. S. (2013). The Quest for Mainstreaming Climate Change Adaptation into Urban Development Planning of Ambo Town, Ethiopia. American Journal of Human Ecology, 2, 103-119.
Amanollahi, J., Tzanis, C., Ramli, M. F., & Abdullah, A. M. (2016). Urban Heat Evolution in a Tropical Area Utilizing Landsat Imagery. Atmospheric Research, 167, 175-182.
Ariffin, R. N. R., & Zahari, R. K. (2013). Perceptions of the Urban Walking Environments. Paper presented at the Asia Pacific International Conference on Environment-Behaviour
Studies, University of Westminster, London, United Kingdom.
Avdan, U., & Jovanovska, G. (2016). Algorithm for Automated Mapping of Land Surface Temperature Using Landsat 8 Satellite Data. Journal of Sensors, 1 - 8.
Bhatti, S. S., & Tripathi, N. K. (2014). Built-up Area Extraction Using Landsat 8 OLI Imagery. GIScience and Remote Sensing, 51(4), 445-467.
Burghard, R., Katzschner, L., Kupski, S., Chao, R., & Spit, T. (2010). Urban Climatic Map of Arnhem City.
Buyadi, S. N. A., Mohd, W. M. N. W., & Misni, A. (2014). Impact of Vegetation Growth on Urban Surface Temperature Distribution. Paper presented at the 8th International Symposium of the Digital Earth, Sarawak, Malaysia.
Cavan, G., Lindley, S., & Smith, C. (2015). Urban Climatic Map Studies in UK: Greater Manchester. In E. Ng & C. Ren (Eds.), The Urban Climatic Map for Sustainable Urban Planning. United States of America: Routledge.
Elsayed, I. (2012). Mitigating of the Urban Heat Island of the City of Kuala Lumpur, Malaysia. Middle-East Journal of Scientific Research, 11, 1602-1613.
Eum, H., Scherer, D., Fehrenbach, U., Koppel, J., & Woo, J.-H. (2013). Integrating Urban Climate Into Urban Master Plans Using Spatially Distributed Information - The Seoul Example. Land Use Policy, 34, 223-232.
He, X., Shen, S., Miao, S., Dou, J., & Zhang, Y. (2015). Quantitative Detection of Urban Climate Resources and the Establishment of an Urban Climate Map (UCMap) System in Beijing. Building and Environment, 92, 668-678.
Hebbert, M. (2014). Climatology for City Planning in Historical Perspective. Urban Climate, 10, 204-215.
Houet, T., & Pigeon, G. (2011). Mapping Urban Climate Zones and Quantifying Climate Behaviors - An Application on Toulouse Urban Area (France). Environmental Pollution, 159, 2180-2192.
Ibrahim, I., Samah, A. A., & Fauzi, R. (2014). The Review for the Use of Urban Climatic Map in the Land Use Plan for Urban Planning. Urban Planning and Local Governance, 3, 95-110.
Katzschner, L., & Burghardt, R. (2015). Urban Climatic Map Studies in Vietnam. In E. Ng & C. Ren (Eds.), The Urban Climatic Map for Sustainable Urban Planning. United States of America: Routledge.
Matsuo, K., & Tanaka, T. (2014). Urban Environmental Climate Maps for Urban Planning Considering Urban Heat Island Mitigation in Hiroshima. Journal of Heat Island Institute International, 9-2, 61-66.
Mora, C. (2010). A Synthetic Map of the Climatopes of the Serra da Estrela (Portugal) Journal of Maps, 591- 608.