EVALUATION OF MICROWAVE VEGETTION INDEX (MVI) IN MULTI-FREQUENCY
AND MULTI-ANGLE
S.Talebi a*,, J.Shi a, T. Zhao a, Y.Li b, X.Chuana L.Chai c
a State Key Laboratory of Remote Sensing Science, Institute of Remote Sensing and Digital Earth, Chinese Academy of Sciences.
Beijing 100101, China. - (soma, shijc, zhaotj, xiongchuan)@ radi.ac.cn b Beijing City University, Beijing, 100083, China; - [email protected]
c State Key Laboratory of Remote Sensing Science, School of Geography and Remote Sensing Science, Beijing Normal University,
Beijing 100875, China- [email protected]
KEY WORDS: Microwave Vegetation Index, Matrix Doubling Model, Optical Depth
ABSTRACT:
Microwave portion of the electromagnetic spectrum are effective for observations of vegetation not only to leaf but also woody parts of vegetation. Specifically, microwave emissivity varies strongly with surface roughness, polarization, look–angle and water content. Microwave Vegetation Index (MVI) is one of the microwave indexes that are based on zero-order model. The zero order models applicable when the scattering contribution with in the vegetation is negligible. In this paper MVI in different frequencies (Base on WCOM project) and different angles (Base on SMOS data) are calculated by Matrix Doubling model to take in to account multi-scattering effects within the vegetation. Then because MVI is depends on vegetation information we tried to analysis its behaviour in different densities of corn canopy by comparing to vegetation optical depth. The result shows linear relationship with height correlation between MVI and effective optical depth. So it can be a useful index in vegetation study for future satellite mission as WCOM.
* Corresponding author
1. INTRODUCTION
Vegetation plays significant role in affecting the water and carbon and nitrogen cycles, and also they are important in local and global energy balance. Furthermore the main difficulty in the estimation of soil moisture is vegetation layer that systematically considered as an attenuation factor in the soil moisture retrieval (Njoku et al. 2000; Van de Griend and Wigneron 2004). Key components in the study of all applications of vegetation are vegetation properties. Unique and unparalleled spectral specifications of vegetation (reflectance or emission regions) can be identified from satellite imagery (Shi et al. 2002). Remote sensing based index is the most popular used tool in vegetation monitoring. Optical sensors such as the Normalized Difference Vegetation Index (NDVI) are mainly dependent on the green leaf material of the vegetation cover and related to photosynthetic capacity (Huete 1988; Myneni et al. 1992; Myneni et al. 1995; Tucker 1979). A major limitation of the NDVI and similar indices is the optical sensors can only see a very thin layer of the canopy. They cannot give data on woody biomass, and total above-ground live carbon, which are of great interest to carbon cycle modelling. NDVI also display asymptotic (saturated) (Shi et al. 2008) signal over high biomass. Microwave portion of the electromagnetic spectrum (1cm to 1m) are effective for observations of vegetation parameters in a relatively thick layer of the canopy. In fact the composition and structure of the surface or volume under observation is affected on microwave signal. Specifically, microwave emissivity varies strongly with surface roughness, polarization and look–angle (England and Johnson 1977) and
particularly water content due to liquid water’s high permittivity
at microwave frequencies. Furthermore as we know detection
of microwave energy under almost all weather and environmental conditions is possible so that data can be collected at any time.
At this time and age, space borne radiometer data have been used to characterize the vegetation mostly based on vegetation indices. Some of vegetation indices include Microwave Polarization Difference Temperatures (MPDT) (Choudhury and Tucker 1987), Microwave Polarization Difference Index (MPDI) (Becker and Choudhury 1988) and normalized Polarization Index(Paloscia and Pampaloni 1992).
When we consider microwave vegetation index contingent on the sensor frequencies and the level of vegetation present, they can be influenced by soil emission varieties coming from soil moisture and surface roughness conditions. This issue can limit those products in global vegetation monitoring (Shi et al. 2008). Shi et al. (2008) made a new passive microwave vegetation index (MVIs). In the MVI technique the brightness temper-ature from 0-order model can be linearly linked to the soil emissivity by two ingredient model (vegetation transmission component as slope and vegetation emission component as intercept.) The vegetation fractional cover, biomass, water content, temperature and characteristics of the scatter size, orientation and shape of vegetation canopy are the vegetation parameters that both the slope and intercept are the functions of them (Zhao et al. 2011).
Then, through analysis of numerical simulations from AIEM, the bare soil emissivity at two adjacent frequencies can be described as a linear function. Because the bare surface emission signals of a surface for two frequencies are highly correlated and can be well described by a linear function with
coefficients that only depend on the frequency pair used and are polarization independent. Afterward MVIs can be developed based on the v and h polarized brightness temperatures at these two frequencies. This technique minimizes the surface emission signal and maximizes the vegetation signal.
In the MVI index the quantitative basis is derived from the zeroth-order radiative transfer solution. The zeroth-order solution is only applicable at low frequency or for sparse vegetation layer (Ferrazzoli et al. 2002; Kurum et al. 2012). When the contribution of scattering within the layer cannot be ignored, this approach will tend to under estimate the total emission. As a result, MVIs derived from the zeroth-order solution may not correlate well with vegetation parameters, especially at high frequencies or for dense vegetation (Chai et al. 2010).
Also the high frequency pair derived MVIs are different than the low frequency pair but often they have similar trends. Also the high frequency pair derived MVIs are more sensitive to seasonal vegetation change than these derived by the low frequency pair, because the high frequency microwave signals being more sensitive to the crown and leafy part of vegetation properties while the low frequency microwave measurements are more sensitive to the stems and woody part of vegetation properties. But we should notice that MVI technique is based on specification that both frequencies in the pair can penetrate the vegetation cover (Shi et al. 2008).
Also multi angle pair derived MVIs are different in different angles and have different physical properties and vegetation information and the amplitude each kind of land cover is different in incident angles (Zhang et al. 2012; Zhao et al. 2015).
As we said MVI value in different frequency is not uniform, and also in different angles, and have different physical properties and information, Also it is showed multiple scattering effects inside vegetation should be considered as frequency goes higher than C-band and when scattering is significant.
This study calculated MVI in different frequencies and different angles base on Matrix doubling model and try to analysis its behaviour in different densities of corn canopy by comparing to vegetation optical depth.
2. DATA AND METHODOLOGY
2.1 Experimental Data
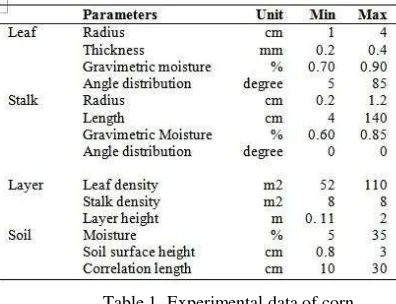
Detailed vegetation architecture and radiometer data for corn canopies to simulate brightness temperature from Matrix Doubling Model and validating the results were acquired in 2009 in Hebei province China on June and July. Table 1 is experimental data of corn.
The passive microwave sensor system used in this study to validate was called Multi-frequency Microwave Radiometer
(TMMR), which has four-frequency
(6.925/10.65/18.7/36.5GHz) antenna, dual-polarized (V/H) truck-mounted microwave radiometer designed.
2.2 Methodology
Radiative transfer Model (Tor Vergata model): When volume scattering within the vegetation is important the exact solution of radiative transfer solution can be done numerically using the matrix doubling method. The Tor Vergata model developed by(Ferrazzoli and Guerriero 1996) is used which take in to account multiple-scattering contributions in the vegetation layer and can better describe the scattering mechanism within the vegetation and thus can be used at higher frequency(more than C band) or for denser vegetation(scattering significant)(Ulaby et al. 1986).
Table 1. Experimental data of corn
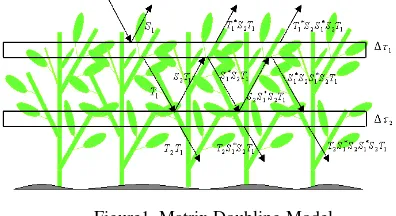
In this model simple geometries are presumed for scatterer: cylinder to describe stems and discs for describe leaves. The vegetation layer containing different scatterer type is divided in to N thin elementary sublayers that are assumed to be radiative transfer solution (Figure1) (Bracaglia et al. 1995). When combining sub-layer Δz1 and Δz2 into a new, thicker sub-layer Δz, and repeating this computation and combination N times, the total microwave scattering of the vegetated surface can be gotten.
Corn structure consists of leaves and main stem. Corn
leaves have considerable effect on corns’ scattering. As its strip
shape, matrix doubling model assemble it as several circular disks in equivalent area. In this version we assume disc orientation to be uniformly distributed in 0<alpha<360, 5<beta<85 intervals. Then the scatter matrix and the extinction vector of the disk is simulated by the General Rayleigh-Gans (GRG) approximation when the frequency is under 2GHz and by the Physical Optical Approximation (Myneni et al.)when the frequency is above 2GHz (Karam et al. 1988; LeVine et al. matrix doubling approach the forward scattering is included in the power transmitted toward the soil.(Ferrazzoli and Guerriero
1996), shows for a layer of cylinders large compare to the wavelength, object tend to behave like absorbers, so the absorption cross section formula allow to compute emissivity in a simple way and with acceptable accuracy. It means to compute emissivity correctly, forward scattering from the cylinders should be removed.
In matrix model the Infinite Length Cylinder (Njoku et al.) Approximation is adapted to computes the absorption cross section of vertical cylinders (main stems) over the soil.
As to the surface emission, the Advanced Integral Equation Model (AIEM) has been demonstrated applicability to a much wider range of surface dielectric, roughness, and sensor frequencies(Chen et al. 2003) and we adopted AIEM model to avoid effects from surface as possible.
Figure1, Matrix Doubling Model
Using the experiment measurements of the vegetation and soil, simulation from matrix doubling model under different incident angles carried out. Figure 2 compare the TMMR measured and the matrix doubling model simulated brightness temperature of corn at different incident angles at two frequencies. Soil parameters are including: RMS height is 0.8 cm; correlation length equal 10 cm and soil moisture is %10.
Figure 2, Comparison the TMMR measured and the matrix doubling model simulated brightness temperature
Calculating MVI in different frequencies and angles: MVI in different frequencies can be derived by using the ratio of the polarization differences in two frequencies (equation1) (Shi et al. 2008). Also MVI in different angels can be calculated by
Optical depth retrieval: In Radiative Transfer Model geophysical variables are connected to observed brightness temperature through ground reflectivity and two vegetation parameters: the optical depth and single scattering albedo(Mo et al. 1982). Based on MVI technique the zero order models can be expressed as a linear function of soil emissivity with a slope of and intercept of . Here, and are both as a function of single scattering albedo and optical depth. So one of our targets in this study is comparing MVI in different frequencies and different angels to optical depth to understand MVI zero order base, from matrix doubling model how change by optical depth.
As you know there are many empirical and theoretical approaches to calculate vegetation opacity. In the literature different method is used in different types of vegetation with different assumptions and simplifications regarding to the absorption and scattering, so comparing the result impossible. So here first, the theoretical meaning of optical depth is calculated to understand how it changes in different canopy height and then the effective optical depth, is calculated based on (Ferrazzoli et al. 2002). High correlation coefficient regression between theoretical and effective optical depth means physical meaning of effective one. vegetation extinction coefficient is defined by(ke( ) 4/ K0 Im
ffpp
used which take in to account multiple-scattering contributions in the vegetation layer .Using the transmissivity of vegetation layer is simulated by Tor Vergata model optical depth can be drive as (Ferrazzoli et al. 2002):
*
ln M cos
i Ti
τ (3)
This function has an important characteristic that there is no soil effect on it, also is from matrix doubling model and in fact this is one of the best factor to analysis MVI index. Figure3 is the relationship between theoretical optical depth and effective one at L band and 5 degree incident angle. As its clear there are good relationship between them for a given soil parameters.
1 1
Figure3, The relationship between theoretical optical depth and effective one.
3. CONCLUSIONS
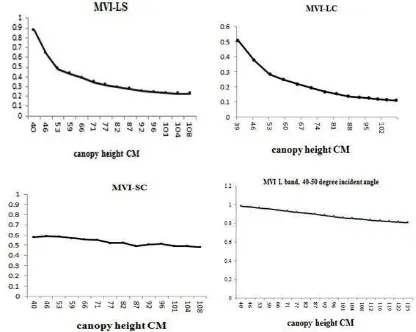
Based on MVI function, it calculated by using L, S, C and X bands in different canopy height of corn. In different frequencies MVI_LS, MVI_LC, MVI_SC and MVI_CX base on WCOM sensors (Shi et al. 2014) and also in different angles at L band base on SMOS sensors bands has calculated. Figure 4 is MVI in different canopy height at 5 degree incident angle. As it shows, MVI is reducing when vegetation become denser (Shi et al. 2008; Shi and Li 2013; Zhang et al. 2012).
Figure 4, MVI in different frequencies (MVI_LS, MVI_LC, MVI_SC and MVI_CX), and also in 40, 50 angles of L band
Figure5, Comparing MVI in different frequencies (MVI_LS, MVI_LC, MVI_SC and MVI_CX), and also in 40, 50 angles of
L band with effective optical depth
They show different trend because of different vegetation characters in different frequencies and angels.
Comparing MVI in different frequencies and angels with effective optical depth is presented in figure5. As it shows in different canopy height there is good relationship between optical depth and MVI, therefore we can conclude MVI depends on vegetation parameters only.
4. REFERENCES
Becker, F. & B. J. Choudhury, 1988. Relative sensitivity of normalized difference vegetation index (NDVI) and microwave polarization difference index (MPDI) for vegetation and desertification monitoring. Remote Sensing of Environment 24(2):297-311.
Bracaglia, M., P. Ferrazzoli & L. Guerriero, 1995. A fully polarimetric multiple scattering model for crops. Remote Sensing of Environment 54(3):170-179.
Chai, L., J. Shi, L. Zhang & T. Jackson, 2010. Refinement of microwave vegetation indices. In: SPIE Optical Engineering+ Applications, 2010. International Society for Optics and Photonics, p 780904-780904-8.
Choudhury, B. & C. Tucker, 1987. Monitoring global vegetation using Nimbus-7 37 GHz Data Some empirical relations. International Journal of Remote Sensing 8(7):1085-1090.
England, A. & G. Johnson, 1977. Microwave brightness spectra of layered media. Geophysics 42(3):514-521.
Ferrazzoli, P. & L. Guerriero, 1996. Emissivity of vegetation: theory and computational aspects. Journal of Electromagnetic Waves and Applications 10(5):609-628.
Ferrazzoli, P., L. Guerriero & J.-P. Wigneron, 2002. Simulating L-band emission of forests in view of future satellite applications. IEEE Transactions on Geoscience and Remote Sensing 40(12):2700-2708.
Huete, A. R., 1988. A soil-adjusted vegetation index (SAVI). Remote sensing of environment 25(3):295-309.
Kurum, M., R. H. Lang, P. E. O'Neill, A. T. Joseph, T. J. Jackson & M. H. Cosh, 2011. A first-order radiative transfer model for microwave radiometry of forest canopies at L-band. IEEE Transactions on Geoscience and Remote Sensing 49(9):3167-3179.
Kurum, M., P. E. O'Neill, R. H. Lang, A. T. Joseph, M. H. Cosh & T. J. Jackson, 2012. Effective tree scattering and opacity at L-band. Remote Sensing of Environment 118:1-9.
Mo, T., B. Choudhury, T. Schmugge, J. Wang & T. Jackson, 1982. A model for microwave emission from vegetation‐covered fields. Journal of Geophysical Research: Oceans 87(C13):11229-11237.
Myneni, R., B. Ganapol & G. Asrar, 1992. Remote sensing of vegetation canopy photosynthetic and stomatal conductance efficiencies. Remote Sensing of Environment 42(3):217-238.
Myneni, R. B., F. G. Hall, P. J. Sellers & A. L. Marshak, 1995. The interpretation of spectral vegetation indexes. IEEE
Transactions on Geoscience and Remote Sensing 33(2):481-486.
Njoku, E. G., W. J. Wilson, S. H. Yueh & Y. Rahmat-Samii, 2000. A large-antenna microwave radiometer-scatterometer concept for ocean salinity and soil moisture sensing. IEEE Transactions on Geoscience and Remote Sensing 38(6):2645-2655.
Paloscia, S. & P. Pampaloni, 1992. Microwave vegetation indexes for detecting biomass and water conditions of agricultural crops. Remote sensing of environment 40(1):15-26.
Shi, J., K.-S. Chen, Q. Li, T. J. Jackson, P. E. O'Neill & L. Tsang, 2002. A parameterized surface reflectivity model and estimation of bare-surface soil moisture with L-band radiometer. IEEE Transactions on Geoscience and Remote Sensing 40(12):2674-2686.
Shi, J., T. Jackson, J. Tao, J. Du, R. Bindlish, L. Lu & K. Chen, 2008. Microwave vegetation indices for short vegetation covers from satellite passive microwave sensor AMSR-E. Remote sensing of environment 112(12):4285-4300.
Shi, J. & Y. Li, 2013. Development of microwave vegetation index from multi-sensor observations. In: Geoscience and Remote Sensing Symposium (IGARSS), 2013 IEEE International, 2013. IEEE, p 3825-3828.
Tsang, L., J. A. Kong & R. T. Shin, 1985. Theory of microwave remote sensing.
Tucker, C. J., 1979. Red and photographic infrared linear combinations for monitoring vegetation. Remote sensing of Environment 8(2):127-150.
Ulaby, F., R. Moore & A. Fung, 1986. Microwave Remote Sensing: Active, Passive vol III: From Theory to Applications (Dedham, MA: Artech House).
Van de Griend, A. A. & J.-P. Wigneron, 2004. On the measurement of microwave vegetation properties: Some guidelines for a protocol. IEEE Transactions on Geoscience and Remote Sensing 42(10):2277-2289.
Zhang, N., J. Shi, G. Sun, Y. H. Kerr, Z. Guo & H. Lawrence, 2012. A simple algorithm for retrieval of the optical thickness at L-band from SMOS data. In: Geoscience and Remote Sensing Symposium (IGARSS), 2012 IEEE International, 2012. Ieee, p 198-201.
Zhao, T., J. Shi, R. Bindlish, T. J. Jackson, Y. H. Kerr, M. H. Cosh, Q. Cui, Y. Li, C. Xiong & T. Che, 2015. Refinement of SMOS multiangular brightness temperature toward soil moisture retrieval and its analysis over reference targets. IEEE Journal of Selected Topics in Applied Earth Observations and Remote Sensing 8(2):589-603.
Zhao, T., L. Zhang, J. Shi & L. Jiang, 2011. A physically based statistical methodology for surface soil moisture retrieval in the Tibet Plateau using microwave vegetation indices. Journal of Geophysical Research: Atmospheres 116(D8).