http://ibe.sagepub.com/
Indoor and Built Environment
http://ibe.sagepub.com/content/22/5/808
The online version of this article can be found at:
DOI: 10.1177/1420326X12461368
2013 22: 808 originally published online 5 October 2012
Indoor and Built Environment
Thai Phuong Vu, Seung-Bok Lee and Gwi-Nam Bae
of Ozone
Effect of Temperature on Aerosol Formation Potential for a Terpene-Rich Air Freshener in the Presence
Published by:
http://www.sagepublications.com
On behalf of:
International Society of the Built Environment
can be found at:
Indoor and Built Environment
Additional services and information for
http://ibe.sagepub.com/cgi/alerts
Email Alerts:
http://ibe.sagepub.com/subscriptions
Subscriptions:
http://www.sagepub.com/journalsReprints.nav
Reprints:
http://www.sagepub.com/journalsPermissions.nav
Permissions:
http://ibe.sagepub.com/content/22/5/808.refs.html
Citations:
What is This?
- Oct 5, 2012
OnlineFirst Version of Record
- Oct 1, 2013
Version of Record
Original Paper
Indoor and Built
uilt
Environment
Indoor Built Environ 2013;22;5:808–821 Accepted: August 10, 2012Effect of Temperature
on Aerosol Formation
Potential for a Terpene-Rich
Air Freshener in the
Presence of Ozone
Thai Phuong Vu
a,bSeung-Bok Lee
aGwi-Nam Bae
a,baCenter for Environment, Health and Welfare Research, Korea Institute of Science and Technology,
Seoul, Korea
bConstruction Environment Engineering, University of Science and Technology, Daejeon, Korea
Key Words
Aerosol formation potentialEConsumer productsE Volatile organic compoundsE OzoneETemperature
EIndoor chemistry
Abstract
The temperature dependence of secondary organic aerosol (SOAs) formation resulting from reactions of ozone with volatile organic compounds (VOCs) emitted from a terpene-rich air freshener was investigated in a temperature-controlled chamber. To assess the contri-bution of the air freshener to SOAs related to indoor air pollution, a new concept of aerosol formation potential (AFP) is proposed to replace the traditional SOA yield (Y). The AFP is defined as aerosol mass formed per unit ozone reacted. The AFP of the air freshener is simple to use for ozone-initiated SOA formation, because only the amount of reacted ozone is used, instead of the reacted amount of a large number of VOCs. The AFP of the air freshener was higher at lower temperature. The AFP at 108C was 1.3, 2.3, and 3.4 times higher than those at
20, 31, and 368C, respectively. The AFP is more dependent on temperature than on injected ozone concentration under the experimental conditions of this study. The AFP approach provides a simple tool that can be applied to examine SOAs formation potential from reactions of ozone with VOCs emitted from household consumer products.
Introduction
syndrome (SBS) and sick house syndrome (SHS) [4–8]. Investigators have reported chemical, physical, biological and mental factors, which could contribute to problems of SBS and SHS, or have been used to assess building and house climates. During the period of the 1970s and 1980s, most research focused on stable indoor factors and direct emissions from sources. From 1991, research trends on indoor air quality have changed [9] to focusing mainly on kinetics and reaction mechanisms, modelling, reactions of oxidants (O3, NO3, and OH radicals) with volatile organic
compounds (VOCs), gaseous oxidation products, second-ary organic aerosols (SOAs), effects of ventilation on air quality, and effects of reactants and their products on human health. This research has been classified in a new field named indoor chemistry. In 20 years of research on atmospheric chemistry in indoor environments, many investigators are aware of secondary indoor air pollution, caused by formation of SOAs, which could have a more adverse effect than primary indoor air pollution, par-ticularly on human eye [10,11]. Some researchers have reported unclear effects on airways by short-term exposure of VOCs and their oxidation products based on mouse bioassay [12–14]. However, effects by long-term bioassays and exposure at high concentrations of VOCs and their oxidation product have not yet been studied. Thus, a research into indoor SOA formation by chemical reactions would be necessary and has an important priority.
An aerosol is a suspension of solid or liquid particles in a gas. Primary aerosols are emitted directly from a certain source, and secondary aerosols are formed from chemical reactions or gas-to-particle conversion processes. Indoor chemicals can react with one or more other chemicals in indoor environments to form main products, short-lived reactive species, and free radicals [15]. Various researches have been conducted to quantify and identify common indoor VOCs, which include alkanes, alkenes, benzene, terpenes, ketones, aldehydes and esters [16]. The emission sources of these VOCs are mostly from building materials, and a variety of personal and home-care products [17].
Most indoor hydrocarbons are stable substances in ozone environment [18]. Terpenes such as a-pinene and d-limonene, however, are important substances in produ-cing SOAs [19]. They may react with ozone in the presence of low ozone concentrations to form SOAs [20,21]. In addition to ozone reactions in indoor environments, SOAs can be formed through photochemical reactions of various VOCs in the presence of NOxin the atmosphere [22]. The
artificial UV light of indoor chambers or sunlight of outdoor chambers can initiate chain reactions of photo-chemical oxidation, without initial ozone concentration.
Ozone, one of the major products of photochemical reactions, plays an important role as an oxidant, such as for OH radicals that could attack parent VOCs and intermediate species such as first generation products [23]. To assess the SOA forming potential of the individual VOC, the dimensionless parameter of aerosol yield (Y) has been widely used, regardless of the species of oxidant. The aerosol yield is known to increase as organic aerosol mass concentration increases, because of adsorption of con-densable vapours into organic material. Y can be calculated by equation (1) [24].
Y¼ Mo
ROG ð1Þ
where Mo is the organic aerosol mass concentration
(mg m3) andROG is the fraction of a present reactive organic gas (mg m3). However, even though equation (1) can be expanded to determine a mixture of VOCs, it is not easy to evaluate the SOAs-forming potential of household consumer products for the purpose of source management, because these products could emit a bulk of VOCs containing various VOCs [25–30]. An important problem is that not all aerosol yields of VOCs contained in the consumer product are available, because previous studies of aerosol yield have been mainly focusing on very common VOCs. Thus, it is very difficult to evaluate the aerosol yield of a particular household consumer product with known aerosol yields of limited numbers of VOCs. Moreover, reaction of ozone with a mixture of VOCs can be very complex, because competition among the VOCs reacting with the ozone can affect the estimation of yields. The high cost of quantitative chemical analysis for a number of VOCs before, and after, ozone reactions should be considered. In such cases, a new concept should be used to investigate SOA-forming potential of a certain consumer product due to ozone reactions.
However, the comfortable temperature can vary for different climates, e.g. 21–278C for the United States, and 14–218C for Britain [39]. Thus, temperature is an important factor that needs to be assessed in the formation of SOA. Some previous studies reported a certain effect of temperature on SOA formation, but did not show quantitative correlation between SOA formation and temperature [32,34,37].
In this work, the effect of temperature on aerosol formation potential during the reaction of ozone and VOCs emitted from a terpene-rich air freshener was investigated in a 1 m3reaction chamber. Four temperature levels were set to observe this effect. The VOCs contained in the air freshener were identified. The particle size number distribution and ozone were continuously mon-itored during the experimental periods. These data were used to calculate aerosol formation potentials and assess their contributions to indoor air pollution under different temperatures.
Materials and Methods
A test specimen of a commercial liquid-type air freshener popularly sold in the market in Korea was chosen for this study. The specimen has an orange fragrance and contains surfactants, which are labelled. VOCs of the test specimen were analyzed using a head-space test. The headhead-space test with a solid-phase micro-extraction (SPME) method was performed for identification of VOCs emitted from the test product.
The SPME is a very simple, efficient, and solventless sample preparation method, with a versatile and sensitive detection [40]. A 20mL specimen of the test product was added in a 20 mL glass vial in which VOCs were adsorbed on a SPME fibre (75mm thickness, Supelco, CAR/PDMS) for 1 h at 258C, in order to allow for VOC evaporation in room temperature, commonly found in indoor environ-ment condition in Korea. The SPME sample was analyzed by gas chromatography/mass spectrometry (GC/MS, Agilent, 6890 N). A 30 -m fused silica capillary column (internal diameter 0.25 mm; film thickness 0.25mm, Agilent, HP-5MS) was used to separate the target analytes. The initial GC oven temperature was set at 408C for 2 min, and then programmed to rise from 40 to 1008C at 108Cmin1and then from 100 to 2508C at 58Cmin1.
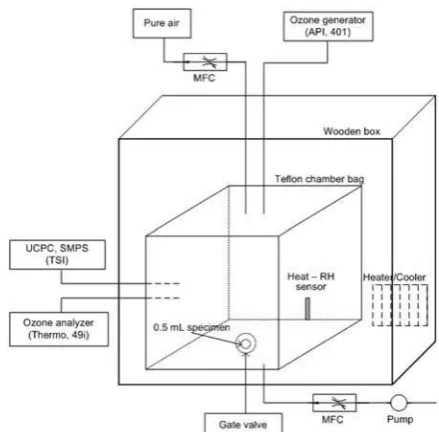
As shown in Figure 1, the experimental system consisted of a reaction chamber, ozone and pure air generators and monitoring instruments for ozone, VOCs and particles.
The volume of the cube-shaped reaction chamber was 1 m3(111 m), which was made of fluorinated ethylene propylene (FEP) Teflon film (about 51mm), and the surface to volume ratio was 6 m1. The chamber was installed in a wooden box equipped with a door in order to avoid any light disturbances from the outside. A pure air generation system (Aadco Instruments 737-15) was used to supply zero air into the reaction chamber [41]. The confirmed concentrations of the impurities of O3, NO,
NO2, NOxand SO2in zero air were51 ppb, and the CO
concentration was 50.05 ppm. Terpenes and their oxyge-nated species that are well known to form SOAs were not detected in the pure air itself by the gas chromatography/ mass spectrometry analysis.
Prior to each experiment, the chamber was flushed twice with pure air and ozone (200 ppb) for 3 h in order to minimize the effects of bag contamination. Thereafter, a background particle formation was checked occasionally by injecting the ozone of 50–200 ppb to the chamber into which no air freshener was introduced into the chamber air, resulting in the measured particle number and mass concentrations of 51800 particles cm3 and
50.06mg m3, respectively, after 4 h [31]. In this study, every particle mass concentration was derived from the size-resolved particle number concentration data with an assumption of unit particle density. The initial particle number concentrations measured before the air freshener specimen was put into the chamber were 515 particles cm3for all experiments.
During the experiments, the ozone concentration was monitored every one minute using a U.V. photometric O3
analyzer (TEI 49i) with a lower detection limit of 1.0 ppb. The analyzer was calibrated with 700 ppb span gas generated by photometric O3 calibrator (API 401). The
particle size number distribution was determined using a scanning mobility particle sizer (SMPS, TSI 3936), which consisted of an electrostatic classifier (TSI 3080 L) equipped with a long differential mobility analyzer (DMA, TSI 3081) and a condensation particle counter (CPC, TSI 3010), with a scanning time of 4 min and a waiting time of 1 min. The flow rates of aerosol air and sheath air in the DMA were set to 0.018 and 0.18 m3h1, respectively, in order to detect particles ranging from 13.8 to 723.0 nm in diameter. The total particle number concentration was also monitored using an ultrafine condensation particle counter (UCPC, TSI 3025) with a 1 s response time, in order to detect particles larger than 3 nm in diameter. The air temperature and relative humidity in the Teflon chamber were monitored every 5 min using a small sensor with a data logger (Sato Keiryoki SK-L200Th), and the lower detection limit for relative humidity was 20%. This data logger was placed in the bottom of the chamber.
One Teflon sampling line was connected to the O3
analyzer. A stainless steel sampling line was connected to both the SMPS and the UCPC. The total sampling flow rate for monitoring concentrations of particles and ozone in the chamber was controlled so as to be similar to the flow rate of ozone injected into the chamber. The control of inflow and outflow produced an approximate air exchange rate of 0.24 h1 using mass flow controllers (MFC, GMC 1000).
A 0.5 mL (0.49 g) test specimen of the liquid-type air freshener was added to a 50 mL open glass petri dish with a diameter of 65 mm which was then placed in the bottom of the chamber. This specimen dried out after about 2.5 h in the chamber at 208C, implying that all of the VOCs from the air freshener had been emitted by this time. A relative humidity was maintained below 20%. Four minutes after the test specimen was set, ozone of 100 ppb began to be injected into the centre of the chamber through the top surface, using the photometric O3
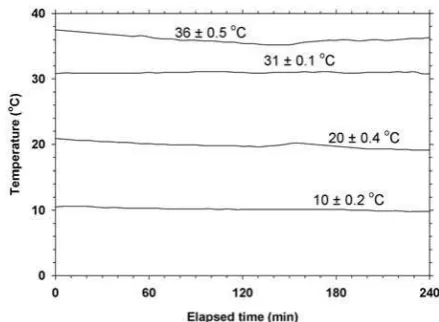
calibrator at a flow rate of 0.24 m3h1. Each experiment lasted for about 4 h. Experiments of the temperature effect on formation of SOA were conducted at four temperature levels of 10, 20, 31, and 368C, respectively, using a heater/ cooler, as shown in Figure 2. The cooler or the heater was operated 2 h prior to injecting ozone into the chamber and
was maintained at the temperature until the end of the experiment.
Results and Discussion
VOC Emission from the Air Freshener
An important characteristic of an air freshener is fragrance. The headspace test showed that a test specimen of an air freshener contained many volatile organic compounds, such as a-pinene, b-pinene, myrcene, limo-nene, terpilimo-nene, linalool, terpineol, benzyl, geraniol, as presented in Figure 3.
It was clear that the test specimen was a terpene-rich air freshener which is popularly used in indoor environments of many homes and commercial offices. Some of these VOCs, such as limonene, pinene, linalool, terpineol, myrcene, are widely known to react with ozone to form indoor secondary pollutants [21,37,42–48]. Several studies reported Y values of VOCs, mostly terpenes such as a-pinene, b-pinene, d-limonene, sabinene, linalool, etc. when they react with ozone, as shown in Table 1 [37,42–44,49].
There is some discrepancy in Y values among those studies reported, because of variation of experimental parameters, such as reactant concentrations and tempera-ture. The relatively higher Y values of a-pinene and d-3-carene means that these species can readily form SOAs when their unit mass is reacted with ozone. In addition, some studies reported that indoor secondary aerosols, formed due to reaction of ozone with a complex VOC mixture emitted from an air freshener, could significantly contribute to indoor air pollution, particularly as regards to particulate matter pollution [19,20,27,31,32,50,51].
The terpenes contained in the test specimen could react with O3, forming first generation products, second
acids, ketones and other radicals [52]. The kinetic and photochemical data for such reactions have been reported in a previous study [53]. Among a number of gaseous reaction products, some condensable vapours that have a relatively lower saturation vapour pressure could be converted to nanoparticles (510 nm), through homoge-neous nucleation when their concentrations exceed the saturation vapour pressures. These nanoparticles (510 nm) could collide and combine together to become larger particles, as ultrafine (5100 nm) and submicron particles [54].
Ozone Reaction and Particle Formation
The background conditions of the reaction chamber were determined without a test specimen before conduct-ing the main experiments. All conditions of the back-ground tests were the same as those of the experiments
during the experiment duration, except of course for the absence of the air freshener specimen inside the chamber. The variation in the ozone concentration can be theoretically predicted inside the chamber without reaction loss and under a constant air exchange rate by using a balance equation. The measured ozone concentration of a background test at a given elapsed time was comparable to the theoretical value, which was used to calculate the amount of ozone reacted in the main experiments. The background test results were reported in a previous study [31]. Briefly, the reference ozone concentration equalled to about 88% of the theoretical ozone concentration. The maximum particle mass concentration was 0.06mg m3 after 4 h injecting ozone of 200 ppb concentration. This background reactivity without reactants did not signifi-cantly affect the results of the main experiments.
There was no particle formation when pure air with a flow rate of 0.24 m3h1(0 ppb ozone concentration) was Fig. 3.Chromatogram of the volatile organic compounds emitted from the air freshener tested in this work.
Table 1. Yield of terpenes reacting with ozone
Compound Y (%)
[37] at 16–198C [49] at 258C [42,43] at 228C [44] at 228C
a-Pinene 67.1 77.1 34.0
a-Terpineol 34.2
b-Pinene 32.1 5.5 33.0
d-3-Carene 75.9 27.2
b-Ocimene 17.4
Linalool 7.8 13.0
Sabinene 6.0
injected into the chamber reacting with available VOCs emitted from the air freshener at 208C. This result is a little different from the results given from a previous study [50], where the particle number concentration increased from a background level of 1200 to 2500 particles cm3. This was probably due to incomplete vaporization of a liquid VOC mixture when the VOCs were injected using a syringe pump. It is clear that there was no significant effect of the background reactivity due to residual contamination of the reaction chamber and experimental facilities used in this study.
Reaction of ozone with VOCs emitted from the test specimen occurred when ozone was injected into the chamber. The measured ozone concentrations in the presence of VOCs were lower than the reference ozone concentration previously measured by the background test without a specimen, as shown in Figure 4. The reference ozone concentrations were similar to each other at temperatures of 20 and 308C. Thus, it is assumed that the reference ozone concentrations were not dependent on the four temperature levels. The measured ozone concen-trations in the presence of VOCs did not change much with changing temperature. The reference ozone concen-trations and the measured ozone concenconcen-trations were used to calculate the reacted ozone at different temperatures.
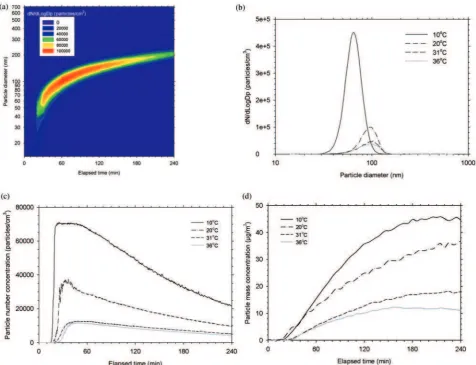
Particle formation clearly occurred when 100 ppb ozone concentration was injected into the reaction chamber, as shown in Figure 5(a). The nanoparticle formation started at about 12 min in the experiment at 208C. There was a delay in the formation of SOA as the temperature increased. The delay time of the nanoparticle formation was about 2 min for each 108C increase. At the time of nanoparticle formation, the experimental ozone concen-tration was 10.5 ppb, which was much lower than the ozone concentration of 22–25 ppb used to form nanopar-ticle formation from ozone/limonene reactions as reported in a previous study [21]. The size of new particles increased to 4100 nm during 20–70 min experimental period. The mean diameters of the particles after 4 h were about 200 nm under the four experimental temperatures. It was clear that temperature did affect the particle size number distribution, as shown in Figure 5(b). The particle mean diameter after 60 min at 108C was much smaller than those measured at the other temperatures. This means that at the start time under a low temperature, the formation process of new nanoparticles was more active than the growth process of existing nanoparticles.
The nanoparticle number concentration increased very rapidly, and quickly reached its maximum peak, as shown in Figure 5(c). The peak nanoparticle number
concentrations were: 70965, 37565, 12760, and 11810 particles cm3 at temperature levels of 10, 20, 31, and 368C, respectively. The peak particle number concentra-tion at 108C was about 1.9 times higher than that at 208C. The peak particle number concentration after 60 min of test at 208C was about 2.9 times higher than that at 318C. The peak particle number concentrations were similar at 31 and 368C. There were delays of nanoparticle formation and of reaching peak number concentrations. This result accords with previous researches [32,33]. The time taken to reach the peak number concentration was delayed by 7 min for each 108C increase. The nanoparticle number concentration increased very abruptly and rapidly; and reached the peak concentration at temperatures of 10 and 208C. There were no significant differences in the number concentrations at 31 and 368C. The particle number concentrations were higher under lower temperatures. This was likely due to lower saturation pressures of vapours that could be converted to particles by homo-geneous nucleation process, under lower temperatures. Under these experimental conditions, the saturation vapour pressures at 10–208C seem to be low enough for the vapours to be rapidly converted to a lot of new particles, known as a nucleation burst phenomenon.
mass concentrations between 10 and 208C, and between 31 and 368C, respectively were not observed within about 50 min in an early aerosol formation stage.
The difference in the measured particle mass concentra-tions increased afterward as aerosol formation continued, and the measured particle mass concentrations was levelling off over a longer reaction time. This phenomenon was similar to the results of a previous study for a single VOC [37]. The particle mass produced at 20–180 min was 85% of the total mass, which could be affected by the specimen drying out after about 150 min. A study reported that the particle mass produced in the initial stage was 60% of total mass [39].
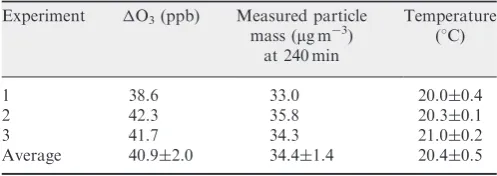
The reliability of the experimental results was checked by repeated experiments at 208C. The results of the repeated experiments were similar, as shown in Table 2. The standard deviation of the measured particle mass at
240 min was 1.4mg m3. Thus, the experimental results obtained could be used for calculation of the secondary aerosol formation potential.
Effect of Temperature on Particle Formation
As mentioned earlier, it is not easy to estimate the yields of all VOCs emitted from a certain consumer product, because the yield data are not available for all VOCs reacting with ozone. In this case, the new concept of aerosol formation potential (AFP) can be used as an index for particle formation from reactions of ozone with a bulk of VOCs. It is well known that a VOC reacting with O3
could produce products (P), as presented by a general reaction of equation (2).
aVOCþbO3!P ð2Þ
The amount of products can be estimated from the reactants concentrations, as shown in equation (3) [47]. Equation (3) can be applied to first-order reactions when both a and b are 1, that is, for those reactions between ozone and VOCs with a single double bond. The mixed VOC emissions from an air freshener or other household products may include compounds with more double bonds. In such case, equation (3) can also be applied to higher-order reactions, for example, between ozone and d-limonene with two carbon–carbon double bonds, one in cyclic carbon chain and one straight carbon chain. Fractions of products formed due to O3 attack at the
cyclic double bond and at the otherCH¼CHdouble bond are 85% and 15%, respectively [46]. In the case of linalool, fractions of main products formed due to O3
attack at the carbon-carbon double bonds of (CH3)2C¼CH and H2C¼CH are 97% and 3%,
Here, the rate of products is determined by the power function of the concentrations of VOC and O3. The SOA
yield from equation (1) can be calculated by the organic aerosol mass concentration produced for a given amount of VOCs reacted. In this study, the amount of ozone reacted were used to replace the amount of VOCs reacted from a mixture of VOCs that were emitted from the air freshener, as shown in Figure 3.
It is likely that a number of VOCs emitted from an air freshener are dominant in indoor environments. In this case, it is not easy to obtain enough data of SOA yields of all VOCs emitted from the terpene-rich air freshener to estimate the amount of SOAs formed. To assess the contribution of the air freshener for SOA formation, an aerosol formation potential (AFP) is used to replace the SOA yield, as shown in equation (1). This AFP was shown to be a function of secondary aerosol mass concentration produced for the reacted ozone, as shown in equation (4).
The simple relationship between the AFP and Y can be explained with equation (5).
AFP¼M0
whereM0is the formed organic aerosol mass
concentra-tion (mg/m3), O3 is the amount of ozone reacted
(mg m3), and ais a conversion factor implying stoichio-metric coefficients and molecular weight ratio. If one mole of VOC with a molecular weight of 144 and its products react with two moles of ozone,ais calculated to be 1.5 by dividing the VOC molecular weight by ozone molecular weight and then by multiplying the mole ratio of 0.5.
It is not easy to know the exact a in the real world. Theoretically, values of O3and M0are calculated by
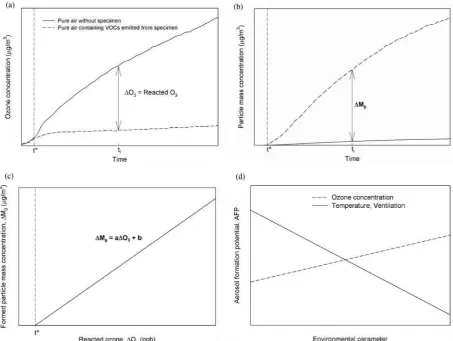
the differences of concentrations under conditions of purified air without a specimen and purified air containing VOCs emitted from a specimen. The difference between the measured ozone concentrations at the same time, ti,
under conditions of purified air without specimen and purified air containing VOCs emitted from the specimen are the reacted ozone, as shown in Figure 6(a). The background particle mass concentration is also measured, which corresponds to the condition of purified air without specimen at the same time above. The formed particle mass concentration (M0) is calculated from the
differ-ence between the measured particle mass concentration corrected by sink loss (e.g. deposition on walls) and ventilation, and the background particle mass concentra-tion, as presented in Figure 6(b). Based on correlation between the formed particle mass concentration and the reacted ozone, the AFP is defined as the slope of Figure 6(c). The contribution of SOAs from the air freshener can be evaluated based on the AFP. Figure 6(d) shows the aerosol formation potential calculated from equation (4) as a function of the environmental parameter in the presence of ozone. The effects of the environmental parameters such as temperature, ventilation, ozone con-centration on the aerosol formation potential can be estimated using the results of previous studies.
Generally, it is clear that the formed particle mass concentration would increase when ozone concentrations increased, as illustrated by equation (3) for the case with enough amounts of VOCs. This was proven by experi-mental results showing the mass concentrations of par-ticles formed due to the reactions of ozone with VOCs Table 2. Repeatability of experimental results
Experiment O3(ppb) Measured particle
emitted from an air freshener, which became greater with higher ozone concentrations injected [31,32].
A study reported that the formed particle mass concentration would decrease in the reaction of ozone with limonene, when the air exchange rate was increased [38]. The formed particle mass concentration could be increased under light [33–35]. The formed particle mass concentration could also be increased as temperature decreased [32,33,37]. From these results, the effect of some parameters on AFP can be roughly estimated. Generally, the AFP would increase as temperature and ventilation decrease. The AFP would increase as reactants concentra-tions increase. These estimation results as hypotheses of this study are shown in Figure 6(d).
Calculation is omitted at the beginning time (t0¼0) to a
certain time (t*);t* is the time at which the particles begin to be formed. The time from t0 to t* is a threshold for
condensable vapour products from reactions of VOCs with ozone to exceed a critical saturation ratio for nucleation of new particles. This threshold could cause a
delay in time in forming the particles. In the case of photochemical reactions of toluene, the threshold was reported to be proportional to the initial toluene concentration, implying that condensable vapours are second generation products [55]. The delay time of particles formation would be dependent on environmental parameters. For example, the delay time of particles formation was 15 min from the reactions of VOCs emitted from a car air freshener with 100 ppb ozone concentration at a flow rate of 0.12 m3h1injected into a 1 m3chamber [32].
The delay time of particles formation was 71 min or later in the photochemical reaction of toluene with NOx;
determined during the experiments of the effects of light intensity or temperature in a 5.8 m3chamber [35,36]. The delay time was 60 min in the photochemical reaction of a mixture of toluene with NOxunder ultra-violet irradiation
concentrations of ozone, at a flow rate of 0.24 m3/h1 injected into a 1 m3chamber at 208C [31]. The delay time showed much variation with experimental conditions, because of different kinds of condensable vapours, changes in dominant reaction pathways, and the increas-ing effect of their saturation vapour pressure with increasing temperature.
For calculation of AFP using equation (4), the particle mass concentrations produced from the air freshener is needed. To correct the measured particle mass concentra-tions, a general balance model for indoor environments can be used, as shown in equation (6).
Indoor pollutant ¼ ðsource emission
þ background pollutant þpollutant flow inÞ ðpollutant flow out þsink removalsÞ
ð6Þ
where, the concentration of indoor pollutant is the measured particle concentration at real time in the reaction chamber. The source emission is the secondary aerosols formed from reactions of ozone with VOCs emitted from the test specimen. The background pollutant is zero, because purified air was used. The airflow into the chamber contained no particle, because the airflow was spiked only with ozone without particles. Pollutants measured in the airflow outlet of the chamber means the particle loss due to ventilation, at 0.24 h1. The sink removal would be the particle loss on the chamber walls. The particle number loss by coagulation would not affect the particle mass concentration [54]. The balance model for investigation of the reaction chamber can be shown as in equation (7).
M0 ¼ measured particle mass concentration
þ lost particle mass concentration on walls
þlost particle mass concentration of ventilation
ð7Þ
whereM0is the formed particle mass concentration. In
this study, sink effect due to loss of the particle mass concentration on walls was calculated using equa-tion (8) [56].
Cm, wallð Þ ¼t M tð Þ½1expð8:4105tÞ ð8Þ
where,Cm, wall(t) is the particle mass concentration lost on
the chamber wall, andM(t) is the measured particle mass concentration that was calculated from the size-resolved particle number concentration with the assumed particle density (qp¼1 g cm
3
). The overall wall loss rate of 8.4105sec1 was used in this study. This was experi-mentally determined by a previous study [51]. The lost
particle mass concentration due to ventilation can be calculated using the air exchange rate (AER) versus the elapsed time at a real-time mass concentration, as shown in equation (9).
Cm, AER ¼C tð Þ1 AERðt2t1Þ ð9Þ
where Cm,AER is the lost particle mass concentration due
to air exchange during a time interval oft2t1,C(t1) is the
measured particle mass concentration at timet1, and AER
is the applied air exchange rate. AER was 0.24 h1in this study.
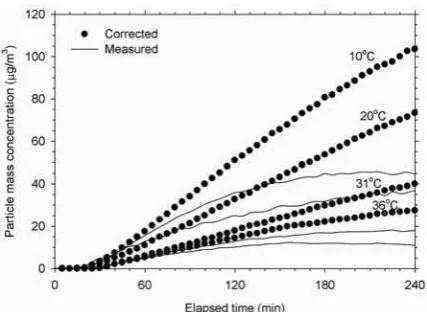
The formed particle mass concentrations corrected from the measured particle mass concentrations under other temperatures are shown in Figure 7. The formed particle mass concentrations were about 2.4 times higher than the measured particle mass concentrations. This additive increase was mostly contributed by the lost particle mass concentration due to ventilation. The lost particle mass concentrations due to wall loss were comparable to those lost by ventilation.
could play a very important role in producing particle mass concentration. The range of this temperature has been a very common issue with the available standard guidelines for indoor environments as mentioned earlier.
Similar to the calculation of the formed particle mass concentration under different temperatures, the formed particle mass concentrations were also calculated from the measured particle mass concentrations under different ozone concentrations, from experiments that were carried out in a previous work [31]. The purpose of this was to compare the effects of ozone concentration and tempera-ture on the aerosol formation potential. The positive linear relationship between the formed particle mass concentra-tions and the reacted ozone concentraconcentra-tions was also observed regardless of injected ozone concentrations as presented in Figure 8(b). The AFP at 100 ppb ozone
concentration was a little higher than that at 50 ppb ozone concentration. The AFP at 200 ppb ozone concentration was slightly lower than those at 50 and 100 ppb ozone concentrations. This is presumed to be due to the effect of competitive reactions of a number of VOCs with ozone. In the case of high ozone concentration, some VOCs that have relatively low reactivity would likely to react with ozone, but cannot contribute to particle formation. This might have led to a decrease of the AFP.
The effects of temperature and ozone concentration on SOA formation can be represented by AFPs. The AFPs were determined using equation (4), for the data when t
430 min, as mentioned earlier, because all particle mass concentrations were well measured under all experimental temperatures and ozone concentrations. The trends of the AFPs as a function of temperature and ozone concentra-tion were similar to the estimaconcentra-tion and previous results of yields using equation (1) [35,37,42]. Figure 9 shows correlations between the AFPs as functions of temperature and ozone concentration. It was obvious from equation (4) that ozone concentrations did not significantly affect the AFP. Temperature, however, could significantly affect AFPs. The AFP was higher at a lower temperature. The AFP at 108C was 2.3 times higher than that at 318C. The AFP at 1.3 times of the temperature jump from 10 to 208C was much lower than the 1.8 times of the temperature jump from 20 to 318C. This supported the thesis that the temperature jump from 20 to 318C was very important for particle formation.
After a temperature of 318C, particle formation decreased very fast. The AFP at 318C was 1.5 times higher than that at 368C. Therefore, the condensation process for gas-to-particle conversion was not active Fig. 8.Aerosol formation potential, (a) temperature effect at 100 ppb, (b) ozone concentration effect at 208C.
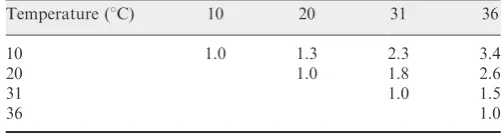
after 318C. The previous studies reported yields of SOA decreased as the temperature increased. The SOA yield of hydrocarbons at 108C was 1.5–2.4 times higher than those at 308C [34]. The SOA yield from reaction of ozone with a-pinene at 16.18C was 3.7–4.9 times higher than those at 48.18C [37]. In this study, the AFP of VOCs emitted from the air freshener at 108C was 3.4 times higher than that at 368C. The comparison of AFP under the different temperatures is listed in Table 3. The AFP at any temperature may be estimated using equation (10), which was obtained from the correlation between AFP and temperature, as shown in Figure 9.
AFP ¼ 0:078T þ3:5 ð10Þ
where AFP is the aerosol formation potential andTis the temperature (8C). The AFP can effectively be used to replace the SOA yield for investigation of aerosol formation potential from reactions of ozone with VOCs emitted from household consumer products. The effect of injected ozone concentration on the AFP was not much, which implies that the concept of AFP fit well with the potential of secondary aerosol formation, which was not affected much by initial concentrations of reactants, like SOA yield Y. The effect of initial concentration of the single VOC, one of the reactants, on the SOA yieldYwas reported to be relatively small [33]. In brief, for the experimental conditions of this study, aerosol formation potentials were less dependent on ozone concentration when compared with the temperature effect.
Conclusions
For the indoor environment, the secondary air pollu-tion by household consumer products, such as air fresheners, should be managed. An index system for evaluating the aerosol formation potential (AFP) and the effect of environmental parameters such as temperature on secondary air pollution has been proposed. This study evaluated the effect of temperature on the formation of secondary organic aerosols due to the reaction of ozone with VOCs emitted from a commercial air freshener to validate the new concept of AFP instead of the traditional aerosol yield.
The AFP of the air freshener at injected ozone concentration of 100 ppb was 1.4, 1.0, 0.6, and 0.4 at 10, 20, 31, and 368C, respectively. The AFP was higher at lower temperatures in the range of 10–368C due to more active condensation of organic vapours at lower temperatures.
The AFP of the air freshener shows a good negative linear correlation with temperature, while the effect of injected ozone concentration was relatively unimportant under the experimental conditions of this study, illustrat-ing that the new concept of AFP can be used as a management tool to assess the potential of secondary aerosol formation from reactions of ozone with VOCs emitted from household consumer products under various environmental conditions, such as relative humidity, ventilation and light intensity.
For future research, a work assessing the effects of such environmental conditions on aerosol formation potential is needed.
Acknowledgement
This project was supported by the Korea Ministry of Environment as ‘‘The Eco-technopia 21 project’’, and by the Korea Institute of Science and Technology.
References
1 Yu CWF, Kim JT: Building pathology, inves-tigation of sick buildings – VOC emissions: Indoor Built Environ 2010;19(1):30–39. 2 World Health Organization (WHO): Guidelines
for Air Quality. Geneva, The World Health Organization, 2000. http://www.airimpacts.org/ documents/local/AQGUIDE.pdf.
3 Klepeis NE, Tsang AM, Behar JM: Analysis of the National Human Activity Pattern Survey (NHAPS) respondents from a standpoint of exposure assessment. Final Report, National
Exposure Research Laboratory, Office of Research and Development, U.S. Environmental Protection Agency, Las Vegas, NV 89193–3478, 1995.
4 Yu C, Crump D: Indoor environmental quality – standards for protection of occupants’ safety, Health and Environment: Indoor Built Environ 2010;19(5):499–502.
5 Yu C, Crump D: Standards for evaluating indoor air: Indoor Built Environ 2011;20(4): 389–392.
6 Brown T, Holmes P, Harrison PTC: The applicability of epidemiological methods to the assessment of the risks to human health of indoor. air pollution: an overview: Indoor Built Environ 2010;19(3):311–326.
7 Bluyssen PM, de Richemont S, Crump D, Maupetit F, Witterseh T, Gajdos P: Actions to reduce the impact of construction products on indoor air: outcomes of the European project healthy air: Indoor Built Environ 2010;19(3):327–339.
Table 3. Comparison of aerosol formation potential
Temperature (8C) 10 20 31 36
10 1.0 1.3 2.3 3.4
20 1.0 1.8 2.6
31 1.0 1.5
8 European Collaborative Action (ECA-IAQ): Indoor air quality & its impact on man: effects of indoor air pollution on human health. European Commission Joint Research Centre – Environment Institute, Report No. 10; EUR 14086, 1991.
9 Weschler CJ: Commemorating 20 years of indoor air. chemistry in indoor environ-ments: 20 years of research: Indoor Air 2011;21:205–218.
10 Nøjgaard JK, Christensen KB, Wolkoff P: The effect on human eye blink frequency of exposure to limonene oxidation products and methacrolein: Toxicol Lett 2005;156:241–251. 11 Klenø J, Wolkoff P: Changes in eye blink
frequency as a measure of trigeminal stimula-tion by exposure to limonene oxidastimula-tion prod-ucts, isoprene oxidation products and nitrate radicals: Int Arch Occup Environ Health 2004;77:235–243.
12 Clausen PA, Wilkins CK, Wolkoff P, Nielsen GD: Chemical and biological evaluation of a reaction mixture of R-(þ)-limonene/ozone – formation of strong airway irritants: Environ Int 2001;26:511–522.
13 Fiedler N, Laumbach R, Kelly-Mcneil K, Lioy P, Fan ZH, Zhang JF, Ottenweller J, Ohman-Strickland P, Kipen H: Health effects of a mixture of indoor air volatile organics, their ozone oxidation products, and stress: Environ Health Perspect 2005;113:1542–1548. 14 Wolkoff P, Clausen PA, Larsen K, Hammer
M, Larsen ST, Nielsen GD: Acute airway effects of ozone-initiated d-limonene chemis-try: importance of gaseous products: Toxicol Lett 2008;181:171–176.
15 Weschler CJ, Wells JR, Poppendieck D, Hubbard H, Pearce TA: Workgroup report: indoor chemistry and health: Environ Health Perspect 2006;114(3):442–446.
16 Brown SK, Sim MR, Abramson MJ, Gray CN: Concentrations of volatile organic com-pounds in indoor air – a review: Indoor Air 1994;4:123–134.
17 Godish T: Indoor Environmental Quality. Boca Raton, Lewis Publishers, 2000. 18 Weschler CJ: Ozone in indoor environments:
concentration and chemistry: Indoor Air 2000;10:269–288.
19 Fan Z, Lioy P, Weschler C, Fiedler N, Kipen H, Zhang J: Ozone-initiated reactions with mixtures of volatile organic compounds under simulated indoor conditions: Environ Sci Technol 2003;37:1811–1821.
20 Liu X, Mason M, Krebs K, Sparks L: Full-scale chamber investigation and simulation of air freshener emissions in the presence of ozone: Environ Sci Technol 2004;38:2802– 2812.
21 Langer S, Moldanova´ J, Arrhenius K, Ljungstro¨m E, Ekberg L: Ultrafine particles produced by ozone/limonene reactions in indoor air under low/closed ventilation con-ditions: Atmos Environ 2008;42:4149–4159. 22 Dodge MC: Chemical oxidant mechanisms for
air quality modeling: critical review: Atmos Environ 2000;34:2103–2130.
23 Bowman FM, Odum JR, Seinfeld JH: Mathematical model for gas-particle
partitioning of secondary organic aerosols: Atmos Environ 1997;31:3921–3931.
24 Odum JR, Hoffmann T, Bowman F, Collins D, Flagan RC, Seinfield JH: Gas/particle partitioning and secondary organic aerosol yields: Environ Sci Technol 1996;20:2580– 2585.
25 Rastogi SC: Survey of chemical compounds in consumer products – contents of selected fragrance materials in cleaning products and other consumer products. Survey no. 8, National Environmental Research Institute, Danish Environmental Protection Agency, Copenhagen, Denmark, 2002.
26 Pors J, Fuhlendorff R: Survey of chemical substances in consumer products – mapping of chemical substances in air fresheners and other fragrance liberating products, Survey no. 30, Danish Environmental Protection Agency, Copenhagen, Denmark, 2003.
27 Nazaroff WW, Weschler CJ: Cleaning prod-ucts and air fresheners: exposure to primary and secondary air pollutants: Atmos Environ 2004, 38:2841–2865.
28 SCHER: Emission of chemicals by air fresh-eners – tests on 74 consumer products sold in Europe: Scientific Committee on Health and Environmental Risks, European Commission, 2006.
29 Jo WK, Lee JH, Lim HJ, Kwon KD, Jeong WS: Assessment of organic compounds emis-sion from consumer products in an environ-mental chamber system: Journal of Korean Society for Atmospheric Environment 2007;23(E2):39–46.
30 Jo WK, Lee JH, Kim MK: Head-space, small-chamber and in-vehicle tests for volatile organic compounds (VOCs) emitted from air fresheners for the Korean market: Chemosphere 2008;70:1827–1834.
31 Vu TP, Kim SH, Lee SB, Shim SG, Bae GN, Sohn JR: Nanoparticle formation from a commercial air freshener at real-exposure concentrations of ozone: Asian Journal of Atmos Environ 2011;5(1):21–28.
32 Lamorena RB, Lee W: Influence of ozone concentration and temperature on ultra-fine particle and gaseous volatile organic com-pound formations generated during the ozone-initiated reactions with emitted terpenes from a car air freshener: J Hazard Mater 2008;158:471–477.
33 Griffin RJ, Cocker III DR, Flagan RC, Seinfild JH: Organic aerosol formation from the oxidation of biogenic hydrocarbons: J Geophys Res 1999;104:3555–3567.
34 Takekawa H, Minoura H, Yamazaki S: Temperature dependence of secondary organic aerosol formation by photo-oxidation of hydrocarbons: Atmos Environ 2003;37:3413–3424.
35 Choi JE, Bae GN, Ju OJ, Lee SB, Moon KC, Yoon SC: Effect of light intensity on the photooxidation of toluene-nox-air mixture:
Particle and Aerosol Research 2006;2(1):35– 43.
36 Ju OJ, Bae GN, Choi JE, Lee SB, Ghim YS, Moon KC, Yoon SC: Comparison of tempera-ture and light intensity effects on the
photooxidation of toluene-nox-air mixture:
Journal of Korean Society for Atmospheric Environment 2007;23(3):353–363.
37 Hoffmann T, Odum JR, Bowman F, Collins D, Klockow D, Flagan RC, Seinfeld JH: Formation of organic aerosols from the oxidation of biogenic hydrocarbons: J Atmos Chem 1997;26:189–222.
38 Sarwar G, Corsi R: The effects of ozone/ limonene reactions on indoor secondary organic aerosols: Atmos Environ 2007;41:959–973.
39 Spengler JD, Samet JM, McCarthy JF: Indoor Air Quality Handbook. New York, McGraw-Hill, 2001, pp 15.3–15.14.
40 Vas G, Vekey K: Solid-phase microextraction: a powerful sample preparation tool prior to mass spectrometric analysis: Journal of Mass Spectrometry 2004;29(3):233–254.
41 Bae GN, Kim MC, Lee SB, Song KB, Jin HC, Moon KC: Design and performance evalua-tion of the KIST indoor smog chamber: Journal of Korean Society for Atmospheric Environment 2003;19(4):437–449.
42 Chen X, Hopke PK: A chamber study of secondary organic aerosol formation by lina-lool ozonolysis: Atmos Environ 2009;43:3935– 3940.
43 Chen X, Hopke PK: Secondary organic aero-sol from a-pinene ozonolysis in dynamic chamber system: Indoor Air 2009;19:335–345. 44 Grosjean D, Wllllams EL, Grosjean E, Andino JM, Seinfeld JH: Atmospheric oxida-tion of biogenic hydrocarbons: reacoxida-tion of ozone with a-pinene, d-limonene and
trans-caryophyllene: Environ Sci Technol 1993;27: 2754–2758.
45 Shu Y, Kwok ESC, Tuazon EC, Atkinson R, Arey J: Products of the gas-phase reactions of linalool with OH radicals, NO3radicals, and
O3: Environ Sci Technol 1997;31:896–904.
46 Leungsakul S, Jaoui M, Kamens RM: Kinetic mechanism for predicting secondary organic aerosol formation from the reaction of d-limonene with ozone: Environ Sci Technol 2005;39:9583–9594.
47 Hoffman RV: Organic Chemistry: An Intermediate Text, 2nd Ed., John Wiley & Sons, New Jersey, USA, 2004, pp 86–118. 48 Chen X, Hopke PK: A chamber study of
secondary organic aerosol formation by limonene ozonolysis: Indoor Air 2010;20:320– 328.
49 Cocker III DR: Chamber investigations of secondary organic aerosol formation: Thesis for the Degree of Doctor philosophy. California Institute of Technology, California, 2001.
50 Fan Z, Weschler CJ, Han IK, Zhang JJ: Co-formation of hydroperoxides and ultra-fine particles during the reactions of ozone with a complex VOC mixture under simulated indoor conditions: Atmos Environ 2005;39:5171–5182.
52 Carter WPL: A detailed mechanism for the gas-phase atmospheric reactions of organic compounds: Atmos Environ 1990;24 A(3):481–518.
53 Atkinson R, Baulch DL, Cox RA, Crowley JN, Hampson RF, Hynes RG, Jenkin ME, Rossi MJ, Troe J: Evaluated kinetic and photochemical data for atmospheric chemistry: volume ii – gas phase reactions of
organic species: Atmos Chem Phys 2006;6:3625–4055.
54 Hinds WC: Aerosol Technology: Properties, Behavior, and Measurement of Airborne Particles. 2nd Ed, New York, John Wiley & Sons, 1999; pp 260–275.
55 Hurley MD, Sokolov O, Wallington TJ, Takekawa H, Karasawa M, Klotz B, Barnes I, Becker KH: Organic aerosol formation
during the atmospheric degradation of toluene: Environ Sci Technol 2001;35:1358–1366. 56 Lee SB, Bae GN, Moon KC: Aerosol wall loss