Authors:
Ruth Waldick, Livia Bizikova, John Bolte, Dan MacDonald, Anna Zaytseva, Kathy Lindsay, Denis White, Pierre Yves Gasser, Scott Mitchell, Kellie Vache, Sampsa Hamalainen, Darren Swanson
Design:
Ann Wilkings
Guidebook to implementing
the quantitative and qualitative
aspects of the assessment
Integrated Landscape
Assessment, Decision-Support
Process & Tool Kit
MAINSTREAMING
CLIMATE CHANGE
Agriculture and Agri-Food Canada
Agriculture et
Agroalimentaire Canada
Environment Canada
1.Introduction ... 5
1.1 Mainstreaming Climate Change Adaptation ... 5
1.2 Purpose and Potential Users of the Guidebook ... 6
1.3 Structure and Use of the Guidebook ... 8
2. Approach ... 9
3. Application of the Framework ...10
3.1 Stakeholders’ Participation and Collaborations ...10
Creating a Project Team ...10
Identifying the Focus Question ...10
Stakeholder Mapping ...11
Choosing the Boundaries of the Study Area ...13
Preliminary Data Availability Assessment /Core Data Sets Availability...15
Defining the Time Frame ...16
3.2 Developing Scenarios ...17
Identifying Key Drivers of Change Affecting the Landscape ...18
Preparing a System Diagram ...21
Creating Alternative Future Scenarios ...24
Creating a Business-As-Usual (BAU) Scenario ...24
Example of the BAU developed for the EO Project ...25
Creating Alternative Qualitative Scenarios ...27
3.3 Development of Adaptation Options ...33
3.4 Mainstreaming Adaptation Into Policy, Planning, Programs and Practice ...37
3.5 Tracking Social, Economic and Environmental Outcomes ...41
4. Developing an Integrated Model to Simulate the Alternative Futures: Metrics and measures to evaluate relative performance, trade-offs and risks...47
4.1 Setting up the Integrated Model ...49
4.2 Preparation of IDUs and Data for Envision...51
Population ...52
Crop Allocation ...53
NAESI-Recommended Standards ...54
Preparation of Simulation Models for Envision ...55
NAHARP Wildlife ...55
NAHARP Nitrogen ...56
NAHARP Phosphorus ...57
Climate Indicators...57
4.3 Quantifying the Developed Scenarios ...58
5. Conclusions and Lessoned Learned ...65
Looking Forward ...68
6. Appendix ...69
6.1 Overview of the Stakeholders’ Participation Conducted in this Project...69
6.2 Sample Workshop Agendas ...70
6.3 Overview of the Developed Scenarios Narratives ...74
6.4 Overview of the Quantified Scenarios to be Modelled in Envision ...79
6.5 Envision Model Overview ...82
6.6 Overview of Integrated Model Development ...83
Table 1. Comparison of advantages and disadvantages when focusing on an eco-unit or political boundaries ... 14
Table 2. Examples of drivers in applications focused on climate change adaptation. ... 19
Table 3. Examples of feedback to the scenarios and adaptation needs ... 35
Table 4. Overview of types of adaptation needs at different stages of the scenario development ... 39
Table 5. Planned and autonomous adaptation ... 41
Table 6. Indicators to track adaptation and their outcomes ... 43
Table 7. Key definitions and examples of integrated modeling frameworks ... 47
Table 8. F2R EO: Geodatabase feature classes and key datasets ... 50
Table 9. Extreme event indicators calculated in Envision ... 57
Table 10. Overview of the impacts of the scenarios on primary outcomes indicators ... 62
Box 1. Examples of focus questions in initiatives climate change adaptation using scenarios ... 11
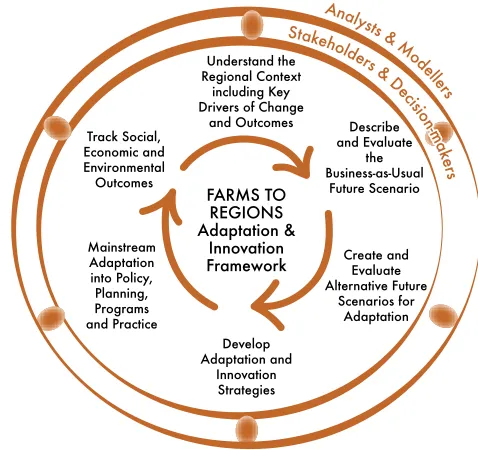
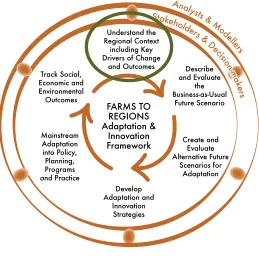
Figure 1. Farms to Regions – Adaptation & Innovation Framework ...9
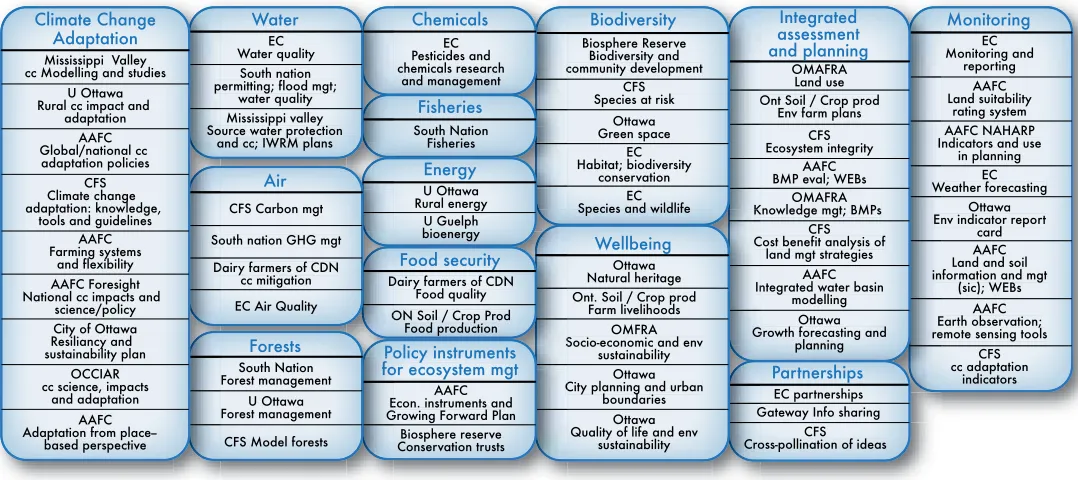
Figure 2. Examples of stakeholder mapping applied in adapation planning–synthesis of involved organizations and their goals and mandates in the Eastern Ontario region ... 13
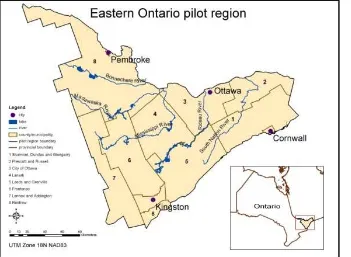
Figure 3. Chosen area for integrated landscape-level assessment for Eastern Ontario region ... 15
Figure 4. Understanding Regional Context in Adaptation Innovation & Learning Framework... 18
Figure 5. Graph of importance versus uncertainty of drivers and other issues of concern from the stakeholders workshop. ... 20
Figure 6. Concept map connecting issues raised in workshop (a) ... 21
and final version of F2R EO system diagram (b). ... 22
Figure 7. Describing and Evaluating the BAU in Adaptation Innovation & Learning Framework ... 24
Figure 8. Photo of the current landscape ... 25
Figure 9. Creating and Evaluating Alternative Future Scenario in Adaptation Innovation & Learning Framework ... 27
Figure 10. Illustrative vision for the Targeting foreign markets scenario ... 28
Figure 11. Illustrative vision for the Promoting bio-economy scenario ... 29
Figure 12. Illustrative vision for the Greening agriculture scenario ... 30
Figure 13. Illustrative vision for the Living locally scenario ... 31
Figure 14. Developing Adaptation and Innovation Strategies in Adaptation & Innovation Framework ... 33
Figure 15. Adaptive capacity framework modified for an agricultural region (adapted from IISD, PFRA, 2007; Smit et al. 2001).. ... 34
Figure 16. Mainstreaming Adaptation in Adaptation & Innovation Framework ... 37
Figure 17. Tracking Outcomes in Adaptation & Innovation Framework ... 41
Figure 18. The flow of information as decisions about data input, models, and outcomes are coordinated. ... 48
Figure 19. IDU Geometry Input Datasets: AAFC Cadastral, AAFC-AESB Land Cover, Detailed Soil Survey data... 52
Figure 20. Farms to Region Integrated Decision Unit (IDU) Framework. ... 53
Figure 21. Overview of quantification of data for the scenarios using the integrated Envision model ... 59
Figure 22. Relative change in IROWC-N over time across scenarios (kg/ha) ... 60
Figure 23. Nitrogen Risk and NAHARP Habitat outputs ... 61
Figure 24. Climate impacts on growing season ... 61
Figure 25. Example of Quantitative Metrics Output from Envision Simulation Runs ... 64
Figure A1. Schematic design of the Willamette Water 2100 project ... 82
Figure A2. Data and plug-in models for the Envision system for the Willamette Water 2100 project ... 83
Figure A3. ArcGIS Model Builder Steps performed to randomly select IDU Polygons for potential Pig and Poultry Farm locations ... 85
FIGURES
AAFC Agriculture and Agri-Food Canada AESB Agri-Environmental Services Branch ANSI Area of Natural & Scientific Interest BAU Business-As-Usual Scenario
BMP Beneficial Management Practice CA Canada
CC Climate Change
CFIA Canadian Food Inspection Agency CFS Canadian Forest Service
COSEWIC Committee on the Status of Endangered Wildlife in Canada DEM Digital Elevation Model
DSS Detailed Soil Survey
EC Environment Canada
EO Eastern Ontario (Canada)
F2R Farms to Regions
GF2 Growing Forward 2 Policy Framework (Canada) GIS Geographic Information System
IDUs Integrated Decision Units
IISD International Institute for Sustainable Development IPCC Intergovernmental Panel on Climate Change
IROWC-N Indicator of Risk of Water Contamination by Nitrogen IROWC-P Indicator of Risk of Water Contamination by Phosphorus NAESI National Agri-Environmental Standards Initiative
NAHARP National Agri-Environmental Health Analysis and Reporting NAPP National Agricultural Profiling Project
NGIS National Geographic Information System
OCCIAR Ontario Centre for Climate Impacts and Adaptation Resources OECD Organisation for Economic Co-operation and Development OMAFRA (OMAF) Ontario Ministry of Agriculture, Food and Rural Affairs OMNR Ontario Ministry of Natural Resources
OSU Oregon State University SARA Species at Risk Act
SLC Soil Landscapes of Canada
5
1.1 Mainstreaming Climate Change Adaptation
On average, the rate of warming in Canada since 1948 has been double the global average1.
Most future warming is expected to occur in the spring and winter months. However, extreme conditions, such as heatwaves, droughts, and severe storms, are expected to increase in frequency during the summer months (Intergovernmental Panel on Climate Change [IPCC], 2013). Although these trends help contextualize potential future changes, there is limited information available regarding how extreme conditions will change in the future, making it difficult for regions to develop adaptation plans tailored to their communities and sectoral groups. For instance, how will the frequency and magnitude of droughts and floods change within and across years? Will such changes impact regional infrastructure, like roads? And, how will changing conditions during the growing season affect agricultural production? Will new varieties and practices be required, and to what extent are our existing systems sufficiently robust (resilient) to withstand these changes? To help people and sectors prepare for future change, information regarding historic, present and future conditions needs to be considered in the context of key regional drivers, not only climate change. Global economics, tradition, migration and other factors are also critically important.
Adaptation, simply stated, is defined as an adjustment in natural or human systems in response to actual or expected climatic stimuli or their effects, in order to reduce harm or take advantage of opportunities. For agriculture, this could include any of a range of activities, such as raising river or coastal dikes, promoting
more temperature-shock-resistant plants instead of sensitive ones, or improving the effectiveness of pest-management practices (IPCC, 2007). However, responding to climate change adaptation is not just a stand-alone activity presented as specific climate change adaptation strategies and plans. Crucial to adaptation planning is ensuring that all necessary adaptation actions, policies and measures are effectively mainstreamed into sectoral (and other) planning strategies.
Mainstreaming adaptation will help to further coordinate adaptation planning across scales— from national, to regional, sectoral and program/ project levels—and is increasingly recognized as critical to the implementation of adaptation measures. Mainstreaming is currently regarded as an innovative instrument replacing stronger— and often ineffective—mechanisms of coordination (Halpern et al., 2008). Further, it is proposed as an effective tool to enhance policy development by increasing sectoral policy coherence, addressing trade-offs between different sectoral objectives and capturing the opportunities for synergistic results in a way that will meet social, economic and environmental priorities (Kok & de Coninck, 2007). In this respect, mainstreaming may be seen as a way of integration giving equal importance to different sectoral properties and finding ways to maximize benefits across the involved sectors. This is highly relevant for climate adaptation, as it aims to maximize capacities for adaptation while achieving aims and priorities related to agriculture, environmental protection and others. In the context of adaptation, mainstreaming helps highlight important development/climate
change issues and linkages, whether they are sector-specific, or span jurisdictions and/ or landscapes. They thus assist in: identifying weaknesses in policy, legal and institutional frameworks for ensuring resilience; and prioritizing targeted actions, research and policy regarding potential adaptations.
Lastly, improving national and regional information related to climate change impacts is critical to building a resilient agricultural system. Gathering and creating information on vulnerability to climate change and improving collaboration between researchers, policy-makers and other stakeholders will be instrumental to achieving adaptation outcomes (Gagnon-Lebrun & Agrawala, 2007; Howden et al., 2007; OECD, 2009; Swart et al., 2009).
Given these urgent issues in adaptation planning, the objective of this guidebook is to present an integrated landscape assessment and decision-support process to aid in mainstreaming climate change adaptation into regional policy and planning via agriculture policies and best management practices with a focus on the landscape level. Addressing climate change at the level of strategic planning, policy design and implementation across sectors and jurisdictions is becoming an integral part of the policy and planning process. In this guidebook we focus
on providing a detailed overview of how
to construct such an integrated model based on the development of scenarios for use as a basis for mainstreaming climate adaptation.
1.2 Purpose and Potential Users of the Guidebook
Land managers and planners have to adapt and choose their practices according to what is going on in their region. Agricultural landscapes are complex mosaics of land use, production, and multifaceted communities that are uniquely defined by each region’s specific biophysical, social, cultural, and economic conditions. Agriculture, like all sectoral activities, is affected by a range of external factors, including demographic changes, economic trends, and ecological functions. In the case of farmers, this includes local weather conditions, year-to-year expectations of change, as well as regulations and other management objectives. Planning on a year-to-year basis is becoming more difficult as land-use dynamics and pressures become more complex, and the rate of change increases due to new technologies and globalization.
The key rational for the approach to mainstreaming adaptation presented here are as follows:
• Stakeholder engagement combines local stakeholders’ understanding of what has happened in the past with what might happen in the future, and can assist in establishing the range of possible futures. By setting the focus in a geographically bounded and familiar area, stakeholders (including regional experts) express priorities and constraints that are often shared by other stakeholders simply by way of geography. Together, mixed stakeholder groups can quickly identify desirable outcomes for the region, key drivers of change, and appropriate indicators to track outcomes. These multidisciplinary discussions allow different scenarios to be defined, and identify quantitative measures that can be used to compare and contrast scenarios and explore the utility of different policy and management adaptation options.
• Scenario-based alternative futures methodologies provide established processes for identifying and defining different sectoral objectives and considerations using a “place-based” approach. As scenarios are storylines or narratives of possible future conditions, they make no prior judgment about what is good or bad, but provide informed estimates derived from current and historic information and assumptions about alternative paths to the future.
1.3 Structure and use of the Guidebook
This guidebook was developed as an outcome of collaborations between a number of organizations, including government, academia and civil society, to identify adaptation needs and priorities for the region of Eastern Ontario (Canada) referred to as the Farms to Regions project for Eastern Ontario (F2R EO). This application was based on the previous experiences of the project team in integrated modelling, scenario analyses and policy-making. When using this guidebook for mainstreaming adaptation into agriculture, we suggest beginning with a review of the whole document by a smaller expert group and then working through the step-by-step sections that outline activities required to implement the approach presented. Some of the applications of the steps could take anywhere from a few days to many months depending on the status of modelling, collected data, and the development of collaborations
in the specific area. Those more specifically interested in the dynamic spatial model used to simulate alternative futures are directed to the open-source software and tutorial information identified in the appendix. The time required to undertake work outlined within this document will depend on the focus or area of interest and the amount and types of resources and information that are available. We therefore encourage working with this document in a highly flexible way based on what the specific needs and situation of the practical application necessitates.
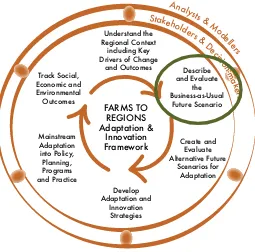
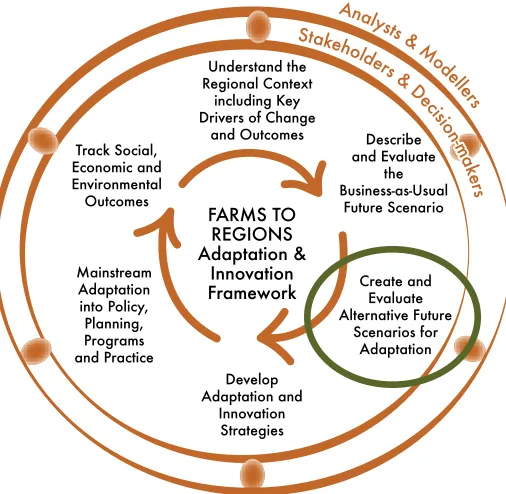
The approach suggested for mainstreaming adaptation is to develop capacity and bring together tools that can be used to consider the impacts and interactions of policy and management choices on socio-ecological systems (Figure 1). The model and framework presented in this guidebook were established for an agricultural region but could be readily adapted to non-agricultural areas.2
The framework was designed to address the following adaptation planning process:
• Provide a shared framework that would allow practitioners and stakeholders representing different interests and governing structures to engage in the collaborative planning processes.
• Enable synergies and identify trade-offs between different sectors and within sectoral activities to increase adaptive capacities. • Create an iterative process that would
allow integration of both qualitative and quantitative data when assessing adaptive capacities and needed adaptations and their mainstreaming when planning for future actions.
The process of the framework applications begins with identifying appropriate stakeholders, conducting a preliminary analysis of key issues and drivers affecting the region, and preparing for two parallel activities denoted as the two outer brown rings in Figure 1. The framework is operationalized through collaborations with two major groups and the interaction within and between the analysts & modellers and the stakeholders & decision-makers. These groups are engaged in parallel activities to:
(i) acquire data and regional models and integrate available tools and information into a dynamic assessment tool and (ii) define the socioeconomic system and provide input and direction on alternative future scenarios, risk, potential adaptations, their relevance and needed policies. The two tasks, while technically different, require ongoing coordination and alignment (brown nodes linking the two outer rings). The overall project is orchestrated by a core working group comprising a subgroup with technical expertise in the sciences, including the use of climate change model projections, and geographic systems to populate the dynamic system platform—in our case a transferable system called Envision—and a second subgroup of risk and/or policy experts responsible for engaging stakeholders in order to characterize and define the current and future trajectories of change.
Figure 1. Farms to Regions – Adaptation & Innovation Framework
2. A hydrological application is currently underway through joint work between Carleton University, Department of Geography, and the Engineering Department, Dalhousie University, in conjunction with Agriculture & Agri-Food Canada.
Analysts & M Drivers of Change
11
Climate change is expected to lead to a 2.5 per cent to 3.7 per cent warming in Ontario by 2050, compared with annual baseline average temperatures from 1961 to 1990 (Ontario Ministry of the Environment, 2011). Over the next 35 years, total precipitation is expected to undergo little change in the province, although extreme rainfall events will become more frequent (Expert Panel on Climate Change Adaptation, 2009). One of the major threats to Ontario agriculture is therefore an increased likelihood of intense dry periods. In addition to growth, climate change will affect a large array of factors, including propagation and introduction of weeds, pests and diseases, decreased soil fertility, excess moisture, among others.
3.1 Stakeholders’ Participation and Collaborations
This step describes key actions to be undertaken with stakeholders to establish the scope and priorities in order to initiate the framework and ensure that it is properly focused during the early phases of the framework. This includes, for example, identifying stakeholders, defining the focus of the project, and reviewing available data sets, existing models, and regional information that will form the basis of future stages of the project. Approximate time for preliminary work: two to four months, depending on resources.
Creating a Project Team
This team will be responsible for ensuring that the day-to-day implementation of the project is done effectively. The larger the landscape considered, the greater the amount of outreach and coordination required to orchestrate the overall project. When setting
up the project team, it is therefore crucial to cover the range of different areas of expertise required to lead the various tasks, which range from stakeholder engagement facilitation to quantitative modelling. It is also important that the team members come from different institutions so that they can provide information from a broader range of sources, and convey findings (and conduct peer review) with a diverse stakeholder group (i.e., with specific agencies representing different sectors and jurisdictions). This approach also allows for a number of key agencies to stay informed, representation of different views and preferences, and the provision of better access for broader stakeholder engagement.
We used a core team that ranged from four to six people to coordinate inputs and pursue external expert opinion and support from a much broader range of project stakeholders and external experts. For the decision-makers and stakeholder groups, if the audience has a spectrum of people ranging from public officials to members of the public, the project team members should represent some of this range. Ideally, the team will include natural resource managers, and data or subject matter experts (e.g., forestry companies, municipal governments) representing key disciplines, as well as a range of science, economic, and policy perspectives. The team should also include individuals from responsible authorities within the region.
Identifying the Focus Question
and other useful context forms the basis for the first stakeholder engagement, during which basic parameters of the project (questions and priorities) are defined and agreed upon for the study region. A first critical step in any stakeholder-driven futures exercise is to clarifying the focus question. The focus question typically evolves in the early stages of the exercise as project partners and stakeholders begin to clarify in their own minds their desired outcomes within the mandate of the initiative. Examples of focus questions are listed in Box 1.
Box 1. Examples of focus questions in climate change adaptation initiatives using scenarios
• What socioeconomic changes may influence the municipality most within the next 30 years? (Carlsen et al., 2012)
• What socioeconomic changes are important for the ability of the municipality to deal with the impacts from future climate change? (Carlsen et al., 2012)
• What socioeconomic changes are
important for assessing and evaluating the appropriateness of the proposed options? (Carlsen et al., 2012)
• Given climate change projections, what are the priority actions under the climate change adaptation strategy for our municipality to address to climate change and to promote healthy and resilient region?
• How might future social, economic and ecologic conditions including climate change affect sustainability in Eastern Ontario (i.e., impacts on water, soil, habitat, biodiversity, forests, livelihoods, health, social relations), and how might agricultural policies and practices help maintain environmental services and enhance the ability of stakeholders to adapt to change now and in the future?
Stakeholder Mapping
The main purpose of the participation is to ensure the legitimacy of the outcomes, build on stakeholders’ expertise and preferences and promote mutual learning (Volkery et al., 2008). This is accomplished by assembling a good cross-section of participants, from citizens to experts and public officials. For highly technical initiatives, aimed at policy development in specialized fields of, for example, agriculture or forestry, stakeholders will also include technical staff from these sectors and, perhaps, outside scientists or technical specialists. Recently, the importance of broader stakeholder participation is being emphasized as key to ensuring cross-sectoral linkages, cross-checks for trade-off analysis and the recognition of potential synergies. This is especially important since even narrowly focused actions and policies can bring cross-sectoral co-benefits, including supportive learning and new collaborations among stakeholders.
The stakeholder mapping serves two key purposes. One is to identify a diverse group of stakeholders that are willing to participate within the project, and the second is to document any knowledge or information gaps that will need to be addressed – for example, by identifying missing expertise to ensure all necessary aspects of the project focus are represented.
of management, both local and regional level mainstreaming adaptations will be considered. Stakeholder diversity (including community members, policy-makers, researchers, experts, civil society, non-governmental organizations and media) serves to increase the information base for the assessment. Local community members, farmers and producers have valuable knowledge about consequences of climate change impacts and many of the adaptation options are already familiar to stakeholders, even if they are not explicitly recognized as helping to reduce vulnerability to climate change (i.e., co-benefits). Building on the familiarity of these actions also increases the empowerment of stakeholders—including decision-makers—as they can see themselves as valuable sources of knowledge for developing responses to climate change.
Overall, mapping serves to identify the needs systematically and thoroughly. We would like to suggest the following basic criteria in this exercise:
• Representativeness—expertise covering key sectors such as water, production, planning. • Influence on policy—authorities from
relevant jurisdictions involved in policy and planning.
• Knowledge of relevant science—subject matter experts in biology, agriculture, and engineering.
• Availability—experts with available time and interest to engage for duration of scenario process and/or some redundancy in expertise is represented in group as a whole.
In order to assure that the different stakeholders are represented, a stakeholder analysis is a very helpful tool. The analysis identifies key stakeholders, cross-checks criteria such as representation across sectors, gender and available capacities. It also helps to identify potential information or representation gaps (Figure 2). Usually, stakeholder analysis includes three elements:
1. Key issues or problems that will be discussed throughout the project, initiative. In the context of the discussed project we focused on vulnerability in the context of agricultural production and how this needs to be addressed in the context of climate change impacts and adaptation needs as well as market competition locally and globally while limiting its impacts on natural resources and biodiversity.
2. Key mandates and responsibilities that will be key to ensuring mainstreaming of adaptation into the policy process that will be identified throughout the project initiative. Based on the identified issues and focus we needed to identify stakeholders groups working on agricultural systems, policies, markets, diversity, water and soil as well as those focused on climate change impacts and adaptation issues.
Figure 2. Examples of stakeholder mapping applied in adapation planning: Synthesis of involved organizations and their goals and mandates in the Eastern Ontario region
It is also helpful to keep membership open throughout the project, since new expertise and representatives can be included to better refine and improve the representation of perspectives and information, as well as establish new linkages. Open membership also acknowledges the reality that participant availability will ebb and flow over the lifetime of a project.
Choosing the Boundaries of the Study Area
The study area serves as the basis for all further discussion in the adaptation planning. There are two different types of spatial focus following either the political/jurisdictional boundaries and/or focusing on an eco-unit/ecosystem boundaries. A brief comparison between the two approaches is presented in Table 1.
In the application focused on Eastern Ontario, the boundaries of the areas were defined by
established reporting boundaries—Statistics Canada includes eight census divisions used for national reporting which also correspond to recognized municipal and regional jurisdictions. The size of the Eastern Ontario study region is 31,297 square kilometres (Figure 3). This meant that we primarily aimed to cover a large landscape area in which changes could be monitored and assessed at subregional levels using established census data and reporting units. We also restricted our focus to the province of Ontario, so the area was fully within Canada. The chosen area stopped at the Canadian-U.S. border to make it easier to include current and future policies under the jurisdiction of national and provincial governments, rather than across international borders, which would be harder to do when working in two different countries. The boundaries were set during the first workshop.
Monitoring Env indicator report
card AAFC Land and soil information and mgt
(sic); WEBs remote sensing tools
CFS cc adaptation
indicators AAFC NAHARP Indicators and use
in planning Knowledge mgt; BMPs
Ont Soil / Crop prod Env farm plans
CFS Ecosystem integrity
CFS Cross-pollination of ideas
CFS Cost benefit analysis of
land mgt strategies AAFC BMP eval; WEBs
AAFC Integrated water basin
modelling Ottawa Growth forecasting and
planning
Partnerships EC partnerships Gateway Info sharing K Ont. Soil / Crop prod
Farm livelihoods OMFRA Socio-economic and env
sustainability Ottawa City planning and urban
boundaries Ottawa Quality of life and env
sustainability CFS Species at risk
Ottawa Species and wildlife c Dairy farmers of CDN
Food quality for ecosystem mgt
AAFC Econ. instruments and Growing Forward Plan Biosphere reserve CFS Carbon mgt
Forests South Nation Forest management
U Ottawa Forest management
CFS Model forests South nation GHG mgt
Dairy farmers of CDN cc mitigation
EC Air Quality South nation permitting; flood mgt;
water quality Mississippi valley Source water protection
and cc; IWRM plans
So Mississippi Valley cc Modelling and studies
U Ottawa Rural cc impact and
adaptation AAFC Global/national cc adaptation policies
CFS Climate change adaptation: knowledge,
tools and guidelines AAFC Farming systems
and flexibility AAFC Foresight National cc impacts and
science/policy City of Ottawa Resiliancy and sustainability plan
OCCIAR cc science, impacts
and adaptation AAFC Adaptation from place--
Table 1. Comparison of advantages and disadvantages when focusing on an ecounit or political boundaries
Ecounit boundary Advantages
• More meaningful interpretation of environmental trends relevant to specific ecosystems.
• Better understanding of ecosystems as functional units. • Direct connection to ecosystem-scale policies.
Disadvantages
• Limited availability of some data expressed at the scale of ecounit (particularly socio-economic data).
• Political complexity arising from analysis of resources under shared jurisdiction.
Jurisdictional (political)
Boundary Advantages
• More uniform regulatory environment. • More simple data collection.
• Direct connection to jurisdiction-wide policies.
Disadvantages
• Resource-specific trends masked by data collected on the level of political jurisdiction.
• Difficulty detecting differences in ecosystem impacts of specific policies.
Preliminary Data Availability Assessment /Core Data Sets Availability
When working with models, analysts and modellers will play key roles in translating and quantifying the scenarios, and in representing adaptations and landscape changes in the regional simulation model. As such, both groups of stakeholders but especially the analysts and modellers, will play key roles in gathering necessary data sets to run the simulation models, whether economic, biological, or physical.
The datasets used in spatially explicit simulation studies may include (1) landscape maps describing land uses in general, and crop, forest, and vegetation types, (2) human population by spatial regions and age classes, (3) agriculture and forestry practices and their prevalence, (4) water resources such as streams, rivers, lakes, reservoirs, and dams, (5) climate data both past,
present, and future estimates, (6) soil maps with attributes relevant to agriculture, forestry, and human development, (7) land ownership parcel or lot boundaries, and (8) spatial distributions of plants and animals of interest for conservation or recreational purposes. The project team uses this information to identify key issues and approaches that serve as the guide for information and model requirements to feed into the integrated assessment and futures analysis tools. In our application, we focused on making use of data and information that was publicly available and would, therefore, create a base set of criteria for future project groups, including those with limited resources to purchase spatial data sets. This is particularly important in the use of climate change data, since many groups will not have the expertise in-house to process and analyze these types of specialized datasets.
Figure 3. Chosen area for integrated landscape-level assessment for Eastern Ontario region
Defining the Time Frame
The time horizon for a project is crucial in making the results of a study relevant for stakeholders. From the stakeholders’ perspective, it is important to allow some distance from current trends and challenges, since this enables forward thinking that facilitates discussions regarding sensitive issues. Thus, it is important to choose a longer time span of at least 20 years, which avoids the current socioeconomic state of affairs and political circumstances, which might otherwise dominate the discussion. In contrast, a focus on, for example, the next 20 to 40 years is more likely to stimulate an open discussion that is broached in terms of system changes (van de Kerkhof & Wieczorek, 2005). This timeframe then can be broken up into medium- and short-term horizons when outlining specific actions and policies needed to get to the envisioned and preferred scenarios and pathways. This is important since the planning time frame for groups like farmers is short (one to two years) relative to forestry or urban planning communities (five+ years).
Analytical considerations: From the modellers and analysts’ perspectives, there are a number of temporal parameters for a futures study: (1) The baseline time, meaning the time from
which the future scenarios are projected, and the time at which typically simulation models typically take as time zero.
(2) The ending time for the study, the time at which simulation models stop, and for which the most important outcomes are generated.
(3) Intermediate times for which outcomes are also measured in order to produce a trajectory of outcome behavior.
(4) The primary time step for simulation modelling, from which some models may deviate because of the time scales of the processes they simulate. An additional time parameter may be the time period in the past for which certain processes, such as weather or climate patterns, are calculated to prepare the appropriate parameters for initializing certain models.
For the Eastern Ontario study (F2R EO), the chosen endpoint for the scenarios that policy-makers were working with focused through 2035, which is approximately 25 years. This time horizon was divided into short-term horizons that recognized the timing for adaptations and needed policies to be implemented. The baseline time was in this case fixed to be 2010, corresponding to the intervals at which census data were available within the study region. Intermediate times for reporting model outputs have not been decided at this time; however, the Envision model allows for reporting at daily (and up to yearly) time intervals. The preliminary model uses primary time steps of one year.
3.2 Developing Scenarios
We define a scenario as a story about the future that can be told in both words and numbers, offering a plausible and internally consistent explanation of how events unfold over time (Gallopín, Hammond, Raskin, & Swart, 1997;
Raskin, Banuri, Gallopín, Gutman, Hammond,
Kates, & Swart, 2002). Scenarios are neither predictions of socioeconomic development nor impacts of changing climate; rather, they are plausible descriptions of how the future may possibly develop, using recognizable signals from the present and assumptions on how current trends will progress (Jaeger, Rothman, Anastasi, Kartha, & van Notten, 2008). Scenarios can be used for multiple purposes, ultimately providing better policy or decision support and stimulating engagement in the process of change (Jaeger et al., 2008).
The use of scenarios or narrative descriptions of possible future trends started in a formal way in the middle of the 20th century when Herman Kahn assisted the military in thinking about the possibilities of nuclear war (Coates, 2000), and then by businesses and other organizations aided by Kahn and the Rand Corporation (Godet, 2000). In landscape planning, McHarg’s Design With Nature (1969) popularized the application of the scenario approach to spatial problems. At the same time that McHarg was working, Lewis (1996) and Steinitz (2010) were also developing this approach to landscape planning.
A number of authors have recently emphasized the importance of using scenarios in adaptation planning. Recently, Shaw, Sheppard and Burch (2009) and Langsdale et al. (2009) in Canada, Carlsen et al. (2012) in Sweden, and Tompkins et
al. (2008) in the United Kingdom applied scenario approaches with stakeholder participation using downscaled scenarios from the Intergovernmental Panel on Climate Change’s Special Report on Emissions Scenarios (SRES). These scenarios included population changes, economic development and projected climate change impacts on local communities. Working with these trends the involved stakeholders discussed potential future pathways for relevant key sectors and identified adaptations in the context of these scenarios. Similarly, Langsdale et al. (2009) combined climate change projections with projected population trends, agricultural activities and conservation needs to identify adaptation options in the water sector using an integrated model developed through stakeholder collaborations. Shaw et al. (2009) also developed a series of visualizations of the future, with different severities of climate change impacts (depending on the chosen SRES scenario) and possible adaptation options.
identifying robust adaptation choices for future socioeconomic and climatic states (Carsen et al., 2012; Langsdale et al., 2009).
Identifying Key Drivers of Change Affecting the Landscape
To better understand potential future challenges, the major drivers of change need to be considered (Figure 4). This is necessary because certain drivers can influence how a region will change, and, in some cases, this may limit how resources are managed, or how decisions about public goods are determined. Such drivers can be local or regional, such as those based on available resources and infrastructure, population growth, and types of governance systems (Table 2). However, they may also be extrinsically based, in which case the region may have limited or no ability to influence them; global changes in market prices, trade agreements and barriers to trade, including changes in resource development in other countries that might have secondary impacts on locally based sectors are key examples. Although external factors may not be under local influence, the opening or closing of factories, or shifts in agricultural or other resource activities resulting from global factors will have significant ramifications for local economies and the types of choices that they need to consider in the future.
The drivers could be identified by the project team, but it is more relevant if they identify with the stakeholders, as doing so builds on their diverse perspectives and expertise and it also increases the legitimacy of the outputs that are created in the next steps of the project.
Figure 4. Understanding Regional Context in Adaptation Innovation & Learning Framework
Analysts &
M Drivers of Change
Identified key drivers of Interest
Agriculture
Nature and biodiversity; species at risk Water quality
Policy
Population
Governance Employment
Energy infrastructure Air and water pollution
Freshwater quality
Infrastructure
Institutional changes
Competition over land-use
Regional administration organization
Changes in precipitation
Integration of land-use policies at the local level
Participation in regional policy-making Population growth
Climate Change (overarching)
Economics/Profitability/Variability (global market changes)
Demographics/Densification Environmental Policy & Regulation Fossil Fuel Supply (cost, alternatives) Communication & Governance
Place of application
Corn Belt region in the Middle and Upper Mis-sissippi sub-basin of the MisMis-sissippi River Basin (Nassauer, Santelmann, & Scavia 2007)
British Columbia, Canada
(Tansey, Carmichael, VanWynsberghe, & Robin-son 2002)
Sweden, municipal level (Carlsen et al., 2012)
Bras D’Or (Canada), regional (Bizikova & Hatcher, 2010)
Eastern Ontario
Focus of this guidebook
In our Eastern Ontario study, the key drivers were developed during the first stakeholder workshop. Information gathered during the pre-project scoping formed the basis of a series of brief presentations of current trends (agriculture, economic and ecosystem health). During this session of the workshop the following key questions were asked:
1. What are the key drivers that affect achievement of the regional goals? 2. How important and uncertain are these drivers going forward?
Figure 5. Graph of importance versus uncertainty of drivers and other issues of concern from the stakeholders workshop
Economics on Farm (influence by national trade policies)
Increased growing season Population of fossil fuel
Economic
viability of agriculture Economics (e.g. market access, drivers, productivity)
(invasive spp., changing farm practices and farm conditions)
Economic resiliance of farms Climate variability (increasing management & impacts on profitability)
Increase in demand for food and fuel (intensification,national & international, US policy)
Communication and support (legislation)
Critica
l Uncerta
inties
Discussions around these questions with the mixed expertise of the stakeholders resulted in a wide-ranging, but coherent picture of the drivers affecting this region (Table 2; Figure 5). Among these, those identified as the most important and most uncertain fell clearly under the headings of climate change; markets and the economy; and governance and policy (Figure 6). In addressing these two questions, the break-out groups synthesized these into seven key drivers, with climate being considered as an overarching driver with implications for all others.
Subsequent to the workshop, the project team together held further consultations with key stakeholders from a range of disciplines to distill the workshop results into a coherent set of drivers, systems of interest, and outcomes or endpoints. These were expressed in a system diagram (next section; Figure 6a/b).
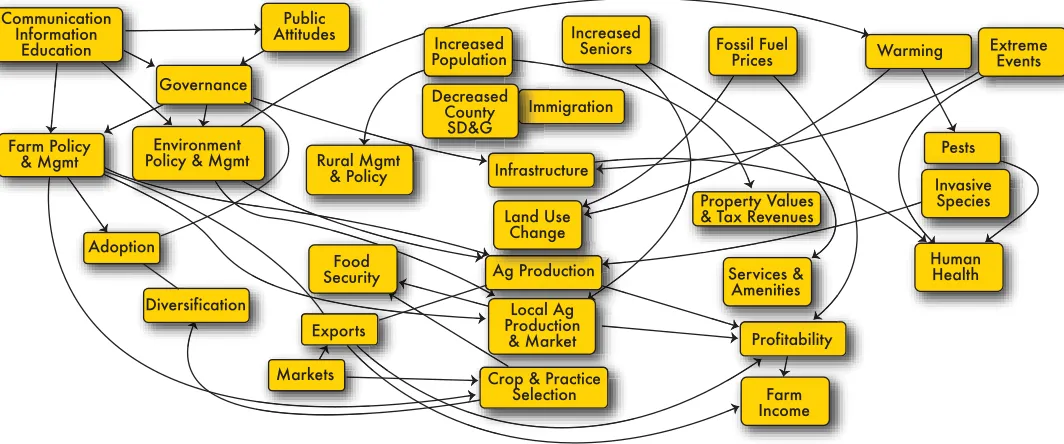
Preparing a System Diagram
A valuable exercise at the beginning of a project is to visually represent the various issues, components, drivers, and outcomes as they are known, or as they become known in discussion, in a diagrammatic form. For the F2R EO project, this occurred in two stages. First, a free-flowing brainstorming session was held to try to connect the various issues from the first workshop into
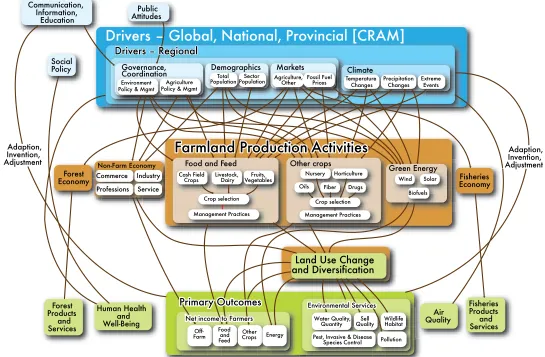
a concept map, showing issues in boxes and influences of one issue upon another as flows or arrows (Figure 6a). The second step was then to synthesize the information in the concept map into a system diagram that tried to capture all the relevant drivers and related factors. In our study in Eastern Ontario, our focus was on factors affecting the agriculture system, which included subsystems of production as principle concern, but also non-agricultural outcomes of interest to stakeholders (e.g., wildlife habitat, water quality; Figure 6b).
Figure 6a
& Mgmt Policy & MgmtEnvironment
Adoption
Diversification
Food Security
Exports
Markets Crop & Practice Selection
& Tax Revenues
Services &
Prices ExtremeEvents
Figure 6b
Public Attitudes
Drivers – Global, National, Provincial [CRAM]
Governance, Coordination
Environment Policy & Mgmt
Agriculture Policy & Mgmt
Forest
Demographics Markets Climate
Fisheries Economy Food and Feed Other crops Green Energy
Cash Field
Crops Livestock,Dairy VegetablesFruits,
Nursery Horticulture
Pest, Invasive & Disease Species Control
Land Use Change and Diversification
Quality WildlifeHabitat
Pollution
Net income to Farmers
Environmental Services Primary Outcomes
Net income to Farmers
Environmental Services
Farmland Production Activities
Farmland Production Activities
Total
PopulationPopulationSector Agriculture,Other Fossil FuelPrices TemperatureChanges PrecipitationChanges ExtremeEvents Drivers – Regional
Drivers – Regional Communication,
Information, Education
Three main levels of components were defined in the F2R EO case, arranged from top to bottom. At the top are the drivers, in the middle the production systems, and at the bottom the outcomes of interest. The drivers represent those identified by stakeholders as having the greatest impact and uncertain effect on the outcomes stakeholders care about. They are grouped into two components: climate drivers (on the right) and human social, political, and economic drivers on the left. These are represented a mixed assortment of drivers, including those over which the region has some control (e.g., agricultural and environmental policies) and those over which the region has limited, or no direct influence (e.g., climate change, global markets). These drivers form the basis for differentiating the alternative future scenarios, as they represent overarching change-drivers that will influence how the production systems change in the future.3
The second level describes three broad categories, local agriculture production systems: the non-farm economy, green energy farming, and food and feed farming. Also included were non-farm economies, such as commerce, industry, and services, along with other important regional sectors (i.e., forestry, and fisheries). We were able to develop details and models describing the agricultural system with the stakeholder expertise of participants, but were unable to engage participation from stakeholders from the non-farm, fishery, and forestry sectors. One of the reasons for using an adaptive management framework is that it establishes a cyclical process, in
which new information and perspectives may be incorporated into the model, which is a “work in progress,” rather than a final product. Consequently, by including these additional components into the system map, they are considered during the initial work, and can be more fully expanded into the maturing model and regional scenarios.
Since the purpose of alternative scenarios approaches is to evaluate the relative merits and limitations of alternative pathways of change, including adaptation, the primary outcomes play an important role in comparing the “performance” of different alternative futures and adaptation choices. In the Eastern Ontario project, two general categories of outcomes were considered: net income to farmers (from the three farm production systems described), and environmental outcomes, including those affected by agricultural production as well as other non-agricultural factors. Outcomes may be based or derived on sectoral or socioeconomic priorities, but should include measures that allow local stakeholders, land managers, and policy-makers to gain new insights regarding adaptation options, costs, and trade-offs. In Eastern Ontario this included, for example, incorporating established metrics and indicators of change that were used by municipal and other regional bodies in their reporting and analyses. We also factored in concerns regarding human health and air quality as priority outcomes to model in subsequent analysis.
Figure 7. Describing and Evaluating the BAU in Adaptation Innovation & Learning Framework
Creating Alternative Future Scenarios
Planners, policy-makers and other stakeholders involved in adaptation planning are increasingly recognizing that the strategies needed are multifaceted and cross-sectoral, requiring stronger linkages between adaptation actions and future development priorities Figure 7). To address these challenges, scenario approaches were suggested for investigating potential future socioeconomic and environmental conditions to create the context for an assessment of climate change impacts and needed adaptations.
The scenario development was done in two steps. First the stakeholders focused on developing a business-as-usual (BAU) scenario, describing current interrelationships and dynamics, and secondly, a series of alternative scenarios were described as representing different trajectories of change. Change was considered from the perspectives of policy and regulation, external influences over which the region can respond but has no control, as well as more local influences of change. Both groups of scenarios focused on illuminating how the critical uncertainties would influence a region now, and in the future.
Creating a Business-As-Usual (BAU) Scenario
For the BAU, stakeholders identified what each driver was expected to do in the future, especially for environmental and agricultural policies, and extrapolated these impacts on of the various farming systems and non-farm activities within the region (following the categories of the system diagram). The BAU scenario was developed by each group during these workshops, to increase the scope of the BAU and provide robust results. These variants were discussed in a plenary session in order to agree on the final form of the BAU.
Analysts &
M Drivers of Change
and Outcomes Describe and Evaluate
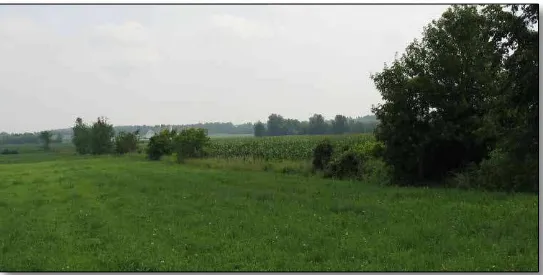
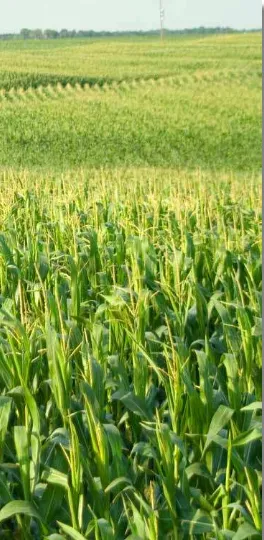
Figure 8. Photo of the current landscape
Example of the BAU developed for the EO project:
i. Climate change increases growing seasons but also increases the occurrence of extreme and catastrophic weather events. Climate change was considered an overarching driver that would have known, but unpredictable impacts on the regional socioeconomic, natural and agricultural systems in Eastern Ontario. Whereas regional climate models indicate that growing degree days and overall temperatures would become more favourable for crops generally, the increased incidence, intensity, and frequency of extreme weather events would ultimately influence the performance of regional production systems, urban centres, and sectoral activities. As such, it was expected that new cultivars and crops would be introduced
into the region to take advantage of favourable growing conditions, but that their success would be linked to the occurrence of weather events. Risk management and insurance traditionally practiced by rural and agricultural communities would continue to be used in the future.
prices and, consequently, local productions and socioeconomic systems. In this scenario, existing policies, regulations, agreements, and existing infrastructure and sectoral activity form the basis of what is (and is not) possible in the future.
In terms of agricultural policy it is envisioned that more interest will be directed at greening the food supply by, for example, the introduction of “greener” standards (by e.g., the Canadian Food Inspection Agency, CFIA).The use of certification programs for agricultural products is also expected to increase, driven by an emerging industry response to consumer demand. This trend is expected to continue into the future, and strengthen or expand existing regulation and enforcement. There could also be greater consumer interest in certified and uncertified organic products. Given potential future climate change impacts there is expected a continuation of business risk management and insurance by producers and farmers.
In terms of environmental policy, stakeholders felt there will be a greater emphasis on economic considerations over environmental protection, although the way this would manifest will depend on specific subsectors and the regional priorities. The trend, however, of streamlining environmental regulations is expected to continue, with new agricultural standards being introduced for agricultural production. Consideration was also given to what is expected as increased environmental risk, in that additional incentives and programs to encourage improvements of practices to support ecosystems good and services are expected. Finally, it is expected that biofuel production will increase in the region.
iii. Economies and markets are subject to international markets and climate extremes: Small and medium-sized farms will fare less well in the future. Increasing wealth, combined with a growing number of trade agreements are expected to increase the demand for meat exports, with some regions experiencing a comparative advantage due to their geography and the anticipated effects of future climate change (e.g., Brazil). Although these markets may open to Canadian producers, the rate at which they develop will influence their access to these global markets. In Canada, middle-sized farmers were felt to be at risk of losing their market share due to issues of scale, which make them less competitive than larger farms.
The demand for local foods will persist. The emerging trend for local markets (eat locally, urban agriculture, organic) will continue in the future, although it is also not clear if supply management systems (e.g., marketing boards) or subsidies will continue in the future. It is therefore expected that input costs of production will increase as the cost of energy remains high, driving up the costs of fertilizers. Growing costs to small-scale producers were also seen to be linked to potential costs related to environmental regulations, insurance and tax increases, and operations. As such, the price of locally produced goods was expected to remain relatively high.
Figure 9. Creating and Evaluating the Alternative Future Scenario in Adaptation Innovation & Learning Framework
Creating Alternative Qualitative Scenarios
Because there is uncertainty about how the future will unfold, plausible futures are depicted as a range of outcomes that could happen, rather than a “preferred” or “most likely” outcome as is often used in alternative future processes. By having multiple scenarios, the unknown future is expected to fall within the range of these alternative scenarios. And, in contrast to the BAU scenario, the alternative scenarios used for assessment incorporate multiple forces of change that are of particular interest, such as human population growth, climate change, the introduction of different or new technology, as well as new sectoral practices, including adaptation actions.
At this second step, a range of alternative “plausible” futures is described, taking into account not only the impacts of the various key drivers, but also how the region could choose to react to these drivers (Figure 9). The first step was to draft a set of brief scenarios, based on discussions from the first workshop, to describe several different trajectories of future development for the Eastern Ontario region. In this case study, the specific purpose being to make assumptions about the impacts, and best regional strategies to deal with the critical uncertainties facing the region. To do so, the following steps were completed:
• A summary of projected changes in global/ regional population, global fuel prices, climate change trends for the region, as well as trends in economic growth and food prices was developed.
• A summary in which projected trends and foresights studies done for Canada were synthesized.
• The outcomes were compiled describing key policy priorities related to IPCC global scenarios, such as a focus on food security; establishing linkages between agricultural and energy markets (including changes in consumption patterns); describing trends in demand for agricultural products especially in fast-growing regions; increasing emphasis on economic development and regionalization; trade agreements, trade barriers and cooperation; promoting sustainability and local level actions (i.e., sustainable and beneficial management practices); developing new technologies to access markets (e.g., bioeconomy); increasing focus on ecosystem goods and services to improve environmental state;
Analy Drivers of Change
and risk management and adaptations to risk. • Implications of scenarios and foresight
products developed in Canada were identified to single out priorities that will likely shape the future of the Eastern Ontario region.
• Experts were consulted to determine the potential of future trends relevant for the region.
Based on feedback from the workshop in November 2011, and discussions within the project team, a set of simple scenario narratives were developed. Narratives aimed to provide ideas about the types of future trends in governance and policy, markets, agriculture and environment or other legislation that could be developed in the future. In some cases these changes represented responses to drivers, like climate change, while in other instances, these trends reflected economic or other types of regional interests. In each of the four scenario narratives we assume that significant changes in climate will be present:
• Targeting foreign markets: International trade
and market economics are key drivers in the agricultural system (Figure 10). Agricultural producers are interested in targeting growing global market opportunities. Large and specialized farms dominate the landscape to produce goods especially for foreign markets. Federal and provincial governments cooperate with industry in setting market-based incentives to enable meeting market needs both domestically and internationally. Efficiencies of scale are especially important for trade and competitiveness.
• Promoting the bioeconomy: International trade and markets are important in this scenario, but the emphasis shifts from traditional activities to more diversified and regionally based “life cycle” productions, with more direct impacts on regional socioeconomics and growth (Figure 11). The region will aim to explore opportunities from the bioeconomy including in energy production, pharmaceuticals, fabrics, cosmetics, plastics. The region aims to become a leader in the bioeconomy regionally, building on the opportunities in the area and exploring opportunities with local and provincial governments to develop this leadership. Economies of scale are important in this future, although to a lesser extent, since there tends to be more emphasis on regionally based industries and value-added products.
• Moving toward greener agriculture: Because
of increasing pressures on natural resources, the impact of severe weather events, and increasing interest in promoting food security at regional, national and international levels, there will be a stronger focus on improving environmental performance of agricultural production (Figure 12). Different levels of government will be involved in directing these changes through targeted agricultural policy and other mechanisms. For agriculture this would mean balancing efficiency and environmental impacts. Agricultural outputs will be targeted mostly to local and North-American markets.
• Living locally: Local food security and environmental performance are addressed through a shift toward more regionally based production (Figure 13). Smaller farms and farm partnerships dominate the producers’ group and create a diversified agri-landscape. They successfully explore niche markets, mostly regionally, and cooperate with local
governments (municipal and watershed) on market incentives, rules and regulation. The trend toward larger farms continues on more traditional production systems that remain in the landscape. This scenario is strongly tied to policy, regulatory, and incentive programming by governments.
• The second step was specifying these categories for modelling that could directly inform modelling—often described as changes compared to current trends: crop mix in production (annual and perennial including new), crop rotation (two major types of rotation), livestock feed supply, livestock production (types of livestock, intensive/extensive livestock operation); field management (irrigation, tillage; file-drainage; exiting and new); surface water management; agriculture inputs (chemicals, manure); pest and disease management; energy farms (size and planted crops); environmental stewardship (riparian/wetland buffers, freshwater quality an ground water protection; wildlife habitat and air quality and air quality (greenhouse gases).
• Finally, the third step was led by the project team that used this information and quantified it using the same categories as was provided to the stakeholders but expressing all of them in quantitative terms. For quantification, we used an integrated model—its setup is discussed in the next section.
An overview of the scenarios is listed in the appendix 6.3 and 6.4.
Each scenario represents one of several different trajectories of change that Eastern Ontario could realize, with some being more focused on markets and trade (Targeting Foreign Markets and the Bioeconomy) while others tend to be more regionally based, with varying reliance on policy, regulation and other incentive programs and tools (Moving Towards Greener Agriculture and Living Locally). In the F2R application, we used a three-step approach to translate these qualitative scenarios into explicit types of changes from one state to another, including the rate and nature of how these changes would be applied across the landscape. The steps are described below:
3.3 Development of Adaptation Options
One of the many challenges in developing adaptation plans is that there is no real way to know what future conditions will be like (Figure 14). In Eastern Ontario, our scenarios were defined along a sort of continuum of change that regional stakeholders felt they might need to prepare for. The use of different scenarios provides a range of potential future conditions or states (visually and quantitatively presented) for discussing adaptation needs and priorities both in general terms (e.g., where will conditions change?) as well as specific terms (e.g., what sector or land-use activities present the greatest benefits, or risks, to priorities for the region in the future?).
Figure 14. Developing Adaptation and Innovation Strategies in Adaptation & Innovation Framework
Analysts &
M Drivers of Change
and Outcomes Describe and Evaluate
The four alternative scenarios were explicitly developed to quantitatively represent different trajectories of plausible future conditions, and land use, as well as providing a basis to allow specific adaptation options to be explored. For instance, the nature and prevalence of different agricultural management practices differed among the scenarios. Specifically, each scenario differed in the degree to which incentives were used to increase the extent of agricultural diversification and the representation of ecological services (e.g., wetland protection for flood management), thus allowing stakeholders to discuss the relative merits and strategic use of incentives with respect to particular production and socio-ecological objectives.
The scenarios were set up to allow stakeholders to consider development of the region in general and agricultural practices in particular. The differences in the importance of policy instruments, such as incentives and regulations, market forces, such as export and trade agreements, and the retention of local ecological services allowed stakeholders to consider how their adaptation priorities would be expected to differ under different plausible futures. In terms of agricultural change, the inclusion of different agricultural practices allowed us to characterize the type of agricultural adaptation needs and strengths within the region. This includes, for example, asking questions regarding the way in which the different trajectories of change in agricultural intensification would exacerbate or minimize the need for adaptations.
future under climate change. The agricultural and environmental outcome measures in each of the scenarios will be used to characterize the sensitivity of the region to conditions under the various future trajectories and to test how the use of different types of adaptation options can manage against such risks. Although we identified a number of different determinants
of the region’s adaptive capacity (Figure 15) for this project, our particular focus is on economic and environmental determinants. In other words, we focus on the issues that would enable the region to protect the things they identified as being important to them (e.g., water quality and supply, wildlife, environmental health, etc.).
Economic Resources
Technological
exposure Environmental Services
Social Capital & Networks
Social capital, employment &
education
Communication (s) Food & Feed,
crops (production/earnings)
Off-farm earnings
Energy, other crops
Adaptive Capacity
Infrastructure
Health & Community
Services Information,
Skills & Management
Wildlife Habitat Water Quality
& Quantity
Soil Quality
Income generation
Land Use Change and Diversification Pest, Invasive Species & Disease Control/pollination
Data & Information
Workshops were held with stakeholders wherein participants were asked to identify the three most important considerations for adaptation options with regard to practices, policies and specific actions. Based on these considerations, they were asked to identify both the capacity that would be required to respond, and what an effective adaptation option would be under future climate change. This was repeated for each of the future scenarios. For each of the scenarios, diverse elements of adaptive capacity were highlighted. A summary of the considerations raised is presented in Table 3.
Table 3. Examples of feedback to the scenarios and adaptation needs
Key feedback on the scenario Adaptation and adaptive
capacity needs/preferences
Targeting global markets
Considered as having negative impacts on natural land cover and wildlife populations; however, the fact that farmers would be making more money could mean positive implications in terms of their health and overall well-being. The prevalence of monoculture could result in farmers and crops being more vulnerable to pest and disease outbreaks, resulting in crop loss and income decline
Large farms have higher adaptive capacity (e.g., access to insurance). It would require strong financial instrument coordination with policy to
prioritize other types of measures (public infrastructure, data, natural resource management).
Promoting bioeconomy
This scenario was perceived as being the most relevant scenario for the region; it manages to balance environmental and economic priorities. It was flagged that this scenario would also require additional investments not directly to agriculture but to R&D, commercialization and to develop access new markets as the produced biomass cannot be only used regionally.
Highly resilient scenario, but it also includes a high level of public and private investments, which needs to be structured in a way that promotes adaptive capacity, environmental protection and business development.
Greening agriculture
This scenario was perceived on one hand as relevant for current agriculture in the region and it was seen largely surprisingly that the contributions to especially natural resource protection are not more significant. On the other hand, the surprise was also the gap between the BAU and this scenario was initially seen as one that is close to BAU but with some “green fixes.” It was also indicated that under this scenario the change in the agricultural production is less significant and the changes in practices can be achieved through policy, private initiatives or both
This scenario indicated that significant changes (both at the level of practices and policy) are required to make the agriculture system resilient.
Living locally
This scenario would create a greater sense of community compared to other scenarios, enhancing social networks in the region. At the same time,
restricted trade with partners outside the region could increase food insecurity and result in volatile prices. The feasibility of the scenario was questioned because of relatively low interest in small-scale farming currently. This scenario could become a component of any of the three scenarios in which the region maintains small farm sizes and other green production only around urban areas.
At the small scale, this