FOR FIRST HALF 2002
Contents
Page
Financial Highlights 2
Net Interest Income 5
Non-Interest Income 6
Operating Expenses 7
Provisions 7
Asset Quality 8
Deposits 9
Loans 10
Capital Adequacy Ratios 11
Unrealised Valuation Surpluses 11
Geographical Segment Analysis 12
Business Segment Analysis 13
Appendix I: Unaudited Consolidated Profit and Loss Statement
Appendix II: Unaudited Consolidated Balance Sheet
Appendix III: Unaudited Consolidated Cash Flow Statement
Appendix IV: Unaudited Consolidated Statement of Changes in Shareholders’ Equity
Appendix V: Earnings per Ordinary Share
Appendix VI: Group Regional Exposure and Details on Group Non-Performing Loans
Financial Highlights
DBS prepares its financial statements in accordance with Singapore Generally Accepted Accounting Principles (“Singapore GAAP”).
Unaudited Financial Performance Summary For First Half 2002
1st Half 2002
2nd Half 2001
1st Half 2001
2nd Qtr 2002
1st Qtr 2002
S$'m S$'m S$'m S$'m S$'m
For the period (GAAP basis)
Operating profit 963.5 892.9 779.3 466.0 497.5
Net Profit before tax 789.2 597.0 766.4 373.8 415.5
Net Profit after tax attributable 531.4 369.7 629.5 253.4 278.0 to members
For the period (excluding goodwill amortisation)
Operating profit 1,100.0 1,024.3 779.3 534.7 565.2
Net Profit before tax 925.7 728.4 766.4 442.5 483.2
Net Profit after tax attributable 667.9 501.1 629.5 322.1 345.8 to members
At period-end
Shareholders' funds 14,066.7 13,529.1 11,142.0 14,066.7 13,812.8
Customer loans 64,561.2 68,208.0 69,617.4 64,561.2 66,340.4
Customer deposits 102,984.1 106,771.3 114,851.4 102,984.1 109,585.7 Total assets 152,008.9 151,294.3 156,497.0 152,008.9 153,957.4
S$ S$ S$ S$ S$
Per share
Earnings excluding goodwill 0.91 0.76 1.02 0.88 0.94 amortisation (annualised)
Basic earnings (annualised) 0.72 0.54 1.02 0.69 0.75 Fully diluted earnings (annualised) 0.69 0.52 0.96 0.66 0.72 Interim / Final dividend 0.14 0.16 0.14 0.14
-Net asset value at period-end 5.74 5.38 5.85 5.74 5.63
Performance ratios (annualised)
1st Half 2002
2nd Half 2001
1st Half 2001
2nd Qtr 2002
1st Qtr 2002
(%) (%) (%) (%) (%)
On a GAAP basis
Return on assets 0.70 0.44 1.08 0.66 0.73 Return on equity 7.73 6.44 11.36 7.26 8.14
Excluding goodwill amortisation
Return on assets 0.88 0.64 1.08 0.84 0.91 Return on equity 9.71 8.78 11.36 9.22 10.12
Efficiency and revenue mix ratios
Cost:income ratio (excluding goodwill 45.5 49.2 49.0 46.3 44.8 amortisation)
As a percentage of total operating income:
- Net interest income 65.4 64.2 62.9 65.5 65.4
- Non-interest income 34.6 35.8 37.1 34.5 34.6
BIS Capital ratios (at period-end)
- Tier 1 capital 12.6 12.2 11.6 12.6 12.5
Adoption of New Accounting Standards
Effective for financial periods beginning on or after April 1, 2001, companies in Singapore are required to adopt the revised Statement of Accounting Standard 12 on Income Taxes. As a result, DBS Group Holdings and its subsidiary companies (“DBSH Group”) has applied the revised Standard with effect from January 1, 2002. There is no material impact on the Group financial statements for first half 2002 (1st Half 2002).
Unaudited Financial Performance Summary For First Half 2002
S$'m
1st Half 2002
2nd Half 2001
1st Half 2001
2nd Qtr 2002
1st Qtr 2002 Profit and Loss Account
Net interest income 1,321.4 1,295.3 961.5 651.5 670.0
Non-interest income 698.1 721.5 566.7 343.6 354.5
Income before operating expenses 2,019.5 2,016.8 1,528.2 995.1 1,024.4
Operating expenses (919.6) (992.5) (748.9) (460.4) (459.2)
Goodwill amortisation (136.5) (131.4) - (68.7) (67.7)
Operating profit 963.5 892.9 779.3 466.0 497.5
Provisions (200.7) (332.4) (46.5) (105.0) (95.8)
Associated and joint venture 26.5 36.5 33.6 12.7 13.7
companies
Net profit before tax 789.2 597.0 766.4 373.8 415.5
Net profit after tax attributable 531.4 369.7 629.5 253.4 278.0 to members (NPAM)
NPAM excluding goodwill 667.9 501.1 629.5 322.1 345.8
amortisation
Profit and Loss
DBSH Group’s operating profit excluding goodwill amortisation increased by 41.1% to S$1,100.0 million in the 1st Half 2002 over the same period in 2001. Financial results of Dao Heng Bank Group Limited (DHG) and DBS Vickers Securities Holdings Pte Ltd (DBSV) were consolidated from June 29, 2001 and September 12, 2001 respectively. The consolidation of these acquisitions had contributed largely to the higher net interest and fee income.
As a result of higher provision charge in 1st Half 2002, NPAM excluding goodwill amortisation increased by a smaller percentage growth of 6.1% to S$667.9 million over 1st Half 2001.
Compared to second half 2001 (2nd Half 2001), operating profit excluding goodwill amortisation increased by 7.4%. Both halves under comparison included the financial results of DHG and DBSV. The 7.4% increase was mainly accounted for by lower operating expenses in 1st Half 2002 compared to 2nd Half 2001. Income before operating expenses remained stable for the 2 halves under comparison.
On a GAAP basis, DBSH Group’s operating profit was S$963.5 million, increase of 23.6% and 7.9% over 1st Half 2001 and 2nd Half 2001 respectively. NPAM was S$531.4 million, a decrease of 15.6% from 1st Half 2001 but an increase of 43.7% over 2nd Half 2001.
Contributions from Dao Heng Bank Group Limited and DBS Vickers Securities Holdings Pte Ltd
Excluding contributions and acquisition-related costs of DHG and DBSV, net profit of the Group would have been S$668.5 million, an increase of 6.2% over the same period last year contributed by higher net interest income and lower operating expenses.
Unaudited Financial Performance Summary For First Half 2002
DBSH
Group Dao Heng Vickers Acquisition
Adjusted DBSH Group
Incr/ (Decr) excluding Acquisition
Effects,
S$'m
1st Half 2002
1st Half 2002
1st Half 2002 1/
Related Costs
1st Half 2002
over 1st Half 2001 1/
Profit and Loss Account (%)
Net interest income 1,321.4 308.8 1.7 (47.9) 1,058.7 10.2
Non-interest income 698.1 105.5 58.0 - 534.6 (6.0)
Income before operating expenses 2,019.5 414.3 59.7 (47.9) 1,593.4 4.4
Operating expenses (919.6) (181.5) (55.6) - (682.5) (9.3)
Goodwill amortisation (136.5) - (2.3) (133.4) (0.8) NM
Operating profit 963.5 232.8 1.8 (181.2) 910.1 16.9
Provisions (200.7) (104.0) 3.5 - (100.3) 114.9
Associated and joint venture 26.5 3.6 (3.3) - 26.2 (21.9)
companies
Net profit before tax 789.2 132.4 2.0 (181.2) 836.0 9.2
Net profit after tax attributable 531.4 63.6 (2.4) (197.4) 667.7 6.1
to members (NPAM)
NPAM excluding goodwill 667.9 63.6 (0.1) (64.0) 668.5 6.2
amortisation
Dao Heng : Dao Heng Bank Group Limited Vickers : DBS Vickers Securities Holdings Pte Ltd
1/ Net of DBS Securities Group’s contribution in 1st Half 2001
NM: Not Meaningful
Exhibit 1
Group Net Interest Income and Net Interest Margin
1 ,4 3 0
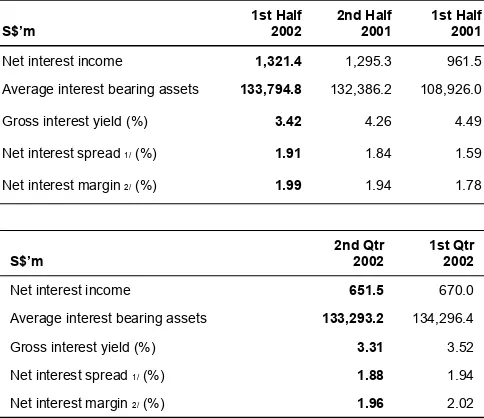
Net Interest Income and Net Interest Margin Net interest income increased by 37.4% to S$1,321.4 million for 1st Half 2002 largely due to the contribution from DHG. Lower Singapore dollar funding costs resulting from re-pricing of non-bank customer deposits also partially accounted for the increase in net interest income. Excluding DHG, DBSV and funding costs incurred for the acquisitions, net interest income was S$1,058.7 million, an increase of 10.2% over 1st Half 2001.
Compared with 1st Qtr 2002, net interest income for 2nd Qtr 2002 was lower due mainly to the strengthening of the Singapore dollar against its Hong Kong counterpart. On constant currency terms, net interest income for 2nd Qtr 2002 would have been in line with 1st Qtr 2002.
Table 1
Group Net Interest Income and Net Interest Margin
S$’m
Net interest income 1,321.4 1,295.3 961.5
Average interest bearing assets 133,794.8 132,386.2 108,926.0
Gross interest yield (%) 3.42 4.26 4.49
Net interest spread 1/ (%) 1.91 1.84 1.59
Net interest income 651.5 670.0
Average interest bearing assets 133,293.2 134,296.4
Gross interest yield (%) 3.31 3.52
Net interest spread 1/ (%) 1.88 1.94
Net interest margin 2/ (%) 1.96 2.02
1/ Net interest spread is the difference between the average interest rate earned on average interest-earning assets and the average interest rate paid on average interest-bearing funds.
2/ Net interest margin is net interest income expressed as a percentage of average interest-earning assets and is annualised.
For 1st Half 2002, net interest margin was 1.99% compared to 1.78% for 1st Half 2001. Excluding acquisition of DHG, net interest margin was lower, at 1.93%. The improved net interest margin for 1st Half 2002 was contributed by lower Singapore dollar funding costs.
Net interest margin weakened to 1.96% in the 2nd Qtr 2002 compared to 2.02% in 1st Qtr 2002; resulting mainly from lower benefit from deployment of excess funds, as interest rates remained low.
Table 2
Non-interest income as a percentage of Operating income (%)
Non-interest income as a percentage
of Operating income (%) 34.6
Non-interest income as a percentage of total operating income for the 1st Half 2002 was 34.6%. Compared to 1st Half 2001, the S$152.1 million increase in fee and commission income was due mainly to the contribution of stockbroking fees of S$55.4 million from DBSV; and credit card and trade finance fees of S$24.7 million and S$15.2 million respectively from DHG.
Excluding acquisitions, fee income of the Group increased by S$11.9 million benefiting from the continued emphasis of the credit card business in Singapore and the sale of wealth management products.
Compared to 1st Qtr 2002, fee and commission income increased by S$17.7 million or 9.2%. The increase was contributed mainly by fees received from syndicated loan and investment banking activities.
Other income decreased by 3.4% due mainly to the inclusion of S$31.2 million profit from the sale of DBS Securities Building and higher Singapore Government Securities’ profit of S$65.3 million in 1st Half 2001.
Other income also decreased by 14.6% from 2nd Half 2001. Profits of S$120.1 million and S$60.6 million from sales of shares in ICS and Keppel Capital were included in 2nd Half 2001.
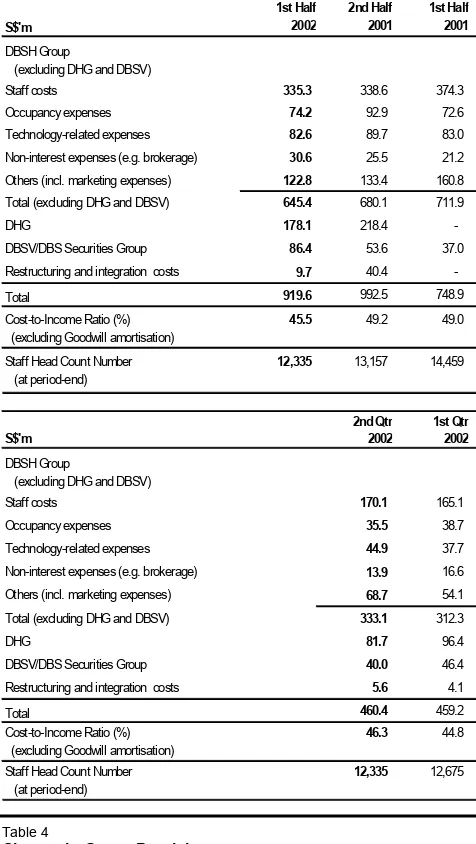
Table 3 (excluding Goodwill amortisation)
Staff Head Count Number 12,335 13,157 14,459
(excluding Goodwill amortisation)
Staff Head Count Number 12,335 12,675
(at period-end)
Operating Expenses
Excluding DHG and DBSV’s operating expenses, restructuring and integration costs and goodwill amortisation, operating expenses declined 9.3% over same period in 2001 and 5.1% from 2nd Half 2001. Compared to 1st Half 2001, staff costs fell S$39.0 million as a result of lower staff bonuses and headcount reduction that arose from rationalisation of workflow and businesses.
Other operating expenses also showed a decrease mainly achieved through effective cost management programs instituted. The successful integration of DHG had also yielded costs synergy that reduced operating expenses.
The Group’s cost-to-income ratio (excluding goodwill amortisation) was 45.5% in the 1st Half 2002 compared with 49.0% for the same period in 2001 and 49.2% for the 2nd Half of 2001.
Compared to 1st Qtr 2002, operating expenses excluding goodwill amortisation, in absolute term remains at almost the same level.
Table 4
Provision charge was S$200.7 million for 1st Half 2002. The charge was mainly due to higher specific loan provision of S$160.9 million, arising largely from uncertain economic conditions and declining collateral values. Out of S$160.9 million loan provision charge, S$39.5 million was for loans booked in DHG. Besides loan provision, valuation shortfall provision of S$80.6 million was also made for properties held by the Group. DHG’s properties accounted for S$69.5 million of the total valuation shortfall provided.
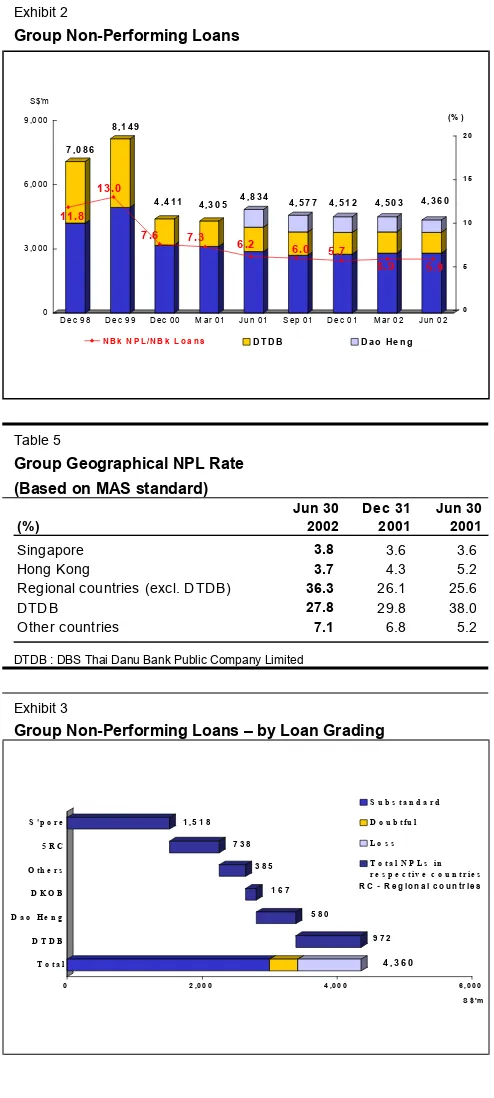
Exhibit 2
DTDB : DBS Thai Danu Bank Public Company Limited
Exhibit 3
Group Non-Performing Loans – by Loan Grading
9 7 2
At end-June 2002, the volume of non-performing loans (NPLs) trended down to S$4.4 billion as compared to S$4.5 billion at end-December 2001. However, overall non-bank loan volume for DBSH Group in the region declined by S$3.7 billion or 5.2% and as a result, the ratio of NPLs to the total non-bank loans (NPL rate) increased by 0.2 percentage points to 5.9%.
Comparing to end-March 2002, the NPL rate remains unchanged at 5.9%.
NPL rate for Hong Kong Operations was 3.7% at end-June 2002. Hong Kong credit card business (which includes Dao Heng Card, Compass Card and DKOB Card) managed loan delinquent rate of 1.01% for 90 days past due and 2.26% for 30 days past due. The net charge-off rate was 10.3% reflecting current economic conditions and a rise in bankruptcy filings.
Of the total S$4,360 million NPLs for 1st Half 2002, 69% were in the substandard category, 9% in the doubtful and the remaining 22% in the loss category.
Exhibit 4
Group Cumulative Specific and General Provisions
0
Cumulative Specific and General Provisions Total cumulative specific and general provisions at end-June 2002 was 129.2% of unsecured NPLs, and 60.4% of total NPLs(or 62.9% of total NPLs of S$4,181 million under US SEC guidelines).
Based on MAS guidelines, Group loan loss reserve coverage for DBS Thai Danu Bank (DTDB)’s NPLs was 70.4%. Based on Bank of Thailand (BOT) new guidelines, the existing loan provision in DTDB’s books is now 150.5% of BOT’s requirement.
Table 6
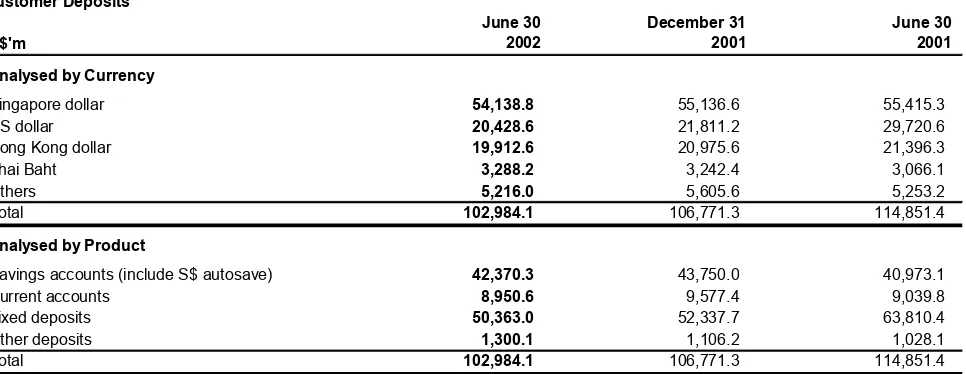
Group Key Balance Sheet Items
S$'m
Total Assets 152,008.9 151,294.3 156,497.0
Customer Loans 64,561.2 68,208.0 69,617.4
Customer Deposits 102,984.1 106,771.3 114,851.4
Loan-to-Deposit Ratio (%) 62.7 63.9 60.6
Balance Sheet
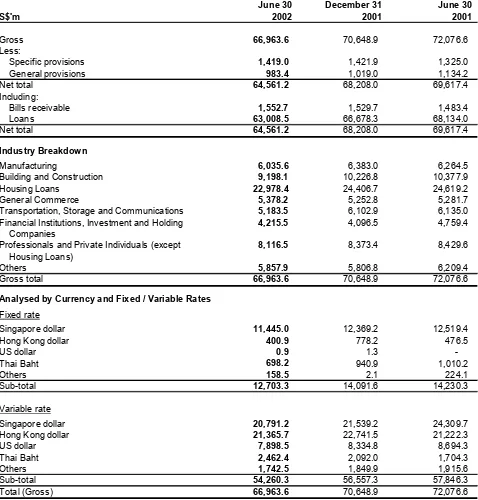
Table 8
Customer Loans
S$'m
June 30 2002
December 31 2001
June 30 2001
Gross 66,963.6 70,648.9 72,076.6
Less:
Specific provisions 1,419.0 1,421.9 1,325.0
General provisions 983.4 1,019.0 1,134.2
Net total 64,561.2 68,208.0 69,617.4
Including:
Bills receivable 1,552.7 1,529.7 1,483.4
Loans 63,008.5 66,678.3 68,134.0
Net total 64,561.2 68,208.0 69,617.4
Industry Breakdown
Manufacturing 6,035.6 6,383.0 6,264.5
Building and Construction 9,198.1 10,226.8 10,377.9
Housing Loans 22,978.4 24,406.7 24,619.2
General Commerce 5,378.2 5,252.8 5,281.7
Transportation, Storage and Communications 5,183.5 6,102.9 6,135.0
Financial Institutions, Investment and Holding 4,215.5 4,096.5 4,759.4
Companies
Professionals and Private Individuals (except 8,116.5 8,373.4 8,429.6
Housing Loans)
Others 5,857.9 5,806.8 6,209.4
Gross total 66,963.6 70,648.9 72,076.6
Analysed by Currency and Fixed / Variable Rates Fixed rate
Singapore dollar 11,445.0 12,369.2 12,519.4
Hong Kong dollar 400.9 778.2 476.5
US dollar 0.9 1.3
-Thai Baht 698.2 940.9 1,010.2
Others 158.5 2.1 224.1
Sub-total 12,703.3 14,091.6 14,230.3
Variable rate
Singapore dollar 20,791.2 21,539.2 24,309.7
Hong Kong dollar 21,365.7 22,741.5 21,222.3
US dollar 7,898.5 8,334.8 8,694.3
Thai Baht 2,462.4 2,092.0 1,704.3
Others 1,742.5 1,849.9 1,915.6
Sub-total 54,260.3 56,557.3 57,846.3
Total (Gross) 66,963.6 70,648.9 72,076.6
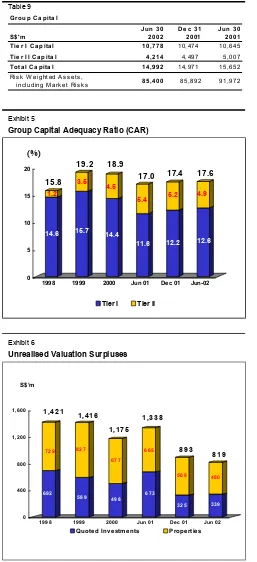
Table 9 Risk W eighted A ssets,
including M ark et Risks 85,400 85,892 91,972
Exhibit 5
Group Capital Adequacy Ratio (CAR)
14.6
Total CAR of DBSH Group, measured according to the Bank of International Settlements (BIS) guidelines was 17.6%, which is more than twice the minimum BIS requirement of 8.0%. The Tier I CAR ratio was 12.6% after deducting goodwill of S$5.2 billion in connection with the acquisitions of DHG and DBSV. The minority interest in DHG and DBSV were excluded from the capital adequacy computations.
For DHG, there are put and call arrangements in place in respect of the DBS Diamond Shares currently held by the minority shareholders. These options are European options, which are exercisable by giving notice within a period of seven business days following December 31, 2002. Should these options be exercised, on a proforma basis at June 30, 2002, without taking into account earnings in the intervening period, the Tier I and total CAR would be 9.2% and 14.4% respectively.
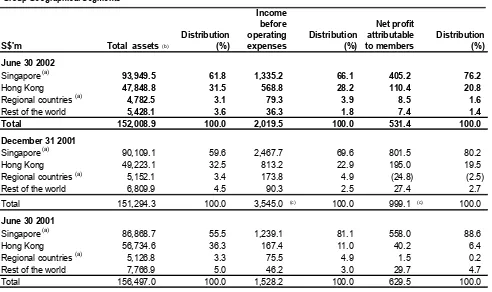
Geographical Segment Analysis
The following tables analyse total assets, income before operating expenses and NPAM by geographical segments. Unless otherwise stated, the analyses of geographical segments are generally based on the location of office recording the transactions.
Table 10
Group Geographical Segments
S$'m Total assets (b)
Distribution (%)
Income before operating expenses
Distribution (%)
Net profit attributable to members
Distribution (%) June 30 2002
Singapore (a) 93,949.5 61.8 1,335.2 66.1 405.2 76.2
Hong Kong 47,848.8 31.5 568.8 28.2 110.4 20.8
Regional countries (a) 4,782.5 3.1 79.3 3.9 8.5 1.6
Rest of the world 5,428.1 3.6 36.3 1.8 7.4 1.4
Total 152,008.9 100.0 2,019.5 100.0 531.4 100.0 December 31 2001
Singapore (a) 90,109.1 59.6 2,467.7 69.6 801.5 80.2
Hong Kong 49,223.1 32.5 813.2 22.9 195.0 19.5
Regional countries (a) 5,152.1 3.4 173.8 4.9 (24.8) (2.5)
Rest of the world 6,809.9 4.5 90.3 2.5 27.4 2.7
Total 151,294.3 100.0 3,545.0 (c) 100.0 999.1 (c) 100.0
June 30 2001
Singapore (a) 86,868.7 55.5 1,239.1 81.1 558.0 88.6
Hong Kong 56,734.6 36.3 167.4 11.0 40.2 6.4
Regional countries (a) 5,126.8 3.3 75.5 4.9 1.5 0.2
Rest of the world 7,766.9 5.0 46.2 3.0 29.7 4.7
Total 156,497.0 100.0 1,528.2 100.0 629.5 100.0
(a) Singapore includes the operations of the Asian Currency Unit. Special general provisions for regional exposure; additional provisions for DTDB's loans and amortisation of goodwill on acquisitions of DHG and DBS Kwong On Bank are booked in Singapore.
(b) Total assets exclude "Life-fund assets attributable to policyholders".
(c) Refers to full year 2001.
DBSH Group operates in four main geographical areas :
• Singapore, the home country of DBSH, which includes all the areas of operations in the primary
business segments.
• “Hong Kong”, which includes branch and subsidiary operations in Hong Kong.
• "Regional countries", which includes branch and subsidiary operations in Malaysia, Indonesia, Thailand, Korea and the Philippines.
• Rest of the world, which are mainly branch operations in China, India, Taiwan, United States, and United Kingdom.
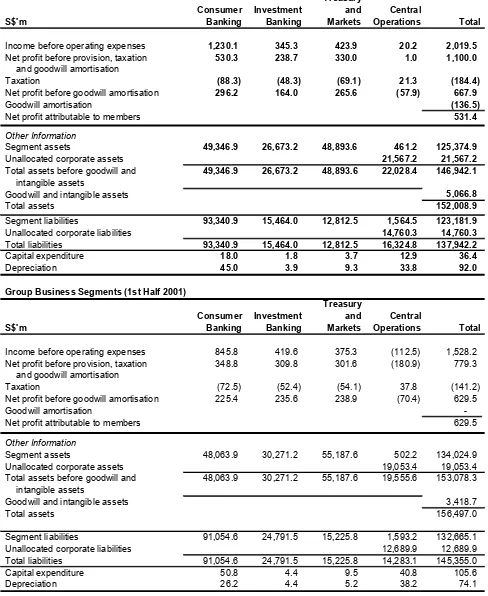
Table 11
Group Business Segments (1st Half 2002)
S$'m
Consumer Banking
Investment Banking
Treasury and Markets
Central
Operations Total
Income before operating expenses 1,230.1 345.3 423.9 20.2 2,019.5
Net profit before provision, taxation 530.3 238.7 330.0 1.0 1,100.0
and goodwill amortisation
Taxation (88.3) (48.3) (69.1) 21.3 (184.4)
Net profit before goodwill amortisation 296.2 164.0 265.6 (57.9) 667.9
Goodwill amortisation (136.5)
Net profit attributable to members 531.4
Other Information
Segment assets 49,346.9 26,673.2 48,893.6 461.2 125,374.9
Unallocated corporate assets 21,567.2 21,567.2
Total assets before goodwill and 49,346.9 26,673.2 48,893.6 22,028.4 146,942.1
intangible assets
Goodwill and intangible assets 5,066.8
Total assets 152,008.9
Segment liabilities 93,340.9 15,464.0 12,812.5 1,564.5 123,181.9
Unallocated corporate liabilities 14,760.3 14,760.3
Total liabilities 93,340.9 15,464.0 12,812.5 16,324.8 137,942.2
Capital expenditure 18.0 1.8 3.7 12.9 36.4
Depreciation 45.0 3.9 9.3 33.8 92.0
Group Business Segments (1st Half 2001)
S$'m
Consumer Banking
Investment Banking
Treasury and Markets
Central
Operations Total
Income before operating expenses 845.8 419.6 375.3 (112.5) 1,528.2
Net profit before provision, taxation 348.8 309.8 301.6 (180.9) 779.3
and goodwill amortisation
Taxation (72.5) (52.4) (54.1) 37.8 (141.2)
Net profit before goodwill amortisation 225.4 235.6 238.9 (70.4) 629.5
Goodwill amortisation
-Net profit attributable to members 629.5
Other Information
Segment assets 48,063.9 30,271.2 55,187.6 502.2 134,024.9
Unallocated corporate assets 19,053.4 19,053.4
Total assets before goodwill and 48,063.9 30,271.2 55,187.6 19,555.6 153,078.3
intangible assets
Goodwill and intangible assets 3,418.7
Total assets 156,497.0
Segment liabilities 91,054.6 24,791.5 15,225.8 1,593.2 132,665.1
Unallocated corporate liabilities 12,689.9 12,689.9
Total liabilities 91,054.6 24,791.5 15,225.8 14,283.1 145,355.0
Capital expenditure 50.8 4.4 9.5 40.8 105.6
Depreciation 26.2 4.4 5.2 38.2 74.1
Business Segment Analysis
The business segmental results represent the customer segments in the respective businesses are determined by:
• Income and expenses directly attributable to each customer segment;
• Management accounting policies relating to the allocation of expenses and funds transfer pricing between the central treasury unit and the customer segments.
The financial statement presents an analysis of the results by classes of business based on the following customer segment groupings:
• Consumer Banking
Consumer Banking focuses on providing products and services to individual customers and small and medium enterprises. The products and services offered to customers include credit facilities (mortgage, trade, personal loans and hire purchase financing, etc.), credit cards, remittance services, deposit collection, stock brokerage and asset management products.
The increase in net profit (S$70.8 million, 31.4%) was attributable to significant increase in income resulting from the acquisition of DHG partially offset by a corresponding increase in expenses and higher provisions.
• Investment Banking
Investment Banking caters to the business needs of large corporate customers and financial institutions. The products and services offered to customers include direct lending, structured financing, advisory banking services, merger and acquisition, debt restructuring advisory services, nominee and trustee services and cash management services.
The decrease in net profit (S$71.6 million, 30.4%) was attributable to decrease in income resulting from lower business volumes and margins.
• Treasury and Markets
Treasury and Markets is involved in trading in treasury related products and services such as foreign exchange and derivatives, money market operations and securities trading. Income from customer business is reflected in the respective customer segments.
The increase in net profit (S$26.7 million, 11.2%) was attributable to higher trading profits mainly from Hong Kong operations.
• Central Operations
Central Operations encompasses a range of activities, with corporate decisions made at the centre and the related income and expenses not attributed to business segments. These include central treasury unit, funding costs of DBSH Group’s associated and subsidiary companies, goodwill and gains/ losses on properties held centrally.
Comparatives