The engaging cover of t his report
represent s t wo int erlocking nat ional birds,
t he Javanese Hawk Eagle and t he Bald
Eagle. The former belongs t o Indonesia and
t he lat t er represent s t he US. Toget her, t hey
depict t he collaborat ion and relat ionship
Amcham Indonesia & The U.S. Chamber of Commerce, 2016 © copyright reserved
AUTHOR
PRIN CIPALRESEARCHER
EDITOR
ASSOCIATE EDITORS
The US- Indonesia Invest ment Report 2016
Dat abase Services Provided by CEIC Dat a Company, Jakart a
Pet er Milne
Muhammad Abduh
A. Lin Neumann
Sarah Howe Arian Ardie John Goyer Mary Silaban
Vit al & Growing:
Adding Up t he US- Indonesia
Economic Relat ionship
Table of
Contents
8
18
24
32
01 The Real Impact of the US–Indonesia
Economic Relationship
The New Big Number
A Brief Met hodology
Recent Trends in t he Indonesia-US Economic Relat ionship
Component s of t he Big Number
How t he Indonesia-US Economic Relat ionship Compares in t he Region
Index
Preface
Key Points
4
5
6
11
11
12
13
16
19
20
21
25
27
28
33
02 Indonesia’s Current Economic Position
and Outlook
Recent Economic Trends in Indonesia
Weakening FDI and St emming t he Out f lows of Capit al
Shif t ing f rom Commodit ies t o Manuf act uring
03 The Government’s Economic Reform
Packages
The Background
Ensuring Implement at ion of t he Ref orms
AmCham’s Recommendat ion and Ref orm Scorecard
04 Looking beyond Our 2014 Baseline
36
46
48
56
Annex I
Annex II
Annex III
110
118
120 47
47
49
51
54
58
66
72
78
82
90
96
100
106
05 Cross-sectoral Analysis and Sector Ranking
06 AmCham’s 2016 Investment
Sentiment Survey
Company Percept ions
The Charact erist ics of US Companies in Indonesia
07 Getting to a Best-Case Scenario
What Is Holding Indonesia Back?
Ideas f or a 21st Cent ury Global Economy
The Big Number and Our Conclusions
08 Analysis of Sectors
Agricult ure
Comsumer Goods
Creat ive Indust ries
Ext ract ive
Finance
Inf ormat ion Communicat ion Technology
Inf rast ruct ure and Power
Oil & Gas
Pharmaceut icals, Healt hcare & Lif e Sciences
3
Index
Tables
Figures
1.1 Top 10 realized FDI by count ry, 2011-2015, ranking f or 2015 ( $ billion)
1.2 The evolut ion of t he f ive component s of t he Big Number, 2010-14
1.3 Comparison of t ot al US economic act ivit ies wit h ASEAN peers, 2010-14 ( Nominal price, $ billion)
1.4 Table E3 Comparison of shares of US economic act ivit ies wit h ASEAN peers, 2010-14 ( Percent )
3.1 Economic Policy Ref orm Packages, Sept ember 2015 – July 2016
3.2 AmCham’s list of indust ry concerns and policy package mat rix scorecard
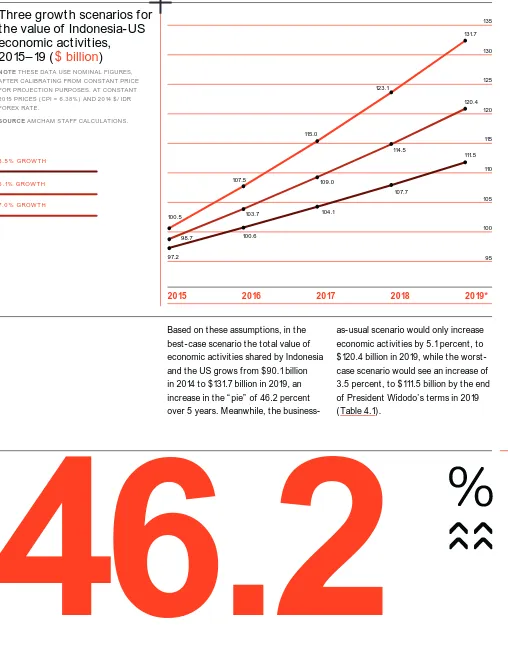
4.1 Values of Indonesia-US economic act ivit ies in t he t hree scenarios, 2015-19 ( $ billion)
5.1 Sect or rankings and best overall sect or f or growt h and invest ment
8.1 Agricult ure
8.2 Consumer Goods
8.3 Creat ive Indust ries
8.4 Ext ract ive
8.5 Finance
8.6 Inf ormat ion Communicat ion Technology
8.7 Inf rast ruct ure and Power
8.8 Oil and Gas
8.9 Revenue split bet ween oil and gas cont ract ors* and t he government , 2011–15 ( $ billion)
8.10 Pharmaceut icals, Healt hcare and Lif e Sciences
Annex 1.1 Trade Dat a Sources
Annex 1.2 Sect or rankings and best overall sect or f or growt h and invest ment
Annex 1.3 Average nominal and percent age discrepancies of sources of BPS dat a 2004–2015 2015
Annex 1.4 FDI dat a classif icat ion met hods used by t he dif f erent agencies
Annex 1.5 Balance of payment s dat a 2011–15
Annex 1.6 Tot al port f olio invest ment Indonesia–US, 2010–15
Annex 3.1 The big number
1.1 A st rong recovery in realized US FDI inf lows int o Indonesia, 2010-14 ( $ Billion)
1.2 Growt h of t ot al economic act ivit ies vs. Indonesia GDP Growt h, 2010-15 ( percent )
1.3 Tot al economic act ivit ies growt h is rapidly out pacing Indonesia’s GDP growt h, 2011-14 ( percent )
1.4 Evolut ion of shares of ASEAN peers’ economic relat ionships wit h t he US, 2010-14 ( Percent )
2.1 Indonesia’s manuf act uring is a shadow of it s f ormer self ( Growt h in GDP and real manuf act uring out put , %)
2.2 Indonesia’s economy has de-indust rialized premat urely ( Manuf act uring as a share of GDP, %)
2.3 Indonesia’s global manuf act uring market share is low and st agnant ( Share in global manuf act uring market , %)
2.4 Rupiah Depreciat ion against t he US dollar 2013-16 ( Rupiah)
3.1 The addressing of AmCham’s indust ry concerns has been slow, 2013-15 ( impact of 50 AmCham recommendat ions on policy)
4.1 Three Growt h Scenarios f or t he value of Indonesia-US economic act ivit ies, 2015-19 ( $ billion)
8.1 Size and growt h of t he agricult ure sect or, 2010-15 ( $ billion, const ant 2010 prices)
8.2 Size and growt h of t he consumer goods sect or, 2010-15 ( $ billion, const ant 2010 prices)
8.3 Size and growt h of t he creat ive indust ries sect or, 2010-15 ( $ billion, const ant 2010 prices)
8.4 Size and growt h of t he ext ract ive ( mining) sect or, 2010-15 ( $ billion, const ant 2010 prices)
8.5 Tot al mining export s and mining revenues, 2012-15 ( $ billion)
8.6 Size and growt h of t he f inance sect or, 2010-15 ( $ billion, const ant 2010 prices)
8.7 Size and growt h of ICT sect or, 2010-15 ( $ billion, const ant 2010 prices)
8.8 Size and growt h of t he inf rast ruct ure and power sect or, 2010–15 ( $ billion, const ant 2010 prices)
8.9 Size and growt h of t he oil and gas sect or, 2010–15 ( $ billion, const ant 2010 prices)
8.10 Size and growt h of t he oil and gas sect or, 2010–15 ( $ billion, const ant 2010 prices)
Annex 1.1 Trade dat a discrepancy bet ween Direct orat e of Trade and Direct orat e of Nat ional Account s, 2010-15 ( $ million)
10 13 16 16 26 29 35 38 58 66 72 78 82 90 96 100 101 106 111 112 113 113 116 117 120
Preface
The US-Indonesia Invest ment Init iat ive is now in it s f ourt h year and is a collaborat ive ef f ort bet ween AmCham Indonesia and t he U.S. Chamberof Commerce in Washingt on, DC. Throughout t he year, companies act ive in t he Init iat ive work closely wit h t he Indonesian government and privat e
sect or leaders t o ident if y ways in which t o improve t he invest ment climat e and achieve our shared object ive of higher economic growt h in Indonesia.
Under t he Init iat ive, our annual Invest ment Summit s have become key
milest ones at which Indonesian of f icials and American companies share ideas in a const ruct ive and mut ually
benef icial manner.
As part of t his work, each year we prepare an Invest ment Report . In 2013,
our f irst report broke new ground by more accurat ely calculat ing t he real level of US company f oreign direct invest ment int o Indonesia. This year,
our f ourt h such report , “ Vit al & Growing: Adding up t he US-Indonesia Economic Relat ionship,” t akes a f resh approach by looking beyond
direct invest ment and calculat ing t he f ull value f or Indonesia of t he t ot al economic relat ionship wit h US companies. The “ big number” we
f ound may surprise readers, and we t hink it will f ocus needed at t ent ion on nurt uring and opening up t he business climat e.
As always, we want t o recognize our Indonesian part ners in t his work. The Indonesian Chamber of Commerce and Indust ry ( KADIN) and t he Employers’
Associat ion of Indonesia ( APINDO) are our key privat e sect or part ners, bot h of which provide counsel, support and guidance on an ongoing basis.
The ot her agency wit h whom we work part icularly closely is t he Indonesian
Invest ment Coordinat ing Board ( BKPM) , which has been a co-sponsor of our Summit s since t he beginning. We great ly value t he int eract ion wit h
BKPM and look f orward t o more joint act ivit ies in t he f ut ure.
This report would not have been possible wit hout t he hard work of bot h t he AmCham and t he U.S. Chamber st af f . Our consult ant Arian Ardie
provides valuable advice and hard work t hroughout t he year on t he Init iat ive and t he Report . We are also grat ef ul t o all t he companies who support t he
Init iat ive and met wit h us t o round out t he dat a and share t heir insight s and recommendat ions f or t he report .
Finally, we of f er a word of heart f elt t hanks t o t he aut hors of t his report , Pet er Milne and Muhammad Abduh.
Pet er marshalled t he resources and wrot e t he report while Abduh dug deep int o t he dat a t o ret urn t he vit al f igures needed t o break new ground.
Our annual Invest ment Summit s
have become key milest ones at
which Indonesian officials and
American companies share ideas
in a const ruct ive and mut ually
beneficial manner.
US–Indonesia Invest ment Report 2016 5
Key
Point s
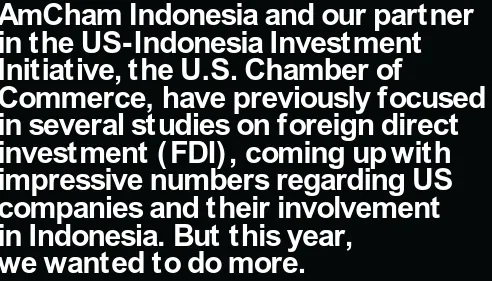
What is t he real value f or Indonesia of it s economic relat ionship wit h t he Unit ed St at es? AmCham Indonesia and our part ner in t he US-Indonesia
Invest ment Init iat ive, t he U.S. Chamber of Commerce, have previously f ocused in several st udies on f oreign direct invest ment ( FDI) , coming up wit h
impressive numbers regarding US companies and t heir involvement in Indonesia. But t his year, we want ed t o do more.
We set out t o t ry and quant if y t he t ot alit y of t he US-Indonesia economic relat ionship, t o include not just FDI, but also t rade, domest ic sales, f inance
and government revenue. Toget her t hese f ive component s equal t he Big Number, which capt ures t he enormous import ance of t he economic
engagement bet ween t hese t wo major powers. Here are some of t he key f indings f rom t he main report .
+ The t ot al value of t he bilat eral economic relat ionship bet ween t he US and Indonesia was
$90.1 billion in 2014.
+ The net t rade adjust ed f igure represent s 10.1 percent of Indonesia’s GDP in 2014.
The Big Number + The compound
annual growt h rat e ( CAGR) f or t he t ot al economic relat ionship
grew at 8.0 percent over 5 years ( 2010-15) , while Indonesia’s GDP growt h over t he
same period was 5.5 percent , indicat ing t he relat ionship is a st rong driver of overall growt h.
+ Domest ic sales make up t he largest component of t he Big Number at $34.1 billion, f ollowed by
bilat eral t rade at $27.6 billion, FDI at $14.7 billion, f inance at $11.8 billion and government revenue
at $1.8 billion.
+ Using t he best case scenario, t he number
could grow t o $131.7 billion by 2019— an increase of 46.2 percent over 5 years.
AmCham Indonesia and our partner
in the US-Indonesia Investment
Initiative, the U.S. Chamber of
Commerce, have previously focused
in several studies on foreign direct
investment ( FDI) , coming up with
impressive numbers regarding US
companies and their involvement
in Indonesia. But this year,
[image:8.595.31.523.512.793.2]Legal Cert aint yis t he f oundat ion f or business conf idence and growt h. Bot h US and Indonesian companies will be able t o invest , grow and creat e jobs if t here is
great er legal cert aint y in t erms of cont ract sanct it y, enf orcement of exist ing laws and an impart ial judiciary.
Collaborat ion and Communicat ionare vit al f or t he creat ion of an enabling economic environment and t he development of rat ional laws and regulat ions. Ef f ect ive communicat ion as economic policies are developed t o make use of t he experience and expert ise of t he privat e sect or will lead t o ef f ect ive policies t o
make Indonesia a world class economy.
Innovat ionis t he key t o keeping pace in a dynamic global economy. Incent ives f or t aking risks, f inding new ways of doing t hings, invest ing in research and development and human resource capacit y building are t he keys t o innovat ion.
Bureaucrat ic and Policy Ref ormmust cont inue and expand. Specif ic examples include t he abolit ion of t he Negat ive Invest ment List ( DNI) , rat ionalizat ion of t he work permit process, st reamlining of permit t ing at all levels of government , and ref orm and proper incent ivizat ion of t he civil service and judiciary.
The Road t o t he Best Case
Economic Sect or Pot ent ial
US Company Sent iment
Achieving t he best -case scenario will depend on act ions t aken by bot h t he
Indonesian and US government s. It is also dependent on ext ernal f act ors t hat cannot necessarily be cont rolled. There are, however, a series of economic
ref orms t hat can be undert aken by t he Indonesian government t hat would
increase t he likelihood of achieving t he best -case scenario. The process
of economic ref orm has already been st art ed by t he Widodo administ rat ion, but will need t o cont inue and expand t o achieve t he desired out come.
These include:
The report also looks at nine indust rial, ext ract ive and service sect ors.
Each one is at a dif f erent st age of development wit h US companies playing dif f erent roles in each. The degree t o which each sect or is
cont rolled by t he government is a main f act or in t he perf ormance of each of t hese sect ors, now and int o t he f ut ure.
Based upon a ranking syst em developed in t he report , several sect ors have a high degree of f ut ure
pot ent ial. These include t he creat ive
economy, f inance and inf rast ruct ure. Several sect ors in which US companies
have a signif icant presence have average prospect s growing apace wit h GDP, such as oil and gas, consumer goods and agricult ure. The f inal
set of sect ors have lower pot ent ial part ly due t o rest rict ive government policies t hat inhibit invest ment and creat e uncert aint y. These include
ext ract ive, pharmaceut ical/ healt hcare/ lif e sciences and inf ormat ion
communicat ions t echnology ( ICT) .
A survey was also t aken and int erviews were conduct ed wit h t he execut ives of US companies bot h in Indonesia and t he US. Here are some of t he f indings:
+ When asked if t he ref orm packages have
had any impact on t heir own businesses, only 25 percent st at ed t hat t hey had “ some impact ,”
while 75 percent st at ed t hat t here was “ no impact ” or t hat it was st ill “ t oo early t o say.”
+ 87 percent f elt t hat t here had been “ some
improvement ” in t he invest ment climat e under t he Widodo administ rat ion;
+ 100 percent st at ed t hat t he 12 economic
ref orm packages had “ some impact ;”
US–Indonesia Invest ment Report 2016 7
1
The Real
Impact of the
US–Indonesia
Economic
Relationship
The f irst AmCham Indonesia/ U.S. Chamber of Commerce1 Invest ment
Report was published in 2013. That report f ocused on FDI and our analysis
revealed t hat real US FDI int o Indonesia was f ar higher t han t he of f icially published f igures. We concluded, conservat ively, t hat f rom 2004 t o
2012, US FDI int o Indonesia t ot aled about $65 billion. This cont rast ed signif icant ly wit h most published dat a and suggest ed t hat t he US, inst ead
of being t he f ourt h-largest invest or in
t he count ry ( at t hat t ime) , was likely t he largest invest or in Indonesia. More narrowly def ined of f icial f igures f rom Bank Indonesia showed US FDI f or t he
same period as being just over a palt ry $7 billion.
Moreover, back in 2013, our f indings indicat ed t hat 95 percent of t ot al US FDI int o Indonesia was in t he oil and gas, mining and manuf act uring sect ors
and, while t he oil and gas and mining indust ries were by f ar t he largest
US–Indonesia Invest ment Report 2016 9
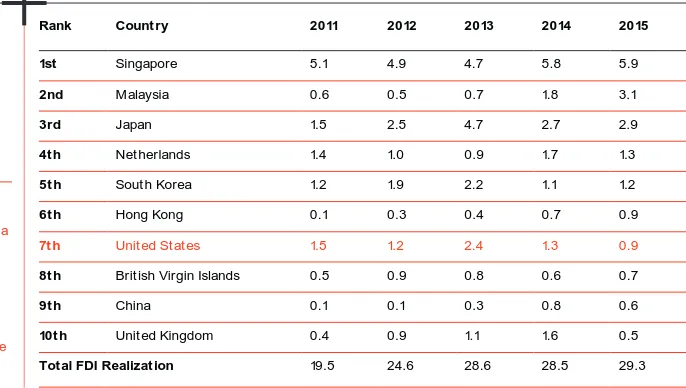
Top 10 realized FDI by
count ry, 2011–15, ranking
f or 2015 (
$ billion
)
SOURCE BKPM ( CEIC) .
T ABLE 1. 1
Rank Count ry 2011 2012 2013 2014 2015
1st Singapore 5.1 4.9 4.7 5.8 5.9
2nd Malaysia 0.6 0.5 0.7 1.8 3.1
3rd Japan 1.5 2.5 4.7 2.7 2.9
4t h Net herlands 1.4 1.0 0.9 1.7 1.3
5t h Sout h Korea 1.2 1.9 2.2 1.1 1.2
6t h Hong Kong 0.1 0.3 0.4 0.7 0.9
7t h Unit ed St at es 1.5 1.2 2.4 1.3 0.9
8t h Brit ish Virgin Islands 0.5 0.9 0.8 0.6 0.7
9t h China 0.1 0.1 0.3 0.8 0.6
10t h Unit ed Kingdom 0.4 0.9 1.1 1.6 0.5
Tot al FDI Realizat ion 19.5 24.6 28.6 28.5 29.3
1 American Chamber of Commerce in Indonesia ( AmCham) and t he U.S. Chamber of Commerce have joint ly produced t he past t hree US-Indonesia Invest ment Report s ( 2013-15) and t his current edit ion.
2 BKPM def ines US direct invest ment abroad as t he ownership or cont rol, direct or indirect , by one US cit izen of 10 percent or more of t he vot ing securit ies if t he f oreign business ent erprise is incorporat ed, or an equivalent int erest if t he f oreign business ent erprise is unincorporat ed.
FDI is a fickle indicator for measuring the true value
of an economic relationship. It can fluctuate widely
depending on economic conditions. This is what led
us this year to think about the importance of the US
economic relationship with Indonesia in a new and
maybe unique way.
FDI sect ors f or US companies, t he manuf act uring sect or was increasing in prominence at t hat t ime.
However, t he world is a very dif f erent place t oday t han it was in 2013. Af t er weat hering t he f irst f ew years af t er t he 2008 global f inancial crisis remarkably well, largely due t o t he commodit ies boom, t he Indonesian economy has been gradually dragged down by t he collapse in commodit y prices since 2012 and t he economic slowdown in China. This has been compounded by t he local currency f alling more t han 27percent since 2013, and t he higher perceived risks of invest ing in emerging market s globally. Meanwhile, previously robust FDI by US companies in t he oil and gas and mining indust ries t ook a major hit , wit h all f irms cut t ing back invest ment and explorat ion, and some f irms even deciding t o pull out of t he count ry.
If we were t o look at US FDI in t he light of t he current economic environment , while it is recovering well, it no longer
t ells such an impressive st ory. Based on US Depart ment of Commerce dat a, in 2014 ( t he lat est available year) , realized US FDI int o Indonesia rose t o $13.5 billion, up f rom $11.3 billion in 2013, a 20 percent increase. Dat a f rom t he Indonesia Invest ment Coordinat ing Board ( BKPM) , however, show f ar lower US numbers. BKPM indicat es t hat realized FDI f or 2015 made Singapore t he leading invest or ( $5.9 billion) , f ollowed by Malaysia ( $3.1 billion) , Japan ( $2.9 billion) , t he Net herlands ( $1.3 billion) and Sout h Korea ( $1.2 billion) .2 The US in cont rast
is said t o be t he sevent h-largest invest or, at just $0.9 billion in 2015.
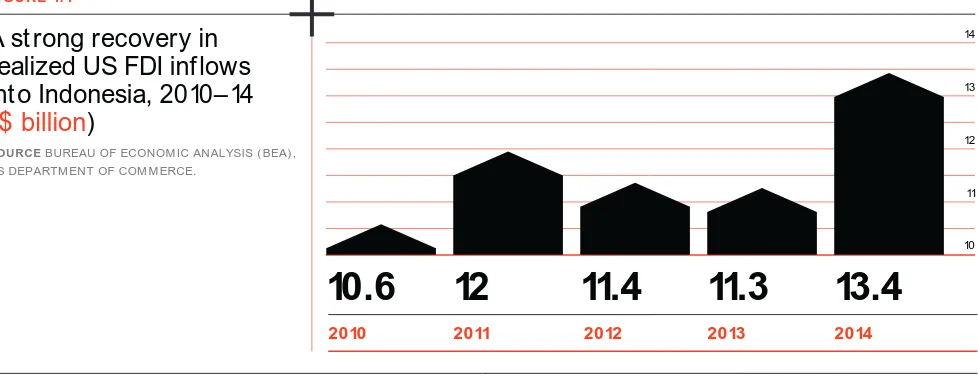
[image:12.595.180.523.591.785.2]Based on more complet e US Depart ment of Commerce dat a f or US realized FDI int o Indonesia, Figure 1.1 below shows a very dif f erent st ory, however. While we see a clear slowdown in invest ment in t he wake of t he global f inancial crisis f rom 2011 t hrough t o 2013, realized FDI rebounded st rongly in 2014. While
admit t edly we cannot compare t he US Depart ment of Commerce dat a f or US realized FDI direct ly wit h t he dat a f rom BKPM f or ot her count ries’ FDI, t he US Depart ment of Commerce dat a do nonet heless st rongly suggest t hat t he US is by f ar t he largest f oreign invest or in Indonesia— and not just in 2014, but f or several years going back in t ime.
A st rong recovery in
realized US FDI inf lows
int o Indonesia, 2010–14
(
$ billion
)
SOURCE BUREAU OF ECONOM IC ANALYSIS ( BEA) , US DEPARTM ENT OF COM M ERCE.
F I GU R E 1. 1
10.6
12
11.4
11.3
13.4
2010 2011 2012 2013 2014
14
13
12
11
10
The New Big Number
We t ook a new approach in researching and developing t his 2016 Invest ment Report . Inst ead of f ocusing purely on FDI – a relat ively unpredict able and f ar f rom complet e indicat or of t he t rue import ance of t he Indonesia-US economic relat ionship – we t ried t o be more ambit ious. In analyzing t he available dat a, we f ocused on a wide-ranging series of engagement s t hat go f ar beyond t he boundaries of t radit ional FDI t o encompass f inancial services, domest ic sales, government revenues, t rade and FDI. As such, our aim in t his year’s report is t o capt ure, as best we can, t he ent ire universe of economic act ivit ies t hat are shared bet ween t he US and Indonesia. In a nut shell, using our analysis based on t he complet e range of economic act ivit ies involved in t he relat ionship bet ween t he t wo count ries, we came up wit h a st aggering f igure: in 2014, our baseline year, t he t ot al value of all economic act ivit ies shared by Indonesia and t he US amount ed t o $90.1 billion. As a share of Indonesia’s t ot al GDP in 2014, t his amount s t o about 10.1 percent of t he size of t he Indonesian economy.
A Brief M et hodology
Here we should digress brief ly t o explain t he met hodology behind t hese numbers, wit hout going int o t oo much det ail. The f ull met hodology can be f ound in Annex I of t he main report . What does t his number comprise, in addit ion t o FDI? Basically, t here are f ive major component s in t his Big Number. Realizing t hat FDI is just one part of a great er whole, we t ried t o capt ure f our ot her areas of economic act ivit y t hat are just as import ant , indeed somet imes f ar more import ant , t han FDI. The f ive component s are: ( i) t he sum of t rade bet ween t he t wo count ries, including import s and export s in bot h direct ions; ( ii) t he sum of f inancial f lows bet ween t he t wo count ries; ( iii) t he sum of domest ic sales by US companies in Indonesia, and Indonesian companies in t he US; ( iv) government revenues derived f rom t he operat ions of US companies in Indonesia ( however, t his relies only on VAT revenue, given dat a availabilit y issues) , and f inally ( v) t he sum of realized FDI, not just of US companies in Indonesia, but also of Indonesian companies in t he US. Given t he unavailabilit y of suf f icient dat a 3 Def init ion of US companies: In our broad
def init ion of US companies wit h economic act ivit ies in Indonesia, we include all t hose companies t hat are owned by holding companies regist ered in t he US wit h t he address of principal execut ive of f ices as being in t he US. This also applies in t hose cases where operat ing of f ices may be locat ed overseas and all t heir subsidiaries, and af f iliat es and t heir licensees are engaged in business act ivit ies in market s out side t he US.
11
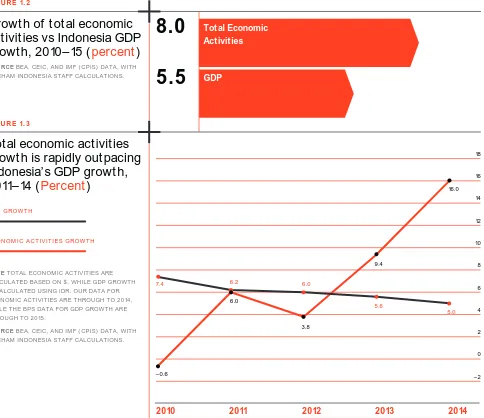
[image:13.595.77.566.170.358.2]Growt h of t ot al economic
act ivit ies vs Indonesia GDP
growt h, 2010–15 (
percent
)
SOURCE BEA, CEIC, AND IM F ( CPIS) DATA, WITH AM CHAM INDONESIA STAFF CALCULATIONS.Tot al economic act ivit ies
growt h is rapidly out pacing
Indonesia’s GDP growt h,
2011–14 (
Percent
)
F I GU R E 1. 2
F I GU R E 1. 3
Tot al Economic
Act ivit ies
8.0
5.5
GDP2010 2011 2012 2013 2014
18 16 14 12 10 8 6 4 2 0 –2 –0.6
7.4 6.2 6.0
5.6 5.0 6.0 3.8 9.4 16.0
N OTE TOTAL ECONOM IC ACTIVITIES ARE CALCULATED BASED ON $ , WHILE GDP GROWTH IS CALCULATED USING IDR. OUR DATA FOR ECONOM IC ACTIVITIES ARE THROUGH TO 2014, WHILE THE BPS DATA FOR GDP GROWTH ARE THROUGH TO 2015.
SOURCE BEA, CEIC, AND IM F ( CPIS) DATA, WITH AM CHAM INDONESIA STAFF CALCULATIONS.
GDP GROW T H
ECON OM IC ACT IVIT IES GROW T H
f or 2015, we have chosen 2014 as our base year, f or which t ot al economic act ivit ies amount t o $90.1 billion. This t ot al f igure t hen needs t o be adapt ed in order t o make it met hodologically compat ible wit h Indonesia’s GDP f igure, as we need t o convert t he various sums ( of t rade, FDI, f inance and sales) int o balance f igures. These balances when t ot aled t hen allow us t o compare like f or like, which indicat es t hat t he value of economic act ivit ies is equivalent t o 10.1 percent of GDP f or 2014. Due t o t he lack of all necessary dat a in 2014, f igures f or sales and government revenue are ext rapolat ed f rom 2013.
Recent Trends in t he Indonesia- US Economic Relat ionship
Once we have our f ormula f or calculat ing t ot al economic act ivit ies
bet ween Indonesia and t he US, we can also calculat e t he value of t ot al economic act ivit ies f or previous years. This allows us t o see if t here are any t rends in t he nominal value of economic act ivit ies varies over t ime, and compare t hese t rends wit h Indonesia’s GDP growt h, as well as how const ant (or not ) t he size of Indonesia-US economic act ivit ies are as a share of Indonesia’s annual GDP by year. The nominal value of economic act ivit ies has been increasing rapidly since 2010, while t he annual equivalent share of Indonesia-US economic act ivit ies in Indonesia’s GDP has remained more or less f ixed wit hin t he range of 8.8 t o 10.1 percent . The average annual growt h rat e of t he nominal value of economic act ivit ies is also compared wit h Indonesia’s annual average GDP growt h over t he same period (Figure 1.2). The compound
annual growt h rat e (CAGR) f or t ot al economic act ivit ies bet ween t he t wo count ries is 8.0 percent in t he period 2010-15, while t he CAGR of Indonesia’s GDP over the same period is 5.5 percent .
When seen as a t imeline f rom 2010 t o 2014 ( Figure 1.3) , it would appear t hat , while t here was a decline in 2011-12, Indonesia-US economic act ivit ies are growing robust ly, while t he Indonesian GDP remains below expect at ions . However, given t heir relat ive size, Indonesia-US economic act ivit ies alone can only have a limit ed impact on support ing overall Indonesian GDP growt h: a 10 percent increase in t he size of t he economic relat ionship will only increase Indonesia’s GDP by 1 percent .
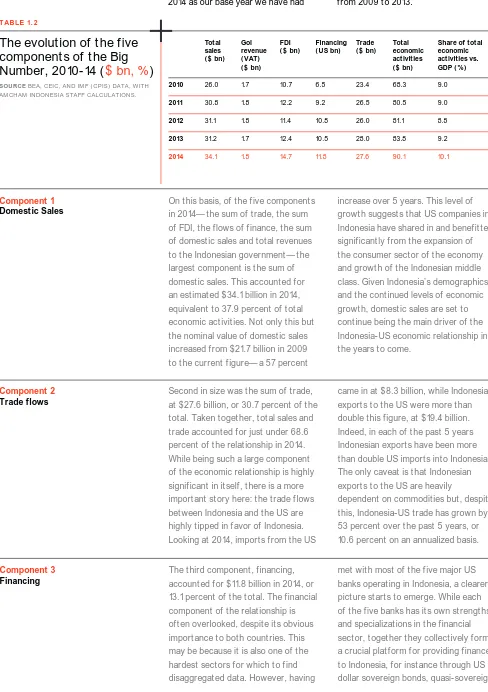
[image:14.595.43.527.366.784.2]Component s of t he Big Number It is usef ul t o look in more det ail int o how t he f ive component s of t he $90.1 billion number compare. However, we should not e t hat by select ing 2014 as our base year we have had
t o use est imat es f or t wo of t he f ive component s, namely domest ic sales and t he t ot al government revenues in Indonesia. These t wo f igures are ext rapolat ed f rom t he dat a available f rom 2009 t o 2013.
The evolut ion of t he f ive
component s of t he Big
Number, 2010-14 (
$ bn, %
)
SOURCE BEA, CEIC, AND IM F ( CPIS) DATA, WITH AM CHAM INDONESIA STAFF CALCULATIONS.T ABLE 1. 2
Tot al sales ( $ bn)
GoI revenue ( VAT) ( $ bn)
FDI ( $ bn)
Financing ( US bn)
Trade ( $ bn)
Tot al economic act ivit ies ( $ bn)
Share of t ot al economic act ivit ies vs. GDP ( %)
2010 26.0 1.7 10.7 6.5 23.4 68.3 9.0
2011 30.8 1.8 12.2 9.2 26.5 80.5 9.0
2012 31.1 1.8 11.4 10.8 26.0 81.1 8.8
2013 31.2 1.7 12.4 10.5 28.0 83.8 9.2
2014 34.1 1.8 14.7 11.8 27.6 90.1 10.1
Component 1
Domest ic Sales
Component 2
Trade flows
Component 3
Financing
On t his basis, of t he f ive component s in 2014— t he sum of t rade, t he sum of FDI, t he f lows of f inance, t he sum of domest ic sales and t ot al revenues t o t he Indonesian government — t he largest component is t he sum of domest ic sales. This account ed f or an est imat ed $34.1 billion in 2014, equivalent t o 37.9 percent of t ot al economic act ivit ies. Not only t his but t he nominal value of domest ic sales increased f rom $21.7 billion in 2009 t o t he current f igure— a 57 percent
increase over 5 years. This level of growt h suggest s t hat US companies in Indonesia have shared in and benef it t ed signif icant ly f rom t he expansion of t he consumer sect or of t he economy and growt h of t he Indonesian middle class. Given Indonesia’s demographics and t he cont inued levels of economic growt h, domest ic sales are set t o cont inue being t he main driver of t he Indonesia-US economic relat ionship in t he years t o come.
Second in size was t he sum of t rade, at $27.6 billion, or 30.7 percent of t he t ot al. Taken t oget her, t ot al sales and t rade account ed f or just under 68.6 percent of t he relat ionship in 2014. While being such a large component of t he economic relat ionship is highly signif icant in it self , t here is a more import ant st ory here: t he t rade f lows bet ween Indonesia and t he US are highly t ipped in f avor of Indonesia. Looking at 2014, import s f rom t he US
came in at $8.3 billion, while Indonesian export s t o t he US were more t han double t his f igure, at $19.4 billion. Indeed, in each of t he past 5 years Indonesian export s have been more t han double US import s int o Indonesia. The only caveat is t hat Indonesian export s t o t he US are heavily
dependent on commodit ies but , despit e t his, Indonesia-US t rade has grown by 53 percent over t he past 5 years, or 10.6 percent on an annualized basis.
The t hird component , f inancing, account ed f or $11.8 billion in 2014, or 13.1 percent of t he t ot al. The f inancial component of t he relat ionship is of t en overlooked, despit e it s obvious import ance t o bot h count ries. This may be because it is also one of t he hardest sect ors f or which t o f ind disaggregat ed dat a. However, having
met wit h most of t he f ive major US banks operat ing in Indonesia, a clearer pict ure st art s t o emerge. While each of t he f ive banks has it s own st rengt hs and specializat ions in t he f inancial sect or, t oget her t hey collect ively f orm a crucial plat f orm f or providing f inance t o Indonesia, f or inst ance t hrough US dollar sovereign bonds, quasi-sovereign
13
[image:15.595.72.560.99.791.2]Component 4
FDI
bonds ( t o st at e-owned ent erprises) and t o t he privat e sect or. Looking at t he past 2 years, US banks have been involved in roughly 60 t o 75 percent of all US dollar bond issuances in Indonesia, which have raised about $25 billion in bond f inancing f rom 2014 t o May 2016. In t erms of t he US dollar debt market , growt h was
about 86 percent in t he period 2019-14, or an impressive 17 percent on an annualized basis. Meanwhile, US banks in Indonesia also const it ut e some of t he largest t raders of equit ies in t he domest ic st ock market , t oget her wit h being major players in mergers and acquisit ions ( M& A) .
The f ourt h component is FDI, at $14.7 billion, or 16.3 percent of t he relat ionship in 2014. FDI is t he f igure most of t en cit ed as a measure of t he economic relat ionship, but it only ranks f ourt h out of our f ive major component s. While it is undoubt edly t rue t hat invest ment policy ref orm of t en drives t he broader ref orm agenda, ot her component s act ually cont ribut e more t o t he t ot al
Indonesia-US economic relat ionship. FDI can also be volat ile, proof of which can be seen in t he f act t hat it is t he only one of our component s t hat declined due t o t he global economic crisis, f rom 2011 t o 2012. That decline not wit hst anding, t ot al FDI ( including Indonesian FDI in t he US) increased by 47 percent during t he period, f rom $10 billion in 2009 t o $14.7 billion in 2014, an average annualized increase of 9.4 percent .
Component 5
Government Revenues
The smallest cont ribut ion t o t he relat ionship is Indonesian government revenues, which account ed f or an est imat ed $1.8 billion, or just 2 percent of t he t ot al. Unf ort unat ely, t he unavailabilit y of dat a means t hat t his component is great ly underst at ed, as we only have complet e dat a on value-added t ax ( PPN) , but not on non-t ax revenue ( NTR) , including royalt ies on raw mat erials and excise on t obacco. However, even just t aking VAT revenue int o account , US companies st ill cont ribut ed 13 percent of t ot al government t ax revenue of $13.24 billion in 2014.
While t he smallest of our f ive component s, it is nonet heless vit al t o t he government of Indonesia. It is wort h remembering t hat f or many years US companies also have been Indonesia’s largest cont ribut or t o government revenue, alt hough t hey are not necessarily t he largest companies operat ing in Indonesia. For example, in recent years PT. Freeport Indonesia was t he largest cont ribut or t o goverment revenues unt il t he collapse in commodit ies prices and t he implement at ion of t he export ban on mineral ore, af t er which
it s dominant posit ion has been t aken over by PT. HM Sampoerna, anot her US company. ( Not e, bot h companies owe t heir prominent posit ion not t o VAT, but more t o NTR in t he f orm of royalt ies and excise, respect ively, in addit ion t o regular corporat e income t ax.) Ot her major cont ribut ors t o NTR government revenues are in t he oil and gas sect or, including Chevron, ExxonMobil and ConocoPhillips. It is wort h not ing t hat despit e t he current low oil price environment , which has caused government revenue t o plummet by around 43 percent ,5 t he
oil and gas sect or st ill plays a vit al role in support ing regional development , including t hrough t he development of t he oil and gas support services sect or, which provides import ant mult iplier ef f ect s. Furt hermore, Indonesia’s product ion share f rom oil and gas is generally regarded as t he second highest in t he world. From t he US company f igures t hat we do have access t o, it is saf e t o say t hat NTR t o t he government was at t he very least around $4.7 billion in 2014. This would boost our sect oral Big Number f or government revenue f rom US companies by 3.6 t imes.
It is worth remembering that for many
years US companies have been Indonesia’s
largest contributor to government revenue,
although they are not necessarily the
largest companies operating in Indonesia.
By way of comparison, looking back at 2009, at t he st art of t he global f inancial crisis, t he shares of t he f ive component s were relat ively similar t o 2014. Tot al economic act ivit ies in 2009 were valued at just shy of $57.4 billion, implying a 56.8 percent increase in t he period 2009 t o 2014. The main except ion is t hat t he share of f inancial f lows was signif icant ly lower, at just
10.96 percent compared wit h 13.05 percent in 2014. This would have almost cert ainly been due t o t he impact of t he global economic crisis at t hat t ime. In t he ot her f our component s, t he shares in 2009 were 37.83 percent f or t ot al sales, 31.41 percent f or t he sum of t rade, 17.4 percent f or t he sum of FDI, and 2.4 percent f or t ot al revenues t o t he Indonesian government .
5 2016 Oil and Gas Product ion in Indonesia ( BOEPD) : Chevron 251,000; ConocoPhillips: 241,000; and ExxonMobil: 170,000 ( Source: WoodMackenzie: SKK Migas) .
15
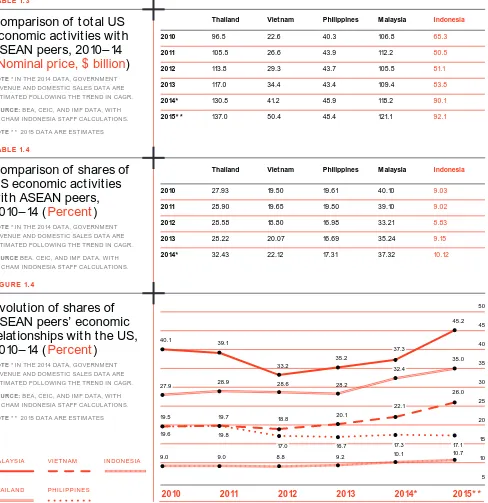
Comparison of t ot al US
economic act ivit ies wit h
ASEAN peers, 2010–14
(
Nominal price, $ billion
)
N OTE * IN THE 2014 DATA, GOVERNM ENT REVENUE AND DOM ESTIC SALES DATA ARE ESTIM ATED FOLLOWING THE TREND IN CAGR.SOURCE: BEA, CEIC, AND IM F DATA, WITH AM CHAM INDONESIA STAFF CALCULATIONS.
N OTE * * 2015 DATA ARE ESTIM ATES
Comparison of shares of
US economic act ivit ies
wit h ASEAN peers,
2010–14 (
Percent
)
N OTE * IN THE 2014 DATA, GOVERNM ENT REVENUE AND DOM ESTIC SALES DATA ARE ESTIM ATED FOLLOWING THE TREND IN CAGR.SOURCE BEA, CEIC, AND IM F DATA, WITH AM CHAM INDONESIA STAFF CALCULATIONS.
Evolut ion of shares of
ASEAN peers’ economic
relat ionships wit h t he US,
2010–14 (
Percent
)
N OTE * IN THE 2014 DATA, GOVERNM ENT REVENUE AND DOM ESTIC SALES DATA ARE ESTIM ATED FOLLOWING THE TREND IN CAGR.
SOURCE: BEA, CEIC, AND IM F DATA, WITH AM CHAM INDONESIA STAFF CALCULATIONS.
N OTE * * 2015 DATA ARE ESTIM ATES
T ABLE 1. 3
T ABLE 1. 4
F I GU R E 1. 4
Thailand Viet nam Philippines M alaysia Indonesia
2010 96.5 22.6 40.3 106.8 68.3
2011 105.5 26.6 43.9 112.2 80.5
2012 113.8 29.3 43.7 105.5 81.1
2013 117.0 34.4 43.4 109.4 83.8
2014* 130.8 41.2 48.9 118.2 90.1
2015* * 137.0 50.4 48.4 121.1 92.1
Thailand Viet nam Philippines M alaysia Indonesia
2010 27.93 19.50 19.61 40.10 9.03
2011 28.90 19.65 19.80 39.10 9.02
2012 28.58 18.80 16.98 33.21 8.83
2013 28.22 20.07 16.69 35.24 9.15
2014* 32.43 22.12 17.31 37.32 10.12
2010 2011 2012 2013 2014* 2015* *
50 45 40 35 30 25 20 15 10 5 M AL AYSIA
T H AIL AN D
VIET N AM
P H IL IP P IN ES
IN DON ESIA 40.1
27.9
19.5
19.6
9.0 9.0 8.8 9.2 10.1 10.7
19.8
17.0 16.7 17.3 17.1
19.7 18.8 20.1
28.9 28.6 28.2
32.4 22.1 26.0 35.0 39.1 33.2 35.2 37.3 45.2 How t he Indonesia- US Economic
Relat ionship Compares in t he Region We are not limit ed t o looking at Indonesia only in t erms of economic act ivit ies wit h t he US. We can also look at t he value of t he economic relat ionship bet ween t he US and ot her count ries in ASEAN, f or inst ance. Here, using t he same f ormula and dif f erent sources of dat a, we can see t he nominal values relat ive t o t he size of t he respect ive ASEAN economies ( Table 1.3) .
Table 1.4 t hen shows t hese nominal values convert ed int o percent age shares of t ot al US economic act ivit ies against GDP f or each respect ive year.
[image:18.595.39.527.283.786.2]Indonesia’s posit ion in t erms of t he value of it s t ot al economic act ivit ies wit h t he US compared wit h it s ASEAN peers is probably about where it should be— not t oo high and not t oo low, and also relat ively st able over t he f year period. In our f ive-count ry sample, t he nominal value of t he economic relat ionship bet ween Indonesia and t he US lies sandwiched bet ween Malaysia and Thailand wit h t he highest values, and t he Philippines and Viet nam, wit h t he lowest . While it is t rue t o say t hat growing t he size of t he economy is what is most import ant here, t he f act t hat in some count ries t he value of t heir economic act ivit ies wit h t he US is growing f ast er t han ot hers may indicat e t hat t hese count ries are more open and at t ract ive t o US economic act ivit ies.
While no one really knows what an opt imal share of GDP should be in a count ry’s economic relat ionship wit h t he US, t his is not t he most import ant issue. Far more import ant is t hat t he size of t he economic “ pie” — i.e., t he nominal t ot al value of economic act ivit ies— is growing on an annual basis. If t his growt h is indeed occurring, while t he share of t he value of economic act ivit ies in GDP remains more or less const ant , it inf ers t hat all economic relat ionships wit h a count ry are growing t oget her and mut ually benef it ing each ot her. This, af t er all, is t he ult imat e goal.
Indonesia’s position in
terms of the value of its
total economic activities
with the US compared with
its ASEAN peers is probably
about where it should be–
not too high and not too low,
and also relatively stable
over the five-year period.
17
2
Indonesia’s
Current
Economic
Position and
Outlook
Recent Economic Trends in Indonesia The Indonesian economy has been st ruggling t o maint ain growt h since 2012 in t he f ace of lower commodit y prices and slower global growt h.
Despit e t he recent slowdown, however, t he count ry’s per capit a GDP has grown st eadily f rom $560 in 2000 t o $3,630 in 2014. Wit h Indonesia’s export
revenues cont ract ing t hroughout 2015, GDP growt h slipped t o 4.8 percent . While st ill respect able, especially f or a
commodit ies export er, Indonesia will
st ruggle t o absorb new ent rant s int o t he count ry’s labor f orce at t his rat e of growt h. Going f orward, Indonesia will need t o adapt t o a less f avorable global
environment and f ocus even more on f acilit at ing invest ment and reducing t he cost s of doing business.
The f iscal st imulus provided by t he government , aided by addit ional f unds coming f rom t he shif t in public
US–Indonesia Invest ment Report 2016 19
expendit ure away f rom wast ef ul f uel subsidies, will undoubt edly help t o support economic expansion. There was, f or inst ance, a t hreef old increase in inf rast ruct ure spending in t he f irst quart er of 2016, t oget her wit h a 10-f old spike in physical const ruct ion f or t he same quart er. However, government act ivit y alone will not raise growt h above 5 percent in 2016. The only way t o ensure t hat growt h rebounds will be t hrough great er privat e sect or act ivit y, especially t hrough privat e sect or invest ment . This is where US companies can play an import ant role — especially in generat ing new jobs.
Driven mainly by t he increase in public spending at t he end of t he year, growt h did pick up in t he f inal quart er of 2015 t o 5 percent year-on-year, af t er t hree previous quart ers of 4.7 percent growt h. However, at t he same t ime consumpt ion remained moderat e, while export s and import s bot h cont inued t o decline, highlight ing t he challenges f aced by t he privat e sect or. Worryingly, t he biggest cont ribut or t o t he overall decline in t he t rade balance came f rom a cont ract ion in manuf act uring export s, which f ell by 13.4 percent year-on-year.
Weakening FDI and St emming t he Out flows of Capit al
Indonesia also experienced a signif icant decline in it s f inancial account in 2015, as capit al f led emerging market s generally. Tot al 2015 capit al f lows t o
Indonesia declined t o just $17.1 billion in 2015, down f rom $45 billion in 2014. The out f lows of capit al f rom Indonesia were only st emmed by f oreign
invest ment int o Indonesian government bonds t oward t he end of 2015, helping t o st abilize t he rupiah at 4.4 percent in February. Most of t hese invest ment s f lowed t hrough US invest ment banks in Indonesia. A st ronger rupiah and lower inf lat ion helped Bank Indonesia t o f inally st art easing it s monet ary policy in January wit h t wo consecut ive cut s in int erest rat es of 25 basis point s each. However, as we have seen in t he past f ew mont hs, BI will need t o remain vigilant amid cont inuing global f inancial market volat ilit y and t he possibilit y of rising US int erest rat es put t ing pressure on t he rupiah.
Both Indonesian and US private
sector companies need to move
away from an over-reliance on
Indonesian commodities in the
wake of one of the greatest
commodity booms ever seen,
from 2003 to 2012
Shift ing from Commodit ies t o M anufact uring
Bot h Indonesian and US privat e sect or companies need t o move away f rom an over-reliance on Indonesian commodit ies in t he wake of one of t he great est commodit y booms ever seen, f rom 2003-2012. One side-ef f ect of t he commodit ies boom was t hat it rendered invest ing in t he Indonesian manuf act uring sect or less at t ract ive t o invest ors when easy ret urns could be made in commodit ies wit h lit t le or no valued-added. Given
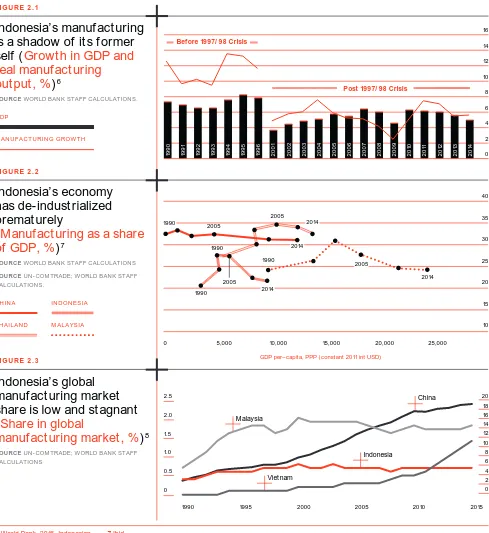
t hat manuf act uring t ends t o be highly labor-int ensive and t he ext ract ive indust ries just t he opposit e, it should come as lit t le surprise t hat while Indonesia comprises half of ASEAN’s t ot al labor f orce it cont ribut es only 16 percent of ASEAN’s manuf act uring export s. In f act , looking more closely at dat a f rom t he World Bank, Indonesia underwent a process of “ premat ure deindust rializat ion” f rom about 2002 onwards, as commodit ies overt ook manuf act uring as t he largest export s f rom 2005 onward.
2 1
Indonesia’s manuf act uring
is a shadow of it s f ormer
self (
Growt h in GDP and
real manuf act uring
out put , %
)
6SOURCE WORLD BANK STAFF CALCULATIONS.
Indonesia’s economy
has de-indust rialized
premat urely
(
Manuf act uring as a share
of GDP, %
)
7SOURCE WORLD BANK STAFF CALCULATIONS
SOURCE UN- COM TRADE; WORLD BANK STAFF CALCULATIONS.
Indonesia’s global
manuf act uring market
share is low and st agnant
(
Share in global
manuf act uring market , %
)
8 SOURCE UN- COM TRADE; WORLD BANK STAFF CALCULATIONSF I GU R E 2 . 1
F I GU R E 2 . 2
F I GU R E 2 . 3
16 14 12 10 8 6 4 2 0 40 35 30 25 20 15 10 20 18 16 14 12 10 8 6 4 2 0 2.5 2.0 1.5 1.0 0.5 0 0 5,000 1990 Malaysia China Indonesia Viet nam
1995 2000 2005 2010 2015
10,000 15,000 20,000 25,000
19 9 0 19 9 1 19 9 2 19 9 3 19 9 4 19 9 5 19 9 6 2 0 0 1 2 0 0 2 2 0 0 3 2 0 0 4 2 0 0 5 2 0 0 6 2 0 0 7 2 0 0 8 2 0 0 9 2 0 10 2 0 11 2 0 12 2 0 13 2 0 14
Post 1997/ 98 Crisis
GDP per–capit a, PPP ( const ant 2011 int USD) Before 1997/ 98 Crisis
GDP
M AN U FACT U RIN G GROW T H
6 World Bank, 2016. Indonesian Economic Quart erly, June 2016. Resilience t hrough ref orms.
7 Ibid.
8 Ibid.
CH IN A
T H AIL AN D
IN DON ESIA
M AL AYSIA
1990 1990 2005 2014 1990 2005 2014 2005 2014 1990 2005 2014 This de-indust rializat ion is viewed as being premat ure because it is occurring f ar t oo early in t he cycle of economic development compared wit h ot her count ries in t he region ( Figure 2.2) .
Wit h t he f ocus of invest ment in Indonesia leaning heavily t oward commodit ies in recent years, count ries in t he region wit h f ewer nat ural resources have been busy
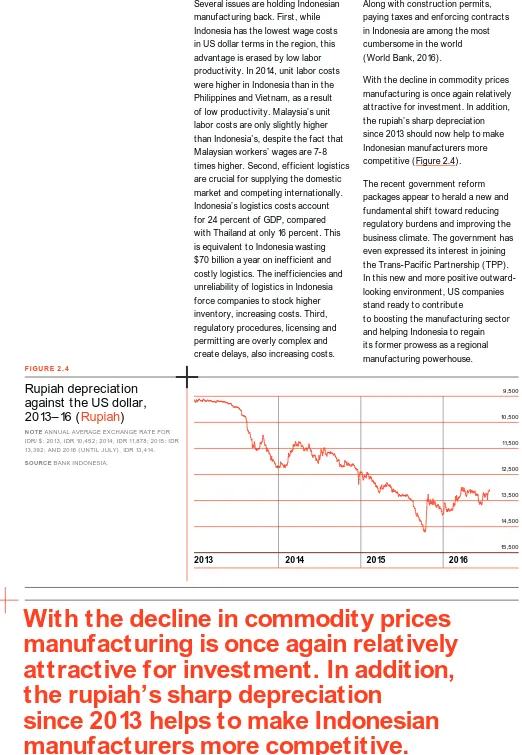
[image:24.595.36.525.229.762.2]With the decline in commodity prices
manufacturing is once again relatively
attractive for investment. In addition,
the rupiah’s sharp depreciation
since 2013 helps to make Indonesian
manufacturers more competitive.
Rupiah depreciat ion
against t he US dollar,
2013–16 (
Rupiah
)
N OTE ANNUAL AVERAGE EXCHANGE RATE FOR IDR/ $ : 2013, IDR 10,452; 2014, IDR 11,878; 2015: IDR 13,392; AND 2016 ( UNTIL JULY) , IDR 13,414.
SOURCE BANK INDONESIA.
F I GU R E 2 . 4
9,500
10,500
11,500
12,500
13,500
14,500
15,500
2013 2014 2015 2016
Several issues are holding Indonesian manuf act uring back. First , while Indonesia has t he lowest wage cost s in US dollar t erms in t he region, t his advant age is erased by low labor product ivit y. In 2014, unit labor cost s were higher in Indonesia t han in t he Philippines and Viet nam, as a result of low product ivit y. Malaysia’s unit labor cost s are only slight ly higher t han Indonesia’s, despit e t he f act t hat Malaysian workers’ wages are 7-8 t imes higher. Second, ef f icient logist ics are crucial f or supplying t he domest ic market and compet ing int ernat ionally. Indonesia’s logist ics cost s account f or 24 percent of GDP, compared wit h Thailand at only 16 percent . This is equivalent t o Indonesia wast ing $70 billion a year on inef f icient and cost ly logist ics. The inef f iciencies and unreliabilit y of logist ics in Indonesia f orce companies t o st ock higher invent ory, increasing cost s. Third, regulat ory procedures, licensing and permit t ing are overly complex and creat e delays, also increasing cost s.
Along wit h const ruct ion permit s, paying t axes and enf orcing cont ract s in Indonesia are among t he most cumbersome in t he world ( World Bank, 2016) .
Wit h t he decline in commodit y prices manuf act uring is once again relat ively at t ract ive f or invest ment . In addit ion, t he rupiah’s sharp depreciat ion since 2013 should now help t o make Indonesian manuf act urers more compet it ive ( Figure 2.4) .
The recent government ref orm packages appear t o herald a new and f undament al shif t t oward reducing regulat ory burdens and improving t he business climat e. The government has even expressed it s int erest in joining t he Trans-Pacif ic Part nership ( TPP) . In t his new and more posit ive out ward-looking environment , US companies st and ready t o cont ribut e
t o boost ing t he manuf act uring sect or and helping Indonesia t o regain it s f ormer prowess as a regional manuf act uring powerhouse.
2 3
[image:25.595.46.568.30.785.2]3
The
Government ’s
Economic
Reform
Packages
The Background
President Widodo announced t he f irst in a series of economic policy ref orm packages in early Sept ember 2015, wit h a f ocus on much needed
deregulat ion ef f ort s. The packages have cont inued coming since t hen, wit h t he t welf t h and lat est package released in lat e April of t his year. Overall,
t hey seem t o demonst rat e President Widodo’s resolve in pushing ahead wit h
const ruct ive and pract ical ef f ort s t o
improve t he invest ment climat e and kick-st art higher economic growt h rat es, af t er a disappoint ing slowdown in 2015. They also demonst rat e t he
pract ical ef f iciency of decision-making under Coordinat ing Minist er f or t he Economy Darmin Nasut ion, who was inaugurat ed int o his posit ion short ly
bef ore t he deregulat ion packages st art ed t o come f ort h, in mid-2015.
US–Indonesia Invest ment Report 2016 2 5
However, while t he economic
deregulat ion packages do hold promise and revising t he rules is cert ainly import ant , a more f undament al object ive lies in changing t he incent ive st ruct ures of t he of f icial who
administ er and uphold t he rules. Even wit h t he very best rules and permit t ing processes in place, companies will cont inue t o f ind t hemselves under pressure if incent ive st ruct ures persist in f avoring rent -seeking behaviors wit hin t he civil service. As such, t he President ’s well-int ent ioned program of deregulat ion may run int o t he sand in t he absence f or more f undament al inst it ut ional ref orm. So, once again,
t his ret urns t o one of t he t hemes of t his invest ment report : incent ives need t o be deliberat ely and caref ully designed t o encourage t he appropriat e behaviors f rom t hose empowered by t hem. If t his can be achieved, t hen meaningf ul progress and change can be unleashed t o dramat ic ef f ect . As we go t o print , it is t o be hoped t hat t he recent cabinet reshuf f le will support t his process and help t o ensure t hat t he ref orm packages have t he maximum impact .
In t he t able below we summarize all of t he 12 economic ref orm packages issued t o dat e, as of July 2016.
Policy Package
Issues Addressed
Issuance of 16 new regulat ions: t o improve t he ease of doing business perf ormance of Indonesia, f ocusing on small businesses. The regulat ions include t echnical and permit policies relat ed t o t he World Bank’s ease of doing business indicat ors ( t ime needed t o st art a business, dealing wit h const ruct ion permit s, paying t axes, obt aining credit , enf orcing cont ract s, elect ricit y sourcing, t rading across borders, resolving insolvency and prot ect ing minorit y invest ors) . The new regulat ions aim t o cut 94 procedures t o 49 procedures, and 9 permit s t o 6 permit s, reducing t he t ime needed f rom 1,566 days t o just 132 days. Finance f acilit at ion f or Export -Orient ed People’s Business Credit ( KURBE) f or MSMEs, wit h int erest set at 9% per year f or t enors of 3 t o 5 years.
Reducing t ax on Real Est at e Invest ment Trust s ( REITs) f rom 5% t o 0.5% t o avoid invest ment f unds f or Indonesian real est at e project s f rom list ing shares in Singapore, where t ax t reat ment is more f avorable. Simplif y and unif y port procedures applied by mult iple minist ries t o bet t er int egrat e wit h t he Indonesia Nat ional Single Window ( INSW) web port al. The aim is t o reduce port dwell t ime at Tanjung Priok t o below 3 days by end of 2017.
Creat e roadmap and policies t o support development of t he pharmaceut icals indust ry
Aut horizat ion f or regional government s t o cut t axes on propert y ( BPHTB) f rom 5% t o 1%. However, BPHTB is one of t he f ew t axes regional government s can use t o generat e local revenue and regional government s may not comply.
Removal of 35 sect ors f rom t he Negat ive Invest ment List ( DNI) , while reserving some f or MSMEs. Not able sect ors include t he f ilm indust ry, cold-chain dist ribut ion f or t he f ood indust ry, dist ribut ion and warehouse services, and ent ert ainment venues such as bars, rest aurant s and recreat ion cent ers. Also, 20 closed sect ors will be part ially opened, including land-based t ransport at ion services ( 49%) and inst allat ion services f or high volt age power f acilit ies ( 49 percent ) .
President ial regulat ion t o assign PLN t o be in charge in accelerat ing elect ricit y inf rast ruct ure by adding st at e equit y t o PLN and ext ending st at e guarant ees.
Relaxat ion of rest rict ions on import s of livest ock and meat .
Logist ics deregulat ion, including t he eliminat ion of requirement f or higher prices t han PT Pos Indonesia by commercial service providers, simplif icat ion of payment process of f ees and t axes f or t raders, and upgrading t he INSW.
Implement ing a Nat ional One-Map Policy, t o be used by all government minist ries and agencies. St rengt hening energy securit y t hrough building and upgrading of oil ref ineries.
Providing t ax incent ives f or aircraf t maint enance services ( MRO-maint enance, repair and overhaul) . Accelerat ing t he land cert if icat ion process.
Providing t ax incent ives f or labor-int ensive indust ries employing more t han 5,000 people and export ing 50% or more of product ion.
Economic policy ref orm packages, Sept ember 2015 – July 2016
T ABLE 3 . 1
XI
X
IX
VIII
Tax incent ives f or t he development of Special Economic Zones ( SEZ) .
St rengt hening licensing management f or wat er resources ut ilizat ion, and t hat wat er-use permit s remain valid, despit e t he Const it ut ional Court ’s verdict in early 2015 t hat st ruck down t he 2002 Wat er Law. Simplif ying import licensing and payment procedures f or f ood and t he raw mat erials f or drugs t hrough a paperless mechanism using t he INSW.
Opport unit y f or companies t o revalue t heir asset s, which should be of most help t o st ruggling st at e-owned companies.
Eliminat ing double t axat ion f or real est at e invest ment t rust s ( REITs) t o encourage more domest ic REITs, inst ead of t hem list ing in t ax haven count ries.
Deregulat ing policies in t he Sharia banking indust ry.
Int roducing new f ormula f or calculat ing minimum wages by considering t he variables of inf lat ion and t he economic growt h rat e, removing t he unpredict abilit y of t he previous syst em.
Decreasing f uel and elect ricit y prices. The ref orms cover diesel, aviat ion f uel, LPG, gas and elect ricit y, but do not include pet rol.
Providing more af f ordable and wider access t o t he People’s Business Credit ( KUR) program. Simplif ying t he land licensing process f or invest ment . Also, comput erizat ion of nat ional Land Agency ( BPN) of f ices, resurveying of land plot s nat ionwide, est ablishing a credible syst em f or adjudicat ing ownership disput es, and compiling a cent ralized map of land-ownership nat ionwide.
Int erest -income t ax exempt ions f or deposit s by f oreign-exchange earning export ers.
Value-added t ax exempt ions f or t ransport at ion sect or it ems, including aircraf t , t rains, vessels, spare part s and relat ed services.
Accelerat ed permit t ing f or invest ment s t hat t ake place in indust rial zones.
Plans t o set up t wo bonded zones by t he 2016: one f or f uel product s in Bant en; and one f or manuf act ured goods in West Java.
Swif t er processing f or grant ing t ax allowances and t ax holidays.
Ref orms in f orest ry sect or permit t ing t o reduce t he number of permit s f or resource sect or invest ors and accelerat e processing. The minist ry will reduce t he number of permit s f rom 14 t o 6.
Indust rial Sect or Deregulat ion by eliminat ing several regulat ions, permit s, and bureaucracies wit hin t he minist ries and relat ed inst it ut ions t hat inhibit s nat ional t rade.
Trade Sect or Eliminat ing regulat ions and requirement s t hat are not relevant t hat have been set previously by 15 minist ries or 18 unit s of licensing publisher as well as improving t he ef f iciency in licensing services wit h Indonesia Nat ional Single Window ( INSW) .
Empowerment of Cooperat ives and SM Es
Eliminat ing regulat ions and bureaucracies t hat are not relevant in order t o st rengt hen t he f unct ion of cooperat ives and t o increase SMEs in economic act ivit y and t he issuance of new regulat ions t o st rengt hen regional cooperat ives and t o ease import f or cooperat ives and SMEs.
M arit ime & Fisheries ( Fisherman) President ial decree t o convert diesel f uel t o LPG f or f uel cost savings of 70%.
Tourism Sect or The issuance of new regulat ions t o add visa-f ree count ries as well as t he eliminat ion of regulat ions t hat inhibit marine t ourism.
Ensuring Implement at ion of t he Reforms
In t he second quart er of t his year, concerns st art ed t o surf ace over t he ef f ect ive implement at ion of t he economic ref orm packages. Despit e t he 12 packages released t o dat e since Sept ember 2015, t he Indonesian economy has st ruggled t o bounce back, wit h growt h of only 4.92 percent in t he 1Q16. This was not only lower t han expect ed but also lower t han t he 5.04 percent growt h achieved in t he 4Q15— t he quart er af t er t he st art of t he release of t he packages. Invest ment growt h was also lower QoQ in 1Q16. One example of t he concern is t hat some of t he
implement ing regulat ions needed f or t he ref orms have not been issued. One not able case is t he implement ing regulat ion needed f or t he new Invest ment Negat ive List ( DNI) issued in t he t ent h policy package.
President Widodo seemed t o respond t o t he concerns af t er t he announcement of t he t welf t h package, which he cit ed as being t he driver f or his hoped-f or improvement in Indonesian’s ranking in t he World Bank Group’s Ease of Doing Business f rom 109 t o 40. He went on t o promise t o est ablish a special t ask f orce t o ensure implement at ion of t he economic packages, wit h t he President himself
VI
V
IV
III
II
I
2 7
act ing as chairman. One of t he f irst undert akings of t he special t ask f orce will be t o complet e all of t he 203 implement ing regulat ions required t o support t he economic packages announced t o dat e. At t he t ime of writ ing, 193 of t hese regulat ion have been issued. This is a posit ive st ep and demonst rat es t he President ’s own personal det erminat ion in making sure t here is real progress t owards f ull implement at ion. However, it should also be ment ioned t hat t he delays in implement at ion are also t o some ext ent due t o t he t ug-of -war bet ween more ref ormist minist ers who support t he liberalizat ion, and t hose who are more prot ect ionist . In light of t he recent cabinet reshuf f le, it is hoped t hat t he changes bode well f or great er synergies across t he cabinet and a st ronger degree of consensus bet ween minist ries and minist ers in achieving t he government ’s agenda.
AmCham’s Recommendat ion and Reform Scorecard
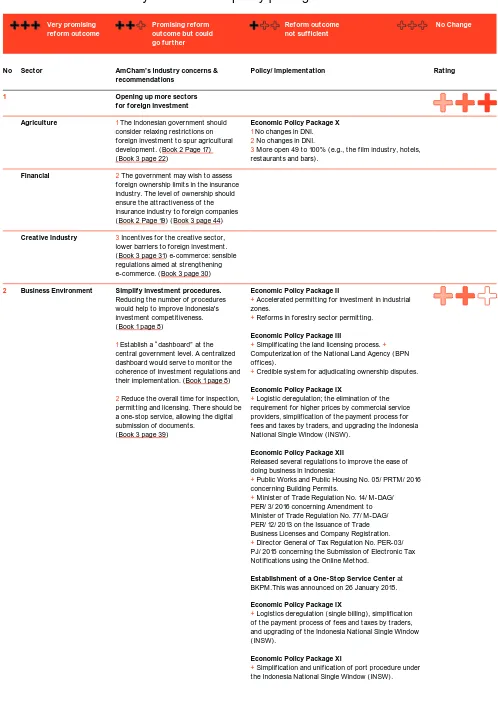
Taking all 12 economic ref orm packages int o account , and looking back over all t he recommendat ions made by AmCham in it s t hree invest ment report s t o dat e ( 2013-15) comprising 50 indust ry concerns in all, we have at t empt ed t o measure progress against t hese concerns. This is hardly a scient if ic exercise and rat her subject ive. Nonet heless, it does give a clearer indicat ion of t he ext ent of progress we have seen t o dat e. The result s are shown in Table 3.2 below, which list s t he indust ry concerns
t hat have been part ially addressed, t he ref orm measures t aken, and a rough score f rom one t o t hree of how ef f ect ive t he ref orms are viewed in addressing t he indust ry concerns. At t his st age, we have decided not t o t ry t o measure t he ef f ect ive changes on t he ground and how ef f ect ively t he ref orms have been implement ed. In many cases it is st ill t oo soon t o t ell, and we will leave t his exercise unt il a clearer underst anding can be developed, hopef ully in next year’s invest ment report .
No Sect or AmCham’s indust ry concerns & recommendat ions
Policy/ Implement at ion Rat ing
1 Opening up more sect ors
for foreign invest ment
Agricult ure 1 The Indonesian government should consider relaxing rest rict ions on f oreign invest ment t o spur agricult ural development . ( Book 2 Page 17) ( Book 3 page 22)
Economic Policy Package X
1 No changes in DNI.
2 No changes in DNI.
3 More open 49 t o 100% ( e.g., t he f ilm indust ry, hot els, rest aurant s and bars) .
Financial 2 The government may wish t o assess f oreign ownership limit s in t he insurance indust ry. The level of ownership should ensure t he at t ract iveness of t he insurance indust ry t o f oreign companies ( Book 2 Page 19) ( Book 3 page 44) Creat ive Indust ry 3 Incent ives f or t he creat ive sect or,
lower barriers t o f oreign invest ment . ( Book 3 page 31) e-commerce: sensible regulat ions aimed at st rengt hening e-commerce. ( Book 3 page 30)
2 Business Environment Simplify invest ment procedures. Reducing t he number of procedures would help t o improve Indonesia's invest ment compet it iveness. ( Book 1 page 8)
1 Est ablish a “ dashboard” at t he cent ral government level. A cent ralized dashboard would serve t o monit or t he coherence of invest ment regulat ions and t heir implement at ion. ( Book 1 page 8)
2 Reduce t he overall t ime f or inspect ion, permit t ing and licensing. There should be a one-st op service, allowing t he digit al submission of document s.
( Book 3 page 39)
Economic Policy Package II
+ Accelerat ed permit t ing f or invest ment in indust rial zones.
+ Ref orms in f orest ry sect or permit t ing.
Economic Policy Package III
+ Simplif icat ing t he land licensing process. +
Comput erizat ion of t he Nat ional Land Agency ( BPN of f ices) .
+ Credible syst em f or adjudicat ing ownership disput es. Economic Policy Package IX
+ Logist ic deregulat ion; t he eliminat ion of t he requirement f or higher prices by commercial service providers, simplif icat ion of t he payment process f or f ees and t axes by t raders, and upgrading t he Indonesia Nat ional Single Window ( INSW) .
Economic Policy Package XII Released several regulat ions t o improve t he ease of doing business in Indonesia:
+ Public Works and Public Housing No. 05/ PRTM/ 2016 concerning Building Permit s.
+ Minist er of Trade Regulat ion No. 14/ M-DAG/ PER/ 3/ 2016 concerning Amendment t o Minist er of Trade Regulat ion No. 77/ M-DAG/ PER/ 12/ 2013 on t he Issuance of Trade
Business Licenses and Company Regist rat ion.
+ Direct or General of Tax Regulat ion No. PER-03/ PJ/ 2015 concerning t he Submission of Elect ronic Tax Not if icat ions using t he Online Met hod.
Est ablishment of a One- St op Service Cent er at BKPM.This was announced on 26 January 2015. Economic Policy Package IX
+ Logist ics deregulat ion ( single billing) , simplif icat ion of t he payment process of f ees and t axes by t raders, and upgrading of t he Indonesia Nat ional Single Window ( INSW) .
Economic Policy Package XI
+ Simplif icat ion and unif icat ion of port procedure under t he Indonesia Nat ional Single Window ( INSW) .
AmCham’s list of indust ry concerns and policy package mat rix scorecard
T ABLE 3 . 2
Very promising reform out come
Promising reform out come but could go furt her
Reform out come not sufficient
No Change
2 9
[image:31.595.68.566.58.779.2]No Sect or AmCham’s indust ry concerns & recommendat ions
Policy/ Implement at ion Rat ing
3 Ext ract ive Indust ry Overlapping mining permit s Cent ral and local government s would be well served if t hey all used t he same reliable nat ional map t o avoid conf lict s. ( Book 2 page 11)
Economic Policy Package VIII Implement ing a Nat ional One-Map Policy
t o be used by all government minist ries and agencies.
4 Business Environment Land acquisit ion
1 Improve implement at ion of t he Law on Land Acquisit ion.( Book 1 page 9)
2 The government should build public awareness on t he Land Acquisit ion Law and ensure t hat best pract ise learned f rom successf ul project s is applied in f ut ure. ( Book 2 page 7)
Economic Policy Package III
+ Simplif icat ion of t he land licensing process f or invest ment .
+ Resurveying of land plot s nat ionwide.- Credible syst em f or adjudicat ing ownership disput es. - Cent ralized map of land ownership nat ionwide
Economic Policy Package VII
+ Accelerat ing t he land cert if icat ion process.
Economic Policy Package VIII
+ Implement ing a Nat ional One-Map Policy t o be used by all government minist ries and agencies.
5 Ext ract ive Indust ry Regulat ions hindering operat ions in t he mining sect or
The government should cont inue t o int ensif y it s ef f ort s t o ensure great er consist ency in policies and laws governing t he mining sect or. ( Book 3 page 35)
Economic Policy Package I Debureaucrat izat ion by reducing t he t ime span f or permit ext ension request s in t he mining sect or.
6 Oil and Gas Simplificat ion of permit s and approvals in t he oil and gas sect or.
( Book 1 page 8)
Gradual implement at ion of t he plan f or BKPM One-St op Shop service t o t ake over some permit t ing and licensing processes f rom t he Minist ry of Energy and Mineral Resources.
7 Business Environment Compet it ive Tax Incent ives The government should consider leveraging it s t ax incent ive policy t o f ost er a posit ive invest ment environment . It should also ensure t hat invest ment / t ax incent ives are non-dist ort ing, t ransparent , and broad-based. ( Book 3 page 18)
Economic Policy Package I
+ Deregulat ion of Permenkeu No. 106/ PMK.010/ 2015 on Luxury Tax on Object s ot her t han Mot orbikes and Vehicles.
Economic Policy Package II
+ Swif t er processing f or grant ing t ax allowances and holidays, and int erest -income t ax exempt ions f or invest ment s.
+ Value-added t ax exempt ions f or t he t ransport at ion sect or.
Economic Policy Package V
+ Companies can revalue t heir asset s.
+ Eliminat ion of double t axat ion f or real-est at e invest ment t rust s ( REITs) t o encourage more domest ic REITs, inst ead of t hem list ing in t ax haven count ries. Economic Policy Package VI
+ Tax incent ives f or Special Economic Zones.
Economic Policy Package VII
+ Labour-int ensive t ax incent ives f or t hose companies employing more t han 5,000 people.
Economic Policy Package VIII
+ Providing t ax incent ives f or aircraf t maint enance services ( MRO-maint enance, repair and overhaul) . Economic Policy Package XI
+ Reducing t ax on REITs f rom 5% t o 0.5%. +
No Sect or AmCham’s indust ry concerns & recommendat ions
Policy/ Implement at ion Rat ing
8 Business Environment Set t ing minimum wages
Wages should be set using an agreed and t ransparent f ormula t o avoid uncert aint y. ( Book 3 page 7)
Economic Policy Package I
+ Deregulat ion of t he government 's regulat ion on t he wage syst em.
Economic Policy Package IV
+ New f ormula f or calculat ing minimum wages by considering t he variables of inf lat ion and t he economic growt h rat e, removing t he unpredict abilit y of t he previous syst em.