Asia Pacific
See the Disclosure Appendix for the Analyst
Certification and Other Disclosures
Yiping Huang
+852-2501-2735
Hong Kong
Hak Bin Chua
Singapore
Asia Economics Team
BeijingMinggao Shen
Shanghai Ken Peng
Hong Kong Yiping Huang Joe Lo Adrienne Lui Michael Luk Patricia Pong
Singapore Hak Bin Chua Leon Hiew Kit Wei Zheng
Mumbai Rohini Malkani Anushka Shah
Jakarta Anton Gunawan
Seoul Suktae Oh Morgan Kim
Manila Jun Trinidad
Taipei Renee Chen Cheng Mount Cheng Tina Liao
E C O N O M I C &
M A R K E T A N A L Y S I S :
A S I A P A C I F I C
Prospects for Financial Markets
29 February 2008
Asia Economic Outlook
and Strategy
Growth and Inflation Risks
➤
Housing adjustment and tight financial conditions
continue to weigh on the U.S. economy, although
aggressive policies should help
➤
While strong growth will probably continue in
Asia, “decoupling” and “resilience” explanations
offer different investment implications
➤
Exports should slow, but investment could be a
countercyclical force. And certain consumption
items could remain resilient
➤
Food inflation complicates macroeconomic
policymaking, although overall inflation pressures
could ease when growth moderates
➤
While Asian currencies will probably lead the next
2
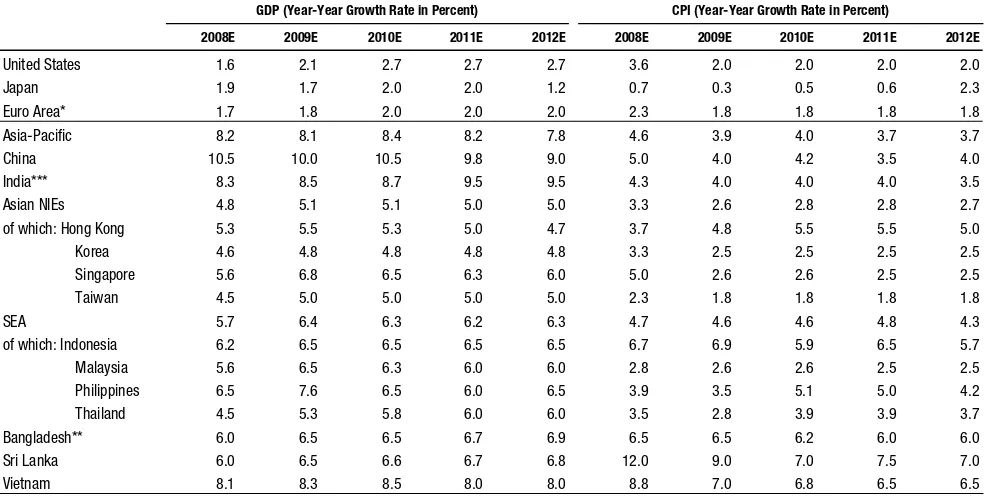
Figure 1. GDP Forecasts (Growth Rate in Percent)
2007 GDP Forecasts 2008 GDP Forecasts 2009 GDP Forecasts
Current Previous Current Previous Consensus Current Previous Consensus
Asia-Pacific 8.8 8.8 8.2 8.3 8.1 8.1 8.3 7.8
Asian NIEs 5.5 5.3 4.8 4.8 4.7 5.1 5.1 5.0
SEA-4 6.1 5.9 5.7 5.8 5.6 6.4 6.5 5.7
Bangladesh* 6.2 6.2 6.0 6.0 5.8 6.5 6.5 5.8
China 11.4 11.4 10.5 10.5 10.3 10.0 10.0 9.7
Hong Kong 6.3 6.1 5.3 5.3 4.9 5.5 5.5 5.1
India** 8.7 9.3 8.3 9.1 8.6 8.5 9.4 7.9
Indonesia 6.3 6.3 6.2 6.2 6.1 6.5 6.5 6.0
Malaysia 6.3 6.0 5.6 5.6 5.6 6.5 6.5 5.9
Philippines 7.3 7.0 6.5 6.5 5.6 7.6 7.5 5.8
Singapore 7.7 7.5 5.6 5.6 5.6 6.8 6.8 5.9
South Korea 4.9 4.8 4.6 4.6 4.6 4.8 4.8 4.9
Sri Lanka 6.7 6.7 6.0 6.0 5.8 6.5 6.5 5.9
Taiwan 5.7 5.4 4.5 4.5 4.3 5.0 5.0 4.6
Thailand 4.8 4.6 4.5 4.6 4.6 5.3 5.7 5.0
Vietnam 8.5 8.5 8.1 8.1 8.3 8.3 8.3 8.2
Figure 2. CPI Forecasts (Growth Rate in Percent)
2007 CPI Forecasts 2008 CPI Forecasts 2009 CPI Forecasts
Current Previous Current Previous Consensus Current Previous Consensus
Asia-Pacific 4.2 4.2 4.6 4.5 4.6 3.9 3.9 3.9
Asian NIEs 2.3 2.3 3.3 3.2 3.1 2.6 2.6 2.7
SEA-4 4.0 4.0 4.7 4.7 4.7 4.6 4.6 4.4
Bangladesh* 7.5 7.5 6.5 6.5 8.6 6.5 6.5 6.9
China 4.8 4.8 5.0 5.0 4.5 4.0 4.0 3.5
Hong Kong 2.0 2.0 3.7 3.7 3.6 4.8 4.8 3.6
India** 4.5 4.5 4.3 4.3 6.0 4.0 4.0 5.7
Indonesia 6.4 6.4 6.7 6.7 6.9 6.9 6.9 6.8
Malaysia 2.0 2.0 2.8 2.8 2.9 2.6 2.6 2.8
Philippines 2.8 2.8 3.9 3.9 3.7 3.5 3.5 3.5
Singapore 2.1 2.1 5.0 5.0 4.1 2.6 2.6 2.4
South Korea 2.5 2.5 3.3 3.2 3.1 2.5 2.5 2.8
Sri Lanka 16.0 16.0 12.0 12.0 13.4 9.0 9.0 9.8
Taiwan 1.8 1.8 2.3 2.3 2.2 1.8 1.8 2.0
Thailand 2.3 2.3 3.5 3.5 3.3 2.8 2.8 2.6
Vietnam 8.3 8.3 8.8 8.1 10.1 7.0 7.0 7.7
Figure 3. Current Account Forecasts (Percent of GDP)
2007 CAB Forecasts 2008 CAB Forecasts 2009 CAB Forecasts
Current Previous Current Previous Consensus Current Previous Consensus
Asia-Pacific 6.8 6.8 5.3 5.6 7.2 4.4 4.6 6.8
Asian NIEs 6.3 5.8 4.7 5.2 6.5 4.4 4.8 6.5
SEA-4 9.0 8.6 4.8 4.8 5.2 4.3 4.3 4.7
Bangladesh* 1.2 1.2 -0.1 -0.1 0.2 -1.1 -1.1 -0.1
China 10.8 10.8 8.8 8.8 11.9 7.0 7.0 11.0
Hong Kong 11.3 11.6 9.1 9.3 11.1 7.0 7.3 11.3
India** -1.2 -1.3 -1.9 -1.7 -1.4 -1.8 -1.4 -1.5
Indonesia 2.0 2.0 1.4 1.4 2.2 0.8 0.8 1.9
Malaysia 15.0 15.0 12.5 12.5 14.4 12.0 12.0 13.8
Philippines 3.7 3.7 3.3 3.3 4.2 2.8 2.8 4.3
Singapore 29.2 29.2 26.0 26.0 30.0 25.0 25.0 29.2
South Korea 0.6 0.5 -1.3 0.4 -0.1 -0.6 0.2 -0.1
Sri Lanka -2.8 -4.1 -3.1 -3.0 -5.7 -2.7 -2.9 -4.7
Taiwan 8.3 7.1 7.2 6.5 6.4 6.2 6.2 6.1
Thailand 6.1 5.2 5.5 5.4 4.6 5.4 5.1 3.6
Vietnam -9.0 -3.9 -8.5 -3.6 -6.9 -5.0 -3.0 -5.5
Note: Asian NIEs are Hong Kong, Korea, Singapore, and Taiwan. SEA-4 includes Indonesia, Malaysia, the Philippines and Thailand. Asia-Pacific is Asian NIEs + SEA-4 + China + India, GDP-weighted.
*Bangladesh Fiscal year runs for July-June. **India Fiscal year runs from April-March and inflation data are Wholesale Price Index forecasts Source: CEIC Data Company Limited, Consensus Economics (11 Feb 08) and Citi estimates.
29 February 2008 Asia Economic Outlook and Strategy — Growth and Inflation Risks
3
Global Economic Outlook
With tight financial conditions reinforcing economic weakness in the U.S., the
Fed has taken a more aggressive tack, with only limited impact thus far. We
look for cuts in the funds rate to 2% by midyear. Growth in the Euro Area has
slowed to a subtrend pace. Inflation remains high but should moderate quickly.
We expect the ECB to ease policy modestly later this year. We expect only a
modest slowdown in emerging economies. Inflation worries in emerging
markets are probably overblown but they will reduce the scope for monetary
loosening in the short run.
Strong Asian Growth
Strong Asian growth will probably continue on greater policy flexibility created
by improving macroeconomic fundamentals, despite slowing growth in the U.S.
While exports are likely to slow significantly, investment could become a
countercyclical force. Certain consumer spending items, such as those
associated with commodity and food revenue, might stay resilient. Food
inflation should remain a challenge for policymaking, although overall inflation
pressures are likely to ease as growth moderates. Capital inflows to Asia could
increase due to the region’s robust fundamentals and resilient growth. Asian
currencies, especially the renminbi, peso and rupee, will probably lead the next
leg of U.S. dollar weakness.
Food Inflation
Soaring food prices are becoming a major policy issue and risk in 2008. Social
unrest has previously erupted in China and India because of high food prices.
Asian governments are responding with price controls and trade measures, some
of which are protectionist. Elections in India, Indonesia and Malaysia could
mean food measures will stay for longer and be cast wider as governments
avoid risking a backlash. If food inflation persists, Asian central banks might
not be able to relax monetary policy despite slowing external demand. Thailand,
India, Indonesia and Malaysia are net agricultural exporters and could benefit.
Equity Strategy: Are We There Yet? No
4
Citi Key Economic Forecasts
2
Macro Overview
5
Global Economic Outlook ... 5
Growth and Inflation in Asia ... 7
Surging Food Prices: Blessing or Curse?
13
Strategy — Asian Currencies and Interest Rates
21
Strategy — Asian Equities: Are We There Yet? No
23
Investor Checklist & Asian Chart Summary
29
Asia Investor Checklist ... 30
Asia Chart Summary... 32
Citi Asia Monetary Conditions Index ... 33
Long Term Forecasts
35
Selected Country Focus
37
China: Renewed Inflation Challenge ... 38
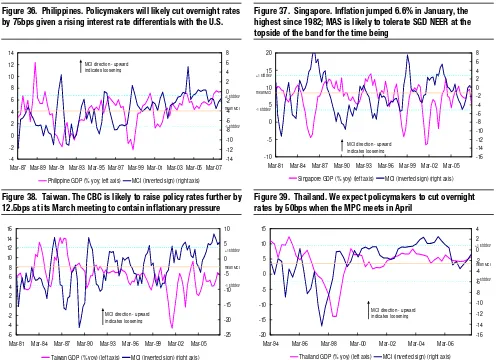
Philippines: Tightening Financial Markets amid Increased Risk Aversion and Political Noise ... 41
Singapore: A More Challenging Year Ahead ... 44
Taiwan: Expecting More Capital Inflows ... 47
Other Country Section
51
Bangladesh... 52
Hong Kong... 54
India ... 56
Indonesia... 58
Korea... 60
Malaysia... 62
Sri Lanka... 64
Thailand ... 66
29 February 2008 Asia Economic Outlook and Strategy — Growth and Inflation Risks
5
➤
Aggressive Fed easing and other policy measures should help
support the U.S. economy, but a sustained pickup in growth depends
on improved financial conditions
➤
Asia is likely to maintain strong growth on greater policy flexibility.
Investment could be a countercyclical force while consumption items
associated with commodity and food revenue could stay resilient
➤
Food inflation already complicates macroeconomic policymaking in
the region, but overall inflation rates could moderate in the coming
months as growth slows
➤
Liquidity inflows to Asia could increase due to robust fundamentals
and resilient growth, and Asian currencies will probably lead the next
leg of U.S. dollar weakness
Global Economic Outlook
1The recent deterioration in financial conditions is having its biggest impact on the
U.S. economy. Europe is also slowing, but the spillover to most emerging economies
remains modest so far. Looking ahead, we expect a variety of factors — including
the waning of the drag from residential construction, fiscal stimulus, and improving
financial conditions driven by a more assertive Fed — to contribute to a modest
recovery in U.S. growth starting in the second half of the year.
The forces restraining the pace of U.S. economic activity have shown few signs of
easing in recent weeks. Incoming data from the housing sector point to ongoing
contraction. The prevailing mix of credit, equity, and other asset prices continues to
be a significant headwind for aggregate demand (see Figure 4). Consumption
indicators suggest that household spending has slowed markedly.
The U.S. slowdown is a drag on the Canadian and Mexican economies, and
economic activity in the United Kingdom and the euro area is also slowing, but less
sharply than in the United States.
However, most other countries still show few signs of being adversely affected by
the U.S.-led slowdown. Recent data for China point to a strong start to 2008, while
resilient demand for commodities is supporting many emerging economies and
smaller high-income countries with a comparative advantage in commodity
production. The underperformance of the U.S. economy relative to most other major
economies is contributing to downward pressure on the U.S. dollar (see Figure 5).
This pattern may change in coming quarters. The U.S. slowdown is spreading
beyond residential construction. A broader and deeper slowdown in U.S.
1
This is a summary of the focus piece “Overview: The United States and World Economic Outlook” in Global Economic Outlook and Strategy, February 28, 2008.
Macro Overview
6
consumption and investment should generate a more significant slowdown in imports
that will serve to moderate growth in the rest of the world.
Policy flexibility around the world is likely to play an important role in containing
the global slowdown. Unlike the past, many emerging economies (such as Brazil,
Mexico, and Korea) have strong public and private balance sheets, and they have
established strong records of pursuing stable macroeconomic policies. This should
make it possible for these countries to ease policy, if needed, even in the midst of
substantial turmoil in global financial markets.
Figure 4. United States — Citi Financial Conditions Index (Standard
Deviations) and the Output Gap (Percent of GDP), 1988-Jan 08
Figure 5. United States and Other Major Industrial Countries —
Economic Surprises (100=1 Standard Deviation), Jan 07-27 Feb 08
-3 -2 -1 0 1 2 3
1988 1990 1992 1994 1996 1998 2000 2002 2004 2006 2008 -6 -4 -2 0 2 4 6
FCI (Left) GDP Gap (Right)
3σ 6%
-75 -50 -25 0 25 50 75 100
Jan-07 Apr-07 Jul-07 Oct-07 Jan-08 Apr-08 -75 -50 -25 0 25 50 75 100
United States Other Major Economies
Note: Shaded regions denote recession. Sources: Bureau of Economic Analysis, Congressional Budget Office and Citi.
Note: Citi Economic Surprise Indexes are weighted averages of the difference between individual data releases and the consensus forecast. “Other Industrial Countries” includes the euro area, Japan, Great Britain, Australia, and Canada. Source: Citi.
Strong commodity prices and declining output gaps in some countries are putting
upward pressure on inflation. Nonetheless, we expect the slowdown in the United
States and Western Europe to contain inflation in those countries, and slowing export
growth should help to contain inflationary pressures in other key countries such as
China.
29 February 2008 Asia Economic Outlook and Strategy — Growth and Inflation Risks
7
Growth and Inflation in Asia
Distinguishing “Decoupling” and “Resilience”
Will Asian economies continue strong growth in 2008? Our answer is affirmative.
Real GDP growth in emerging Asia is likely to average 8.2% this year, despite recent
downward revisions. China, India and Vietnam will probably continue to be growth
leaders in the region.
But the expected slowdown in the U.S. and robust growth in emerging Asia should
not be taken as evidence of “decoupling” between the two regions. The reason Asia
might maintain strong growth, in our view, is not because Asia will not be affected
by a slowing U.S. economy. Instead, improving macroeconomic fundamentals
during the past decade, reflected by debt burdens, current accounts, fiscal balances
and foreign reserves, have provided Asian authorities with greater policy flexibility
to cope with weakening external demand.
Figure 6. Improving Macro Fundamentals in Emerging Asia
Asia External Debt, Fiscal Balance, Current Account and Foreign Reserves (Share of GDP, 1996 vs. 2007)
-5 0 5 10 15 20 25 30 35 40
1996 2007 1996 2007 1996 2007 1996 2007
External Debt Fiscal Balance Current Account FX Reserves
% of GDP
Note: Asia includes China, India, Indonesia, Malaysia, Philippines, South Korea, Taiwan and Thailand (Weighted by Nominal GDP) Source: CEIC Data Company, Institute of International Finance and Citi estimates.
In January, when our economists in New York lowered their U.S. growth forecast by
0.7ppt to 1.5% for 2008, the Asian economics team revised down regional growth
forecasts by an average of 0.4ppt. These imply elasticity of Asian growth with
respect to the U.S. growth at 0.5. Our earlier simulation applying the Oxford
Macroeconomic Forecasting model estimated an average elasticity of 1.0. The gap
between 0.5 and 1.0 can probably be explained by policy responses, such as
expansionary fiscal policy to boost domestic investment.
Even though headline growth forecasts might look very similar, it is important to
distinguish between the “decoupling” scenario and the “resilience” scenario. In a
Yiping Huang (852) 2501-2735
8
decoupling scenario, we should expect business as usual, while in a resilience
scenario, we should expect significant structural changes and major profitability
adjustments. Differentiating between the two scenarios would have important
implications for investment strategies.
Short Exports, Long Investment
We concur with the consensus view that investors should stay away from
export-related activities when risks of U.S. recession increase. However, the question is if
investors should focus more on consumption or investment. During the past weeks,
domestic consumption became a popular investment theme. Some investors have
even argued that Chinese and Indian consumers might be able to pick up the slack of
weakening U.S. consumption.
After all, in open economies, like Asia, households derive significant portions of
their income from the export sector, directly or indirectly. We recommend a more
selective approach toward consumption. Statistical analyses, for instance, revealed a
positive correlation between consumption in China and the U.S. A 1ppt slowdown in
U.S. real consumer spending normally drags down growth of Chinese consumption
by 0.3ppt (see Figure 7).
Figure 7. Regressing Chinese Consumption and Investment on U.S. Consumer Spending
Real Growth of Chinese Consumption
Real Growth of Chinese Investment
Constant 10.19* 18.96*
(0.40) (2.02)
Growth of U.S. Consumption (6 Months Lag) -2.10*
(0.49)
WTO Dummy * Growth of U.S. Consumption (6 Months Lag) 0.34*
(0.16) East Asian Financial Crisis Dummy (Jan 98-Dec 99) -1.93* 6.90*
(0.47) (2.30)
WTO Dummy (Jan 02-Nov 07) -0.69 7.11*
(0.52) (2.55)
Adjusted R-Squared 0.15 0.31
Note: Number in the parentheses under coefficient estimates are associated standard errors. And those estimates with * are statistically significant at 5% confidence level. The analyses apply monthly data between 1994 and 2007.
Source: Citi estimates.
But, of course, consumption as a whole should be more resilient than exports. In
particular, consumption in the following three areas could survive better: (1)
consumption in areas and economies that are relatively insulated from the effects of a
U.S. slowdown, such as India and inland provinces of China; (2) consumption that is
driven by commodity revenue; and (3) consumption in rural areas as rural incomes
benefit from soaring food prices across the region.
29 February 2008 Asia Economic Outlook and Strategy — Growth and Inflation Risks
9
Although the Chinese government has been attempting to rebalance the economy by
reducing the pace of investment growth, we expect the government to shift to
expansionary policy once the effects of the U.S. slowdown materialize. Growth is
still the most important economic indicator in China. The government can take steps
in at least three areas to boost domestic investment temporarily: (1) allocating direct
fiscal spending on infrastructure; (2) encouraging the state sector to invest more in
the resource and energy sectors; and (3) relaxing some existing controls such as
credit rationing.
China will not be alone this time (see Figure 8). Singapore already has large
on-going construction projects, including new casinos. The new government in Thailand
is attempting to revive some of the infrastructure projects planned under the former
Thaksin government. The Indonesian government has been pushing for large
investment for years. And the incoming president in Korea is pro-growth. Upcoming
elections in Malaysia, Indonesia and India might also increase the probability of
policy stimulus. In general, however, countries with large fiscal deficits would be
more constrained in making policy responses.
Figure 8. Likely Policy Measures to Boost Investment
Country Fiscal Balance in 2007 (% of GDP)
Possible Policy Measures to Boost Investment in the Face of a U.S. Recession
China -1.8 (forecast) (1) Some relaxation of credit controls; (2) more government spending on social security, healthcare and infrastructure; and (3) slowing the pace of currency appreciation
Hong Kong 7.2 The 2008-08 budget allocates HK$21.8bn for infrastructure projects that would create 27,000 jobs. Tax incentives are also being provided for private firms to invest in environmentally friendly equipment and vehicles
India -6.0 (forecast) Given that the government is bound under fiscal responsibility legislation (FRBM) to meet targets, fiscal stimuli will likely be limited. However, rural and urban infrastructure projects, which are a significant portion of budgeted outlays, would help support investment activity
Indonesia -1.3 (forecast) Higher fiscal deficit (2008E: 4.2% of GDP) could play a leading role in promoting growth, particularly if spending goes into infrastructure. The government plans to reallocate some of the budgeted spending for goods and official travel into higher capital and social spending in 2008. Relaxation of some bank lending regulations would also help support growth
Korea 2.0 (forecast) Effective balance
(excludes social security accounts) =
-1.0%
BOK rate cut and small-scale tax cuts (with a supplementary budget) would be short-term measures. Mid- to long-term measures include deregulation of corporate investment, deregulation of the housing market, a gradual reduction in corporate income taxes and infrastructure projects such as the Grand Canal
Malaysia -3.1% (forecast) Accelerated implementation of the Ninth Malaysia Plan and Growth Corridor Projects are likely. Upcoming UMNO internal party elections in mid-2008 could sustain fiscal pump-priming even after the general elections
Philippines -0.1 Arroyo plans to front load the infrastructure program totaling Php200bn this year as a fiscal hedge against offshore downside risk. Government asset sales. such as the privatization of state-owned power assets, can re-energize private investment as well as generate revenue for the government. In a recent BSP survey, business sector respondents in the construction and power sectors expressed bullish sentiment for 1Q08 despite an imminent global downturn
Singapore 3.4% (primary fiscal balance)
The government plans to bring forward the expansion of rail and road networks. A total of S$5bn annually has been earmarked for spending on land-transport infrastructure until 2020, more than twice the annual spending on all transport infrastructure over the past two decades. However, the extent of pump-priming might be limited by capacity constraints in the construction sector
Taiwan -0.2% (forecast) We expect liberalized cross-strait relations to boost domestic investment
Thailand 2.1 (forecast) Within the next 12 months, construction of a few rail transit lines to Bangkok can provide an investment boost. State-owned enterprises will also pursue investment plans. Removal of exchange restrictions, such as the 30% unremunerated deposits, and abolition of the revised Foreign Business Act can go a long way toward enhancing foreign investment
10
As a result, economic growth in Asia could become even more driven by investment.
This implies that the commodity intensity of Asian economies could actually rise.
This should provide relatively better support for commodity markets where Chinese
or Asian demand already plays dominant roles. Iron ore, steel, copper, zinc, nickel,
coal and aluminum are some examples (see Figure 9).
Figure 9. China’s Shares of Global Commodity Consumption, 2006 (%)
26
36 23
20
30
53 37
8 8 4
21
0 10 20 30 40 50 60
Alumina Aluminium Copper Nickel Zinc Iron Ore Steel Gold Crude Oil GDP Population
%
Source: Citi Investment Research.
Inflation Challenges
High inflation rates could be a serious constraint for the expected expansionary
policy. While Asian governments attach great importance to growth, inflation is
probably equally important. Inflation and corruption were the two main problems
that caused the Tiananmen Square incident almost 20 years ago in China. We also
note that high food prices recently generated social tension in Indonesia, Malaysia
and Vietnam.
29 February 2008 Asia Economic Outlook and Strategy — Growth and Inflation Risks
11
Figure 10. Inflation Targeting in Asia
Actual Core/Headline CPI (% yoy)
Economy Targeted Price Index 2007
Government Target or
Forecast for 2008 (%) Most recent 3-months prior
Citigroup CPI Forecast, 2008
(%YoY)
China
No official inflation
targeting policy 3.0-3.5 Below 4.8% 7.1 (Jan-08) 6.5 5.0
Hong Kong
No official inflation
targeting policy 1.5
3.4 (headline)
4.5 (underlying) 3.29 (Jan-08) 3.21 3.7 India WPI 5.0 4.0-4.5 3.93** (Jan-08) 3.11** 4.3** Indonesia CPI 5.5-8.6 4.0-6.0 (BI) 7.36 (Jan-08) 6.88 6.7 Korea Headline CPI 2.5 to 3.5 (BOK) 2.5-3.5% (BOK) 3.89 (Jan-08) 3.0 3.3
Malaysia
No official inflation
targeting policy 2.8 2.0-2.5 2.28 (Jan-08) 1.92 2.8 Philippines CPI 5-6 4.0-5.0 4.86 (Jan-08) 2.7 3.9
Singapore
No official inflation
targeting policy 0 - 1 4.5-5.5 6.64 (Jan-08) 3.65 5
Taiwan
No official inflation
targeting policy 2.0 2.0 3.34 (Dec-07) 3.1 2.3
Thailand Core CPI (ex. ag and oil) 4-4.5 1.0-2.0 1.24* (Jan-08) 1.05* 3.5
Vietnam
No official inflation
targeting policy 6.5 8.5-9.0 15.66 (Feb-08) 10.0 8.8 Source: Citi.
We think chances of stagflation in Asia are still remote. The expected slowdown in
exports is likely to ease inflation pressure, as a result of rising overcapacity risk. In
China, for instance, export growth slumped twice during the past decade, once in
1998 and again in 2001. Both times were followed by deflation (see Figure 11).
Thus, inflation rates could moderate in Asia from the second quarter, especially as
the special holiday effects fade while the base effect kicks in.
Figure 11. Export Growth and CPI Inflation in China, 1997-2007 (%)
-2
-1
0
1
2
3
4
5
6
1997 1998 1999 2000 2001 2002 2003 2004 2005 2006 2007
0
5
10
15
20
25
30
35
40
CPI (LHS)
Exports (RHS)
12
There are many factors supporting the case that the latest food inflation might be
structural. These factors include: (1) demand expansion associated with strong
income growth; (2) decline of agricultural resources as a result of urbanization and
industrialization; and (3) deterioration of the global climate.
2We are not overly
pessimistic about the long-term outlook for food inflation, as supply normally would
respond to strong demand. But food prices could stay at relatively high levels in the
coming months. This could complicate macroeconomic policymaking in the region.
Market Implications
Liquidity conditions are another important factor, alongside macroeconomic
momentum and policy, that could shape the outlook for Asian financial markets.
Despite the recent credit crunch in the U.S. and Europe, we expect the relatively
abundant liquidity conditions in Asia to continue in 2008. This implies that, with a
slowing U.S. economy, depreciating U.S. dollar and falling U.S. interest rates,
liquidity flows to emerging market economies might increase this year. Emerging
Asia, due to its robust fundamentals and resilient growth, stands to benefit from more
capital inflows.
Emerging Asian currencies, especially the renminbi, peso and rupee, are likely to
lead the next leg of U.S. dollar weakness. High inflation provides another reason for
faster currency appreciation in the region. However, market participants who expect
12-15% renminbi appreciation might be too aggressive. While we agree that the
general case for currency appreciation holds, slowing export growth could make
every central banker cautious about exchange rate policies. We cannot rule out the
possibility of erratic capital account control measures in the face of strong inflows.
Asian interest rates are likely to fall, along with the U.S. Fed funds rate, as long as
inflation does not pose a challenge. Rates have already dropped significantly in Hong
Kong and Singapore. Central banks in Thailand, the Philippines and Korea are likely
to cut. Indonesia could introduce effective easing by switching the target instrument
from the one-month rate to the overnight rate.
Equity markets are already expensive generally, and earnings disappointments could
become a constant theme in 2008. But we remain upbeat about certain markets,
especially where valuations are not particularly high and activities are more insulated
from an export slowdown. We think investment, commodities and rural consumption
should do relatively better.
Across the region, China could continue above-10% growth, due to strong
macroeconomic fundamentals. India is probably best protected from an export
slowdown. Indonesia, Malaysia, Thailand and Vietnam might also benefit from
relatively more resilient commodity and food markets. Korea could potentially
benefit from some pro-growth measures once the new president begins to dictate
economic policies. Taiwan and Thailand are already in the middle of macroeconomic
turnarounds associated with elections.
2
29 February 2008 Asia Economic Outlook and Strategy — Growth and Inflation Risks
13
➤
Soaring food prices are becoming a major policy issue and risk in
2008. Asian governments are responding with price controls and a
mixed bag of trade measures, some of which are protectionist and
some trade enhancing
➤
If food inflation persists, Asian central banks will be less likely to
shift to a more accommodative monetary policy, despite slowing
external demand
➤
Thailand, India, Indonesia and Malaysia are net agricultural
exporters, at more than 4% of exports, and should benefit.
Agriculture accounts for more than one third of employment in the
Philippines, Indonesia, China, India, Vietnam and Thailand
➤
High food prices lift rural incomes and decentralize power from the
urban center. Income distribution might improve if government
policies allow high agricultural prices to filter down to farmers
➤
High food inflation is, however, politically explosive and could stir
social unrest. Riots have previously broken out in China and India
because of high food prices, and some recently occurred, on a
small-scale, in Vietnam, Indonesia, Malaysia and Pakistan
➤
Food inflation and elections produce a combustible mix, with
elections slated in Malaysia, Indonesia, China and India over 2008-09.
Food measures, including controls and subsidies, will likely stay for
longer and be cast wider as governments avoid risking a backlash at
the polls
Soaring food prices are becoming a major policy issue and risk for Asia this year.
What had been hoped to be just temporary is turning out to be a more structural
phenomenon. Two major trends – rising affluence in emerging economies,
particularly China and India, and growing use of food crops for biofuels – are driving
up global food demand and prices. Climate change is also making food supply more
volatile.
The global population will rise to 9.2 billion by 2050 from 6.5 billion in 2005,
according to the United Nations, and will increase pressure on global food supplies.
These pressures are sharply accentuated by increasing demand in developing
countries, such as China and India, for protein-rich foods, which require more grain
and water to produce. Annual per capita consumption of meat in China, for example,
quadrupled from 10 kilograms in 1950 to 40 kilograms today.
The use of crops to produce biofuels is also impacting food security. Government
policies to reduce carbon emissions and dependence on imported energy are,
Surging Food Prices: Blessing or
Curse?
14
somewhat ironically, driving food prices higher. Biofuels might consume up to 30%
of the U.S. corn crop by 2010.
On the supply side, climate change is increasing the volatility of weather and rainfall
patterns. This vulnerability is being exacerbated by a sharp fall in arable farmland
per head of global population by half over the last 50 years.
3Figure 12. Food Inflation in China, Vietnam and Indonesia
-15.0 -10.0 -5.0 0.0 5.0 10.0 15.0 20.0 25.0
Jan-04 Jan-05 Jan-06 Jan-07 Jan-08 China Indonesia Vietnam
% YoY
Figure 13. Food Is Driving Up Inflation in China
-6 -4 -2 0 2 4 6 8 10 12 14 16 18 20
Jan-00 Jan-01 Jan-02 Jan-03 Jan-04 Jan-05 Jan-06 Jan-07
CPI: Food CPI: ex-Food CPI
% YoY
Source: CEIC Data Company Limited, and Citi estimates.
Whether food production will respond quickly enough to meet rising demand and
tame food prices is not clear. However, for now, food prices are continuing their
upward trend. This will have a major economic and political impact in Asia, with
implications for policy, growth and income distribution.
Food CPI inflation in China climbed to 16.7% in December and is likely to pick up
sharply early this year given exceptionally cold weather. Prices of seasonal
agricultural products rose by more than 10% in January, with the wholesale price of
vegetables rising 50.6% (see Figure 13).
Food CPI in Vietnam rose 22% in January, driving overall inflation to 14%. In
Indonesia, food CPI inflation climbed to 11.4%, as the cost of imported soybeans,
wheat and other food products surged. Bank Indonesia recently raised its 2008
inflation forecast to 6 – 6.5% versus 4 – 6% previously.
Food CPI inflation is a major driver of overall headline inflation because of the large
weight in the CPI basket for a number of countries. Food accounts for more than
40% of the CPI household baskets in Vietnam and Indonesia, and more than 25% in
China and Thailand (see Figure 14). Persistently high food inflation could keep
overall headline CPI inflation elevated, despite easing pressure from slowing
external demand.
3
29 February 2008 Asia Economic Outlook and Strategy — Growth and Inflation Risks
15
Figure 14. Share of Food in Headline CPI Inflation across Asia Ex-Japan
0 5 10 15 20 25 30 35 40 45
VN ID CH TH MY TW IN HK KR
%
Source: Citi estimates, CEIC Data Company Limited.
Asian central banks might be reluctant to shift to a more accommodative monetary
policy, despite slowing external demand, if food inflation persists. The Philippines’
central bank, for example, did not cut policy rates in its February meeting, as
inflation picks up. Consumer prices climbed 4.9% in January, the fastest pace in 15
months.
Thailand’s CPI inflation rose to 4.3% in January, the fastest in 18 months, as food
prices surge 4.8%. The Bank of Thailand’s hands look tied despite lackluster
domestic demand. In Singapore, the Monetary Authority of Singapore will likely
have to maintain its steeper currency appreciation bias despite an economic
contraction in the fourth quarter of last year, as CPI inflation might hit 7% in
February or March.
Food inflation can also be a major driver of social unrest and political instability with
consequences that can be politically damaging. Asset inflation makes the rich richer
and can be tolerated, but food inflation makes the poor poorer and is not likely to be
tolerated.
Mass protests in China in 1989, for example, were preceded by widespread food
inflation. In India, the onion crisis of 1998 is a well-known instance of how high
onion prices led to the BJP government losing in elections. Food riots erupted in
West Bengal in India in October 2007 as a result of disputes over food rationing.
More recently, there have been small-scale riots and anti-inflation protests breaking
out in Indonesia, Vietnam, Malaysia and Pakistan.
16
Figure 15. Surging Food Costs and Policy Responses across Asia
Country & Inflation
(Latest Month) Food Prices Food Policy Responses
China
Food CPI (+18.2%) CPI (+7.1%)
In the past year: pork (+60%), soybean oil (+58%), mutton (+51%,) vegetables (+50%), cooking oil (+35%)
The government cut import taxes and raised export taxes on grain and flour in late December. Imposed temporary price controls on necessities such as grain and meat. Permission required for price increases of grain products, edible oil, pork, beef, mutton, milk, eggs and liquefied petroleum gas
Indonesia Food CPI (+11.4%) CPI (+7.4%)
Steep rises in soybean products and tofu. Since December: Cooking oil (+36%), tempeh (fermented bean curd) (+33%), tofu (+20%), wheat flour (+9%), rice (+7%)
Measures have been introduced to stabilize prices and supplies of rice, cooking oil, soybeans and wheat by raising export taxes and allocating subsidized rice to more poor families
Malaysia Food CPI (+3.8%) CPI (+2.3%)
Up to 50% increases in staples, including wheat flour (+56%), bread (+47%), biscuits (+12%), milk formula (+3%). Shortages have emerged for cooking oil
A National Price Council has been established to stabilize prices and ensure sufficient supplies of essential goods through a national stockpile. This comes on top of existing subsidies for water, electricity, fuel and food, especially rice and sugar. Already, about 9% of the CPI basket is subject to price controls, most of which are food items.Banned shipments of subsidized goods, including wheat, sugar, cooking oil and diesel
Vietnam Food CPI (+22.0%) CPI (+14.1%)
Some worker strikes. In the past year: vegetables (+50%), meat (+40%), fish (+25%), fertilizer (+25-70%), milk (+20%), rice (+20%)
Officials implemented price controls on essential products such as cooking gas, petrol, coal, fertilizer, rice, milk and sugar. But authorities often fail to keep prices within recommended ranges
Thailand Food CPI (+4.8%) CPI (+4.3%)
In the past three months: palm oil (+56%), pickled fish (+38%), coconut (+25%), noodles (+13%)
There has been an increase in the number of food items under price controls. Thailand has, however, been reducing subsidies for fuel and cooking oil in recent years
Singapore Food CPI (+5.8%) CPI (+6.6%)
Cooking oil (+18.3%), dairy products and eggs (+12.7%), meat and poultry (+12.2%)
The government stated that it has no plans to introduce price controls, citing the costs arising from shortages and hoarding. Instead, more subsidies will be directed to the low-income group
Philippines Food CPI (+6.2%) CPI (+4.9%)
Fruit and vegetables (+10.5%), dairy products (+9.8%), eggs (+8.2%), rice (+7.5%)
The government has regulated rice prices for low-end varieties. Other components of the food basket, including meat products and dairy products, are not subject to controls
India
Primary Products WPI (+4.4%), Food (+3.0%); Food CPI (+7%), CPI (+5.5%)
In the past year, milk (+10.2%), beverages and tobacco (+9.9%), edible oil (+8.9%), manufactured food (+5.6%), cereals (+3.5%), rice (+6.8%)
Over the past year, the government has been managing prices of many food products. Wheat and rice are two staple commodities that come under the Public Distribution System. The government procures food grains via the Food Corporation of India at minimum support prices. Other commodities with regulated prices (or through export bans) include onions, skimmed milk powder and sugar
Taiwan Food CPI (+5.3%) CPI (+3.0%)
In the past year: vegetables (+9.5%), fish and shellfish (+6.2%), meat (+3.3%), food away from home (+2.5%)
Price controls have been minimal for food and cover only rice. There are other official price controls on water, electricity, gas supply and transport fares
Korea
Food CPI (+2.9%) CPI (+3.9%)
In the past year: wheat flour (+67%), eggs (+22%), chicken (+16%), tofu (11%), cooking oil (+11%), ramen (+8%), rice (+3%)
There are no official price controls on food items, and there have not been any policy responses on food prices yet. Note that rice, the major grain in Korea, is heavily protected from the international market
Hong Kong Food CPI (+8.8%) CPI (+3.3%)
In the past year: pork (+43%), beef (+39%), tinned meat (+34%), eggs (+22%), poultry (+18%), edible oil (+16%), rice (+11%)
There are no price controls on food items
Source: Citi estimates, media and company reports.
China removed import taxes, raised export taxes and imposed export quotas on grain
and flour in late December. Large producers of some food products – including
dairy, pork, mutton and eggs – must now seek government approval before raising
prices. Wholesalers and retailers of such food products do not have to seek
permission to raise prices, but they must notify the government when prices cross
certain thresholds.
29 February 2008 Asia Economic Outlook and Strategy — Growth and Inflation Risks
17
items. Malaysia has also banned overseas shipments of subsidized goods, including
wheat, sugar, cooking oil and diesel.
Indonesia introduced measures on a number of key food items, including rice,
cooking oil, soybeans and wheat flour (see Figure 16). Some of the measures are
trade-enhancing, including the cutting or abolishing of import tariffs for rice,
soybeans and wheat flour. Others, however, are more protectionist, including higher
export taxes on palm oil. Subsidies have also been increased for rice for poor
households.
In Thailand, the Ministry of Commerce postponed indefinitely price adjustments for
regulated items covering 300 to 400 basic foodstuffs that had earlier been scheduled
for January. The Commerce Minister under the new Samak government is also
considering potential price freezes on up to 30 consumer products, including cooking
oil, rice, instant noodles, dairy products, pork, soap, detergent, toothpaste and
batteries.
In the Philippines, there are no direct price controls although the government is
providing price subsidies for low-end rice that it distributes and makes available to
the retail market.
In Vietnam, the government reduced tariffs on dairy products and animal seeds. It
also instructed firms to speed up production and is keeping a check on price
manipulation, but it has met little success. The Ministry of Finance has proposed
setting a ceiling on selected items, including food items such as fertilizer, sugar cane
and rice, but the proposals have not been implemented explicitly.
The impact of these food policies on overall trade is unclear. Cutting import tariffs
(Thailand, China and India) is trade enhancing. Imposing export taxes and quotas
(Indonesia, China) reduces trade and agricultural exports. The lack of coordination
between countries on such policies can lead to sub-optimal outcomes, with individual
country priorities over food security and domestic food prices taking precedence
over the potential impact on global prices and supply.
Policies that influence food import demand might have a disproportionately large
impact on global prices because, unlike many other hard commodities, the
international food trade is a relatively small part of global food production.
Food
trade accounts for only about 15% of global food production versus 25% for
manufacturing.
Small adjustments in food policies, in China in particular with a population of 1.3
billion, could significantly impact soft commodity prices and global food inflation.
Food currently accounts for only a small fraction of China’s trade volume, or about
2.5% of China’s total exports. Food is largely produced and consumed by the
18
Figure 16. Indonesia’s Policy to Tackle Food Inflation
Commodity Business Sector (Poor) Households Farmers
Rice Import tariffs down from Rp550 to Rp450 Higher volume of subsidized rice for poor households, up from 10kg to 15kg, at a subsidized price of Rp1,650 per kg
Faster distribution of higher quality paddy seeds to increase rice production a. Continue with progressive export tax
policies for palm oil and its derivatives b. Export tax of CPO is raised to 15% when
global CPO price rises above US$1,100 per ton
c. Export tax for CPO-based biofuel to be raised progressively
Cooking oil (palm oil based)
d. Continue with a policy to take over the VAT on domestic production and sale of cooking oil
Open market operation of cooking oil at Rp2,500 per liter
a. No more import tariffs Soybeans
b. Income tax on imports down to 0.5% from 2.5%
Increasing production in 2008
a. Abolish import tariffs a. Facilitating small-to-medium enterprises using wheat flour to convert from kerosene to using liquefied petroleum gas as their energy source b. Continue with a policy to take over the VAT
on wheat flour
b. Pushing for food diversification from wheat flour to other locally based flour such as potato flour Wheat flour
c. Temporary freeze on standards for the quality of wheat flour
1. State enterprises are expected to organize bazaars for poor people for four months Other programs
2. State banks are expected to give soft loans with subsidized interest rates for as much as Rp2 million for every tofu and tempeh peddler. The target is to cover around 5 million food peddlers Source: Media reports, government reports.
Politically, food inflation and elections are a combustible mix. Elections are
scheduled for Malaysia, Indonesia, China and India over the next two years. This
will tie the hands of governments. Food policies and subsidies will likely stay for
longer or even be cast wider as a result for fear of a backlash at the polls. Fiscal costs
and problems such as food shortages, hoarding or smuggling might persist as a
result.
Higher agricultural prices will, however, benefit certain Asian countries. Southeast
Asia and India will likely benefit from the favorable terms of trade shock, being
largely net food exporters. Northeast Asia and Singapore, being large net food
importers, will likely lose out (see Figure 17).
29 February 2008 Asia Economic Outlook and Strategy — Growth and Inflation Risks
19
Figure 17. Agriculture Exports: Which Countries Benefit?
As % of Country Total Exports Agricultural
Exports
Agricultural Imports
Net Agricultural Exports
Annual Food Exports (US$ millions)
Top Agricultural Exports (As a % of Total Exports)
Thailand 10.4 2.7 7.7 16,850 Rubber (3.6%), rice (2.3%), tapioca (0.9%) India 9.9 2.6 7.3 12,520 Marine products (1.4%), rice (1.2%), raw cotton
(1.1%)
Indonesia 12.7 5.9 6.8 5,560 Vegetables oil and fat (7.3%), fish (1.8%), coffee, tea and cocoa (1.7%)
Malaysia 8.4 4.3 4.1 4,150 Vegetables oil and fat (6.1%), coffee, tea and cocoa (0.2%)
China 2.6 1.0 1.5 30,760 Vegetables & fruit (0.9%), fish (0.8%), cereals (0.2%)
Philippines 4.1 4.9 -0.8 2,020 Coconut (1.5%), fruit and vegetables (1.5%), bananas (0.8%)
Source: Citi estimates, CEIC Data Company Limited. Based on latest available 12 months. Agricultural exports include animals, vegetable oil and fat.
High food prices will improve regional income distribution. Asian farmers and
plantation owners will generally be better off, provided government measures allow
these gains to filter through. Higher rural incomes decentralize power from urban
centers, spurring regional development
.
This has already been taking shape in
Indonesia and Thailand.
Figure 18. Agriculture as a Percentage Share of GDP, Employment and Exports
% of GDP % of Employment % of Exports Annual Food Export (US$ millions)
Philippines 18.3 35.8 4.5 2,234
India 17.2 … 9.9 12,515
Indonesia 14.0 43.7 4.9 5,561
China 11.7 44.1 2.5 30,761
Thailand 8.9 43.7 10.4 16,600
Malaysia 7.6 4.7 7.8 14,540
Source: Citi estimates, CEIC Data Company Limited. Based on latest available 12 months.
Agriculture accounts for a disproportionately larger share of employment versus
GDP. More than 35% of the labor force is in agriculture in China, Indonesia,
Thailand, India, Vietnam and the Philippines (see Figure 18). Strong increases in
rural incomes in Malaysia, Indonesia and Thailand over the recent year have been
credited for supporting robust consumer spending growth.
In Indonesia, for example, real wages of workers living outside Java, especially
farmers, have been rising while workers in Java have been facing declining real
wages. Female participation in the labor force has also increased significantly in the
agricultural sector. These rural dynamics were probably one important reason why
growth has been strong for Indonesia (+6.5% in 3Q07) and Malaysia (+6.7% in
3Q07) in recent quarters.
20
Market Implications
Soaring food inflation is turning out to be a major policy issue and risks in Asia in
2008. Food inflation is driving overall CPI inflation, given the large weight for food
in the CPI baskets in several Asian countries.
Recent CPI inflation data for January show higher-than-expected increases in a
number of Asian countries, including Indonesia (January +7.4% vs. +6.6% forecast),
Thailand (January +4.3% vs. +3.7% forecast) and South Korea (January +3.9% vs.
+3.8% forecast). China’s inflation is expected to surge in January as food prices soar,
exacerbated by the severe cold weather. Central banks in Indonesia and Singapore
recently raised their inflation forecasts for 2008 despite dimmer growth prospects.
Some Asian central banks might not be able to comfortably shift to a more
accommodative monetary policy, despite slowing external demand, if food inflation
persists. High oil prices are compounding the pressure. We expect several Asian
central banks to remain tolerant of some modest currency appreciation to contain
inflation pressure, including China, India, Singapore, the Philippines and Malaysia.
Some Asian economies – Thailand, India, Indonesia and Malaysia – stand to benefit,
on net, from high agricultural and food prices. This will help cushion the potential
slowdown in manufactured exports. Higher rural incomes and growth will also
improve regional income disparities in several Asian economies where agriculture
employment is large.
29 February 2008 Asia Economic Outlook and Strategy — Growth and Inflation Risks
21
Figure 19. Currency Forecasts and Forwards
Spot 3 Months 6 Months 12 Months
Range in Jan 28-Feb Forecast Forward Forecast Forward Forecast Forward Mar-08 Jun-08 Sep-08 Dec-08 Mar-09
Versus USD
Japan YEN 106.03 - 109.83 106.33 105.00 105.75 107.61 105.29 112.00 104.43 105.00 105.00 109.00 112.00 112.00
Euro EUR 1.44 - 1.49 1.5106 1.5230 1.5059 1.5170 1.4999 1.4603 1.4900 1.5100 1.5300 1.5100 1.4800 1.4500
Bangladesh BDT 68.38 - 68.71 68.550 69.62 NA 70.29 NA 71.36 NA 69.30 69.80 70.55 71.00 71.5500 China RMB 7.21 - 7.3 7.1160 7.0211 6.9305 6.9348 6.7605 6.6189 6.4615 7.0600 7.0000 6.9000 6.7500 6.5500
Hong Kong HK$ 7.8 - 7.81 7.7836 7.7985 7.7689 7.7852 7.7566 7.7717 7.7369 7.8050 7.7950 7.7800 7.7750 7.7700 India INR 39.14 - 39.53 39.73 38.68 39.71 38.17 39.77 37.17 39.92 39.00 38.50 38.00 37.50 37.00
Indonesia IDR 9330 - 9460 9067 9282 9190 9300 9309 9293 9537 9250 9300 9300 9375 9250
Malaysia MYR 3.24 - 3.31 3.2000 3.1676 3.2033 3.1174 3.2068 3.0172 3.2145 3.2000 3.1500 3.1000 3.0500 3.0000
Philippines PHP 40.33 - 41.25 40.340 38.027 40.435 36.848 40.510 34.344 40.125 39.000 37.500 36.500 35.000 34.000 Singapore SGD 1.42 - 1.45 1.3947 1.3770 1.3893 1.3570 1.3851 1.3103 1.3777 1.3900 1.3700 1.3500 1.3300 1.3000
South Korea KRW 935.6 - 954 936.3 960.0 937.7 947.0 938.4 887.2 939.8 960.0 960.0 940.0 920.0 870 Taiwan TWD 32.22 - 32.47 30.880 30.605 30.788 30.304 30.690 29.800 30.513 30.8000 30.5000 30.2000 29.8000 29.800
Thailand THB 33.04 - 33.61 31.980 31.176 31.989 30.348 32.014 29.008 32.580 31.500 31.000 30.000 29.500 28.750
Vietnam VND* 15970 - 16028 15932 15911 16147 15880 16400 15767 16948 15930 15900 15870 15800 15750
* Forecast as of Global Economic Outlook and Strategy (February 28, 2008) Source: Reuters and Citi estimates.
22
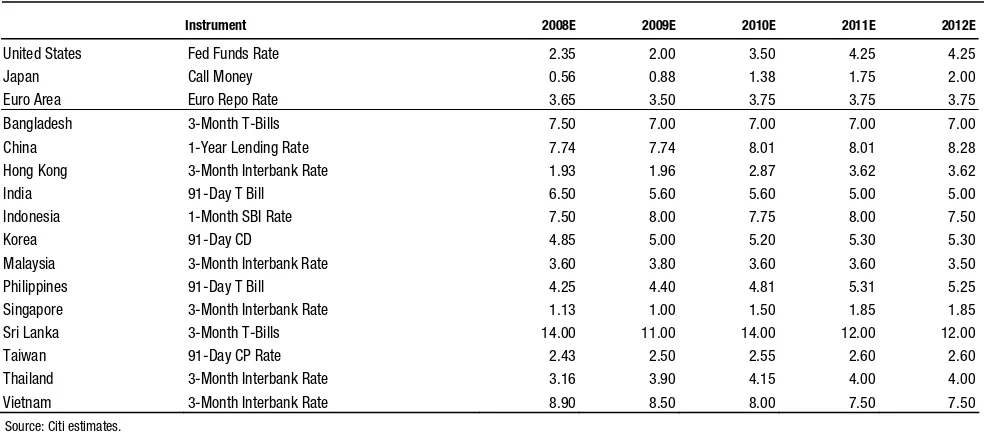
Figure 20. Interest Rate Forecasts (% period end)
Range in Jan 28-Feb In 3M In 6M In 12M 1Q08 2Q08 3Q08 4Q08 1Q09
US Fed Fund Rate 3 - 4.25 3.00 2.25 2.00 2.00 2.50 2.00 2.00 2.00 2.00
10-Year Treasuries 3.43 - 4.02 3.71 NA NA NA 3.65 3.60 3.75 3.85 4.00
EU Repo Rate 4 - 4 4.00 4.00 3.75 3.50 4.00 3.75 3.50 3.50 3.50
10-Year Bunds 3.88 - 4.30 3.96 NA NA NA 4.00 4.00 4.00 4.10 4.25
JP Call Money 0.245 - 0.53 0.51 0.50 0.50 0.75 0.50 0.50 0.50 0.75 0.75
10-Year JGBs 1.31 - 1.51 1.45 NA NA NA 1.50 1.70 1.70 1.80 1.80
CN 1-year lending rate 7.47 - 7.47 7.47 7.74 7.74 7.74 7.74 7.74 7.74 7.74 7.74
7-Day Shibor 2.02 - 5.2 2.60 3.53 3.86 4.00 3.40 3.60 4.00 4.00 4.00
Government bond yield (5 -Year) 4.07 - 4.19 3.87 3.95 4.07 4.30 3.85 4.00 4.10 4.30 4.30
HK 3-Month Interbank Rate 2.26 - 3.61 2.20 1.67 1.62 1.78 1.90 1.55 1.65 1.75 1.80
5-Year Exchange Fund Note 1.97 - 3.09 2.08 1.62 1.57 1.87 1.85 1.50 1.60 1.80 1.90
IN Overnight Repo Rate 7.75 - 7.75 7.75 7.50 7.25 7.25 7.25 7.25 7.25 7.25 7.25
Overnight Reverse Repo Rate 6 - 6 6.00 5.75 5.75 5.75 5.50 5.50 5.50 5.50 5.50
91-Day T Bill 7.02 - 7.26 7.27 6.50 6.50 6.50 6.50 6.50 6.50 6.50 6.50
10-Year Gilt 7.57 - 7.77 7.56 7.25 7.25 7.25 7.25 7.25 7.25 7.25 7.25
ID BI Rate 8 - 8 8.00 7.50 7.50 7.50 7.50 7.50 7.50 7.50 8.00
FR0028 10% 07/15/2017 9.67 - 9.86 9.80 9.36 9.24 9.25 9.10 9.50 9.10 9.25 9.25
MY Overnight Policy Rate 3.5 - 3.5 3.50 3.50 3.50 3.50 3.50 3.50 3.50 3.50 3.50
3-Month Interbank Rate 3.61 - 3.61 3.61 3.60 3.60 3.60 3.60 3.60 3.60 3.60 3.60
5-year MGS 3.47 - 3.81 3.51 3.66 3.70 3.70 3.60 3.70 3.70 3.70 3.70
PH O/N Rate 5 - 5 5.00 4.50 4.50 4.50 5.00 4.50 4.50 4.50 4.50
91-Day T Bill 3.98 - 4.12 4.91 4.09 4.16 4.50 4.25 4.00 4.25 4.50 4.50
5-Year T Bond 5.37 - 6.00 6.43 6.07 5.84 6.00 6.20 6.00 5.75 6.00 6.00
SG 3-Month Interbank Rate 1.5 - 2.37 1.50 1.24 1.05 1.00 1.40 1.15 1.00 1.00 1.00
10-Year SGS 2.19 - 2.67 2.92 2.19 2.02 1.90 2.25 2.15 1.95 1.90 1.90
KR Overnight Rate 5 - 5 5.00 4.50 4.50 4.50 5.00 4.50 4.50 4.50 4.50
91-Day CD 4.94 - 5.89 5.32 4.88 4.70 4.87 5.20 4.70 4.70 4.80 4.90
5-Year Treasury 5.10 - 5.98 5.12 4.82 4.77 4.97 5.05 4.70 4.80 4.90 5.00
TW Overnight Rate 2.07 - 2.09 2.10 2.16 2.20 2.25 2.16 2.20 2.24 2.25 2.25
Re-discount Rate 3.38 - 3.38 3.38 3.50 3.50 3.50 3.50 3.50 3.50 3.50 3.50
91-Day CP Rate 2.20 - 2.23 2.23 2.40 2.44 2.50 2.37 2.41 2.45 2.50 2.50
10-Year Government Bond 2.29 - 2.59 2.37 2.56 2.67 2.80 2.50 2.60 2.70 2.80 2.80
TH Overnight Repo Rate 3.2187 - 3.25 3.25 2.50 2.50 2.50 3.25 2.50 2.50 2.50 2.50
3-Month Interbank Rate 3.37 - 4.42 3.32 3.30 3.09 3.00 3.40 3.25 3.00 3.00 3.00
10-Year Government Bond 4.05 - 4.91 4.08 3.93 3.59 3.66 4.25 3.75 3.50 3.50 3.75
VN 3-Month Interbank Rate 8.62 - 9.71 9.68 9.18 8.87 8.59 9.50 9.00 8.80 8.75 8.50
5-Year Treasury 8.56 - 8.73 8.59 8.54 8.43 8.33 8.60 8.50 8.40 8.40 8.30
Source: Datastream, CEIC Data Company Limited, Bloomberg, Reuters, and Citi estimates
29 February 2008 Asian Economic Outlook and Strategy — Growth and Inflation Risks
23
Are We There Yet? No
Asia-ex is off almost 20% from its high. That must price in a lot of bad news, many
are saying. Surely, we can't be too far off the bottom? As we know, foresight is one
of the weaker human senses, so clairvoyance is best left to those who purport to be
experts in the field. Where we do have an edge is in knowing that at some point
equities will be seen as cheap enough for people to buy them. So, rather than focus
on timing, it is better to look at more intrinsic factors such as value. And value
remains hard to find in these markets.
The risks to earnings forecasts remain great. Q2 and Q3 will see plenty of
downgrades. Nor do valuations give much support. P/BV remains 26% above the
historic mean, a level at which it has historically pointed to downside rather than
upside.
Markets have 16-19% downside until they hit the uptrend set in place since 2003. If
these levels hold, the bull market that began in 2003 would remain intact. If the
supports break, valuations could move to recession-type levels.
Our favorite markets continue to be Hong Kong (and we mean Hong Kong not
China), Korea and Taiwan (both cyclicals and priced as such) and Malaysia. We are
underweight all the others. In terms of sectors, we like telecoms (cash flow, visibility
and yield), ditto for the utilities, and finally the banks (cheap, low expectations and
yield). We are neutral consumers (they are expensive). Biggest underweights: real
estate, industrials and cyclicals and technology.
Main themes: capital preservation, cash flow and yield; buy low expectations and
under-owned sectors and markets. This is a typical cycle. Nothing more, nothing
less. As markets fall, we will be able to buy great businesses cheaper – and that’s a
good thing.
Valuations still far from where they ought to be
The latest reading on P/BV puts the region on 2.4x, or 0.9 SD above the 33-year
average in a series that is highly mean-reverting (Dickie Fuller reading of -3.6). At
its peak in late 2007, P/BV in Asia-ex stood at 2.94x, or 2.56 SD above the mean.
Never (thus far) has the market come off peak valuations and then retested them, let
alone made new highs. Nor have peak valuations been maintained and markets
moved sideways. It may well be different this time, and more than a few believe so.
But best to think in terms of the risk reward, in our view.
If this is a recession, a successful bet against markets going lower
requires a 1-in-150-year event
Over the last 30 years, the P/BV of Asian markets at the bottom of a US recession
has averaged 1.18x. Interestingly, Asia-ex has historically bottomed at 1.1-1.4 times
P/BV. Let’s be optimistic and dismiss the possibility of a repeat of the 1970s or early
1980s recessions and instead focus on the last 2 recessions, 1990 and 2001. During
these two periods, P/BV averaged 1.3x (1.4x in 1990 and 1.2x in 2001). So, on the
basis that any upcoming recession is no better or worse than the last two, Asia-ex as
a region could fall by 47% from current levels. That’s some downside.
Strategy — Asian Equities
Markus Rösgen
+852-2501-2752
Hong Kong
Elaine Chu
+852-2501-2768
Hong Kong
Chris Leung, CFA
+852-2501-2741
24
Now assuming equal probabilities, Asian markets would have to rise by a similar
amount for investors to be neutral on the trade. That would put the region on 3.6x
P/BV, a new high. Of the 48 markets covered by MSCI, 7 trade at or above 3.6x, ie,
15% of the market universe. Those 7 markets, however, represent a mere 1.3% of the
global free float market cap. Again, an outlier event in itself. In terms of 3.6x P/BV,
this would not only be a new high in terms of Asian valuations but also a 4.03 SD
event for the Asian markets. A 4.03 SD event has a 1-in-150-year probability of
occurring if measured using daily data – using annual data, a 1-in-40,000-year event!
Enough said. Given these probabilities, we are still surprised that the defensives are
the least well owned sectors by investors. And until they are, do not expect these
markets to find a bottom.
P/BV still too high; EPS growth is pie in the sky
If the current economic downturn in the US is like the ones of 1990 and 2001,
markets are still too expensive even after the declines year to date. Markets in
Asia-ex seem stuck between complacency (a US problem) and concern (why are Asian
markets down?). But as yet the rise in concern has not led to a significant change in
investor behaviour. Again, if it is just the same as last time, then markets have 47%
downside from here. The biggest potential losers would be China (please bear in
mind we only have data re the 2001 recession), Indonesia and India. Even if it is only
half as bad as in the last 2 recessions because the Fed is more aggressive and policy
makers are cutting taxes, this would still imply 23.5% downside from current levels
for the region as a whole and over 30% for some markets. Investors don't seem to
have priced in even the most benign of these outcomes. Their portfolios remain
pretty much the same as they were in 2007. 2007 was a momentum market. Thus far,
2008 is anything but momentum; it's about tangibles not dreams.
Based on over 30 years worth of data on P/BV in Asia-ex, the probability of making
money on a 6-month view by buying the market when P/BV is 2.4 times is 45%.
That probability falls to 29% on a 9-month view and 26% on a 12 month view. At
these multiples, investors lose more often than they win.
Waiting for markets to bottom requires patience
How long it will take for markets to bottom? We confess: we know nothing. What
we can tell you is that we would be strong buyers at 1.2-1.4x P/BV, as opposed to
sellers, but we don't claim to know the future. During the 1990 downturn, the market
took 8 months to bottom. Asian valuations peaked in October 2007; 8 months later
would take a bottom to around June 2008. If we are unfortunate and this is a re-run
of the 2001 slowdown, when it took 20 months for the markets to bottom, we would
have to wait until June 2009.
Q2 and Q3 will be the quarters for negative revisions
29 February 2008 Asian Economic Outlook and Strategy — Growth and Inflation Risks
25
And as far as earnings go, the potential for them to decline remains significant.
Region-wide, a 41.5% decline in earnings should not come as a surprise given that it
has happened before. As such, it is a perfectly possible event. At present, the
consensus is still running with 10.6% EPS growth inc Hutch/CK or 13.7% ex
Hutch/CK. Should this downturn be like the prior two, a 41.5% decline in 08
earnings would leave the region on a P/E of 26.2 times, well above most investors'
comfort zone.
Again, let’s assume an outcome which is better than in any of the prior recessions.
That is, an EPS decline in 08 of 20%, or only half as bad as postulated previously.
From current levels, this would be a 30% swing in 08 EPS (current forecast +10.5%
and then down 20%); this still gives an 08E P/E of 19.1x, better than 26.2x P/E if we
have a re-run of prior recessions for sure, but a case of good from far but far from
good.
Earnings get revised slowly ... and then collapse
During the 2000/01 downturn, the earnings revisions ratio (up-down/total revisions)
failed to respond until late into the downturn and then there was a flurry of activity.
Yep, by then the market had troughed! Interestingly, both Asian and US analysts
have been revising down their numbers almost in sync as of late. No decoupling on
that front. Bear in mind, we are looking only at the revision index, not at the degree
to which analysts are taking down their numbers. In terms of reducing forecasts,
there is lots of activity but as yet EPS forecasts are declining slowly, from 11.5%
EPS growth for the region down to 10.6%.
What’s cheap on mid-cycle earnings and what’s not
The market is smart and is well aware that recessions don’t last forever, but neither
do booms. We adjust earnings to their mid-cycle point by using a 10-year moving
average ROE. That gives us our earnings base. For the price, we use the current
market cap. Bingo, we have a P/E. We then compare that P/E to constant mid-cycle
valuations.
On that basis, Korea trades at a 26.2% discount, Taiwan at a mere 5.3% premium
and Thailand at a 7.6% premium. Anything below 10% is well within the margin of
error. The beauty of both Taiwan and Korea is that when investors say they are
cyclical, we can only but agree. What’s nice is that they are also priced as such,
whereas markets like India or Indonesia are priced for growth. Given the risks in the
global economy at the moment, we’d rather buy low expectations than high
expectations.
In terms of sectors, as we’ve highlighted before, real estate (48.6% premium), broad
industrials (44.9% premiums) and energy (32.6% premium) continue to look
expensive compared to mid-cycle ROEs. The good news is that these sectors used to
be even more over-valued than they are now. Our concern regarding the real estate
sector is that it is one of the better-owned sectors in the region; ditto for the
industrials.
The cheap sectors are those that no investor wants to touch. Only the broad
26
8.2% premium). We are overweight both banks and telecoms but not the technology
space. Interestingly, MSCI banks, telecoms and technology have all been
outperforming ytd. Of note also, banks, telecoms and technology are some of the
least preferred sectors by Asia ex fund mangers.
Highest return months are behind us
In the case of developed markets, it is sell in May and go away. In Asia-ex, the
working year is shorter. Buy in November and hold on until the end of Chinese New
Year, and then go away. Please note, our four quarters are not based on a calendar
year but run Nov-Jan, Feb-April etc. The highest median return at 10.1% comes from
the Nov.-Jan. period, beating the market return by 5.6%. The next three quarters all
generate returns below the market average since 1988.
This time, Nov.-Jan. has actually performed poorly, with the MSCI Asia-ex index
down by 20% in what is seasonally a strong period. The hope among the bulls has to
be that history does not repeat itself and what has historically been a dull period turns
in to a strong period for markets.
Back to trend
Our call in early December was for markets to return to the uptrend that was set in
place with the commencement of the bull market in 2003. MSCI AC Asia ex-Japan
has about a further 19% downside until the index hits the uptrend in place since
2003. The main driver for the downside is India and Hong Kong in the guise of the
HSI. Ex-India on the MSCI Far East free ex the downside is 16%.
29 February 2008 Asian Economic Outlook and Strategy — Growth and Inflation Risks
27
Figure 21. Model Portfolio (Asia/Pacific
ex-Japan ex-Pakistan) Percentage
Weighting Over/Under MSCI Benchmark
Figure 22. Model Portfolio (Asia/Pacific
ex-Japan ex-Pakistan) Percentage
Weighting Over/Under MSCI Benchmark
Figure 23. Model Portfolio (Asia Japan
ex-Pakistan) Percentage Weighting Over/Under
MSCI Benchmark
-13 -11 -9 -7 -5 -3 -1 1 3 5 7
Hong Kong (9.5) Korea (15.2) Taiwan (11.2) Malaysia (3.0) Aust/NZ (27.3) Pakistan (0.2) Philippines (0.6) Thailand (1.6) Singapore (4.6) Indonesia (2.0) India (8.6) China (16.2)
Underweight Overweight
-10 -5 0 5 10 15 20
Telecom (7.5)
Banks (16.8)
Utilities (2.9)
Consumer Discretionary (5.6)
Info. Tech. (11.2)
Industrials (12.1)
Energy (8.3)
Other Financials (7.6)
Consumer Staples (6.2)
Real Estate (8.3)
Materials (13.4)
Underweight Overweight
-10 -5 0 5 10 15
Banks (15.0)
Telecom (9.4)
Utilities (3.7)
Consumer Discretionary (6.2)
Materials (8.1)
Info. Tech. (15.3)
Consumer Staples (4.0)
Other Financials (6.6)
Industrials (14.3)
Real Estate (8.1)
Energy (9.3)
Underweight Overweight
Note: Numbers in brackets show neutral weights within MSCI Asia Free ex-Japan US$ Index as at Feb 18, 2008
Consumer Staples includes food & staples retailing, food beverage & tobacco, household products, health care equipment & services, and pharmaceutical & biotechnology.
Industrials include capital goods, commercial services & supplies and transportation.
Information Technology includes technology hardware & equipment, semiconductors and semiconductor equipment, software & services.
29 February 2008 Asian Economic Outlook and Strategy — Growth and Inflation Risks
29
30