Journal of Multinational Financial Management 10 (2000) 275 – 295
Executive stock options: volatility, managerial
decisions and agency costs
David Brookfield *, Phillip Ormrod
Department of Economics and Accounting,Uni6ersity of Li6erpool,Li6erpool L69 3BX, UK Received 15 July 1999; accepted 22 February 2000
Abstract
This paper proposes a new rationale for understanding managerial contracts which set-out to induce stock price volatility in the form of granting of executive stock options. First, we suggest that previous research focuses too much on short term volatility effects and offering neither a theoretical or empirical perspective on incentives which might influence long-term behaviour. To address this, we offer a theoretical structure of why managerial incentives might be important in determining the evolution of volatility over the life of an option contract and provide empirical support for our views. Second, we examine the impact of option moneyness on managerial behaviour over time and provide an analysis, with supporting empirical work, of the unintended incentives thereby created. Our approach suggests that volatility-inducing contracts do not work in the intended manner and supports a growing body of work which indicates that option-based remuneration does not incentivise managers to enhance corporate performance. Our evidence is within a UK context, based on a near-population sample size. © 2000 Elsevier Science B.V. All rights reserved.
Keywords:Stock options; Volatility; Risk
JEL classification:G3
www.elsevier.com/locate/econbase
1. Introduction
Executive stock option schemes have been identified as a means of reducing the agency problems which exist between managers and stockholders and have now
* Corresponding author. Tel.: +44-151-7943038; fax:+44-151-7943028.
E-mail address:[email protected] (D. Brookfield).
become a popular component of managerial compensation packages (Pavlik et al., 1993). However, researchers have found it difficult to identify an appropriate measure of the performance incentives provided by option-based remuneration contracts and cannot, therefore, unequivocally ascribe changes in corporate perfor-mance to the granting of options (Yermack, 1995). The purpose of this paper is not to replicate studies which associate the existence of option-based remuneration with general aspects of corporate performance (mostly, in terms of firm value as in Smith and Watts, 1992; Gaver and Gaver, 1993; Matsunga, 1995; Main et al., 1996; Yermack, 1998, for example). Instead, we aim to provide a theoretically consistent framework which might provide an important perspective on corporate return volatility, as one measure of corporate performance, and offer an explanation for the pattern of volatility that subsequently emerges. In undertaking this task we draw a distinction between short and long-term volatility effects which can arise for different reasons. The identification of a volatility effect, per se, is not knew since studies relating option granting and volatility are numerous (eg. Amihud and Lev, 1981; Brickley et al., 1985; Agrawal and Mandelker, 1987; DeFusco et al., 1990; John and John, 1993; Mehran, 1995), but our departure from previous work is to demonstrate that the existing perspective is possibly too restrictive in its view of appropriate temporal effects and not sufficiently underpinned by a theoretical structure which explains management incentives over the life of the option contract. In analysing the effects of the granting of stock options empirical studies have been concerned with two broad themes. Firstly, with the investigation of whether positive abnormal stock price returns are observed following the announcement of executive options and other incentive plans (the ‘price’ effect) and, secondly, with the question of whether stock price returns exhibit greater volatility following the approval of an executive stock option scheme (the ‘volatility’ effect).
The first of these types of study has examined the notion that stock prices will respond positively to an unexpected announcement of the granting of stock options (Executive Stock Options Schemes, or ESOS) due to, inter alia, reduced agency costs from improved incentives, favourable signals of future performance, and shared taxation benefits. The second type of study has focused on the idea that agency costs are created by the excessive risk aversion of managers compared to stockholders (Amihud and Lev, 1981). Managers’ exposure to risk is altered by ESOS because of the asymmetric payoffs which provide downside protection for managers inducing them to undertake higher risk projects than would otherwise be the case. The reason why this may come about derives from the Black and Scholes (1973) option pricing model which argues that the value of call options increases as stock price volatility increases. In the context of executive stock options this would provide an incentive for managers to increase the variability of equity returns either
by accepting riskier projects and/or by increasing the level of financial leverage of
D.Brookfield,P.Ormrod/J.of Multi.Fin.Manag.10 (2000) 275 – 295 277 The nature of the methodology in investigating volatility effects has been to establish empirically whether there has been a significant difference in stock price volatility in the period after the issue of ESOS, compared to the period prior to issue, and to examine wealth transfer effects between stockholders and bondhold-ers. Other empirical tests have investigated whether stock prices exhibit greater volatility following the issue of executive options in relation to a comparable period prior to such an issue and whether, as a response to the increased volatility, bond prices have fallen. For example, Agrawal and Mandelker (1987) argued that where management compensation contracts were in the form of options and were signifi-cant, managers will select variance increasing corporate investments. They used
data for up to days −120 and +120 around the announcement date and their
findings supported their hypothesis. Thus, they concluded that executive option schemes had a role in decreasing managerial incentive problems arising from excessive risk aversion. DeFusco et al. (1990) found an increase in stock return variance and the implied variance of traded stock options. They used monthly and daily data, for intervals of up to 24 months and 500 days, respectively, before and after the announcement of a change in option plan. Additionally, they found a significant positive stock price reaction and a significant negative bond price reaction to the issue of executive options. This evidence is consistent with the notion that such plans may induce a transfer of wealth from bondholders to
stockholders and is therefore supportive of the incentive/agency hypothesis. Gucseli
and Ho (1993) attempted to test empirically the risk-taking and wealth-transfer effects of ESOS in the UK. They failed, however, to find either a significant stock price or bond price reaction. Nevertheless, they did report a significant increase in market adjusted stock price volatility for the 250 day and 500 day periods following the issue of executive options but failed to find any significant increase in volatility in the 700 day period following issue.
2. Analytical framework
It has been argued (Agrawal and Mandelker, 1987) that the total wealth, W, of
a manager may be divided into three main categories: stock and option holdings in
the employing company, Ws; human capital, representing the present value of
future employment earnings, Wh; and other assets unrelated to the firm,Wo. IfWs
and Woare small then managers’ corporate investment and financing decisions are
likely to be influenced by their impact on human capital. Specifically, if the firm performs badly, three effects on human capital have been argued to arise: first, current remuneration falls, (Murphy, 1985); second, potential earnings in alterna-tive employment fall (Amihud and Lev, 1981); and third, if the firm fails, then firm specific human capital is lost. Thus, to the extent that managers’ human capital is correlated with changes in firm value, decisions which increase the variance of returns will increase the variability of human capital. Given a degree of risk aversion in managers, there are incentives for managers to select variance
decreas-ing investments and forms of financdecreas-ing. If Ws is significant relative to Wh the
traditional analysis becomes less clear. To the extent that Wsconsists of executive
options, it is traditionally argued that the asymmetric payoffs providing downside protection for managers make it more likely they will undertake risky investments and forms of financing. The justification lies within the Black – Scholes model which argues that the value of this call option is an increasing function of the variance of
cash flows. Given this, Ws provides an incentive for managers to increase risk and
Wh an incentive to reduce risk. Thus, the net effect is an empirical question,
depending on a variety of variables including the degree of risk aversion of managers and the respective proportions of wealth in human capital and options. The issuing of executive options, per se, does not therefore make managers risk-seeking. Rather, at the margin, they are argued to have a greater propensity to take risky decisions than would have been the case in the absence of such options. Our extension of this framework involves an examination of the dynamics of managerial behaviour to changing conditions which can alter response to continued
ownership of stock options. In other words, we argue that the proportions of Ws
and Wh to W alter with the passage of time in a way that leads to testable
be-D.Brookfield,P.Ormrod/J.of Multi.Fin.Manag.10 (2000) 275 – 295 279 haviour, as incorporated in our ex post model, then provides a rationale for potentially perverse results to arise in which managerial response can be the opposite of what is expected when options are granted. Our suggestion is, therefore, that the original intention of granting options in terms of inducing greater risk-taking is undermined by a rational response to the evolution of evidence
regarding managerial/corporate performance.
2.1. Model I — the ex ante model
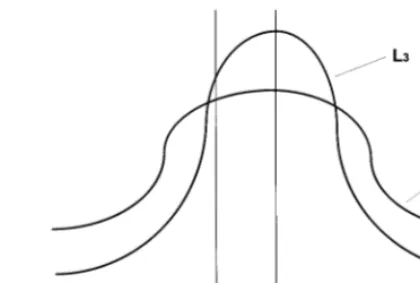
Commencing with a simplified and very short term model represented in Fig. 1,
assume that a manager has two investment opportunities available, H0 and L0,
where H0 is high risk and L0 is low risk. The decision is taken today, t0. Each of
the investments has an expected mean NPV of zero. Stock options are granted
at-the-money, thus the exercise price, X, equals the current market price, M0. It is
assumed that the sole method of managerial remuneration is in the form of options. Finally, the outcome of the project (the NPV) becomes known immediately and options are exercised immediately.
In Fig. 1 it can be seen that managers will prefer investment H0 as they do not
participate in the left-hand side of the distribution, and there is greater upside
potential in H0than in L0. Indeed, it could be the case that even if there is a small
negative NPV, and thus an expected fall in stock price, risk averse managers are
still likely to prefer investment H01. This is clearly dysfunctional as in this latter
Fig. 1. Stock options are granted at the beginning of period 1 (t0), at which point both the exercise price, X, and the market price of the stock, M0 are equal. Managers prefer projects which induce greater
volatility, such as in distributionH0, because they participate in greater upside potential without facing
any downside risk.
1Empirical evidence also suggests that the in-the-money effect applies immediately on issue of the
Fig. 2. By periodt3stock price has trended upwards from its original point at M0 toM3.H3andL3
represent the high variance and low variance new investment opportunities, respectively, for which decisions have to be made att3. Employees holding stock options now participate in downside risk to
the extent of area under the curves between M0 and M3 because the mean of the stock return
distribution at periodt3is now represented byM3.
case stockholders would reject both projects, even if risk neutral. Under such circumstances we would expect, in common with other researchers, to observe an increase in the variance of returns over the life of option contracts which is the empirically observed short-term response to option-based remuneration.
2.2. Model II — the ex post model
In terms of our model outline, consider now the situation of a longer term option
contract where after, say, 3 years, t3, options are in-the-money, thusM3\X. This
is perhaps as a result of a general upward drift in the market, the industry or indeed because of company specific manager decisions.
In Fig. 2, managers now participate in the downside risk of any decisions in that the current value of options may fall. While there is still some downside protection,
where stock price falls below M0, deep-in-the money options may be of such value
that if, in the extreme, they fall to zero, risk averse managers may now preferL3to
H3, even though the expected value of payoffs fromH3is greater. In this situation,
however, such options may cease to be dysfunctional, in the sense of inducing excessive risk seeking behaviour, even if they were the sole form of remuneration
(i.e.W=Ws). This is because, despite the positive expected value to managers from
H3 andL3, their risk-return utility functions may be such that the downside risks,
despite their protection below a zero option value, may be weighted more highly than the upside payoffs.
D.Brookfield,P.Ormrod/J.of Multi.Fin.Manag.10 (2000) 275 – 295 281 typically tied to continued employment with the option-granting firm and had either to be exercised or allowed to lapse on resignation. Moreover, under UK tax law granting tax free status for ESOS, the legal rights were not transferable and were specific to the individual. It is conceivable that executive share option schemes could be hedged in other ways but the widespread evidence of early exercise (on average 6.6 years) and the complete lack of evidence in our sample of such transactions (which would be disclosed under the provisions of the Companies’ Act, 1985) lead us to conclude that hedging was not a feature of our sample. Support from recent literature regarding the non tradable and non hedgable nature of executive options is widely available. This has been developed using utility maximis-ing models (for example Huddart, 1994) and also usmaximis-ing an exogenous stoppmaximis-ing state model (for example Carpenter, 1998).
Further evidence of the non tradable and non hedgable nature of executive options suggests that hedgability and tradability restrictions imposed by regulation are effective. In particular, managers are observed to exercise their options signifi-cantly before expiration, thereby giving up any additional time value which might have been captured by trading or hedging activities. Empirical evidence of early exercise in the US includes Cuny and Jorion (1995) and Huddart and Lang (1996). In the UK there is similar evidence, for example Income Data Services (1998). We do presume that managers are risk averse for the events described in the diagrams to materialise but ultimately leave this presumption to be resolved by the evidence which we present below. What we do say is that non-tradability and
non-hedgabil-ity can give rise to the circumstances indicated. Thus, in the situation at t3, three
years into the option, the incentive for managers to take risks in respect of their
deep in-the-money options is significantly reduced compared tot0, at the grant date,
where options are at-the-money and the downside protection is more immediate to
current values (X=M0). In this former case, far from options counter-balancing the
risk aversion effects of human capital, Wh, they might, for deep in-the-money
options, actually enhance risk aversion, given the particular sensitivity of option values to underlying market values. Paradoxically, in this situation, agency costs may be increased by an ESOS scheme as risk averse managers are tempted to become even more risk averse in an attempt to protect historical gains in their options in the face of the extreme volatility which can be exhibited by this particular financial instrument. Thus, the model of behaviour outlined in this paper would predict that, ceteris paribus, volatility would decrease over time as options became increasingly in-the-money and managers shared increasingly in the down-side potential of their decisions.
3. Methodology
The methodology outlined in Skinner (1989) and in DeFusco et al. (1990) is employed, whereby pre and post granting variances in stock returns are compared. Our approach extends this, however, to observe the nature of variances over a longer time-horizon and examines variances in discrete, rather than cumulative, post granting periods. Our time horizon for investigation is set at four years in the post-granting period divided into eight half year periods. We control for changes in market risk by standardising all variance estimates by contemporary estimates of market variance.
3.1. Model I — the ex ante model
Our conjectures outlined in model I, the ex ante model, are tested against the experience of other researchers using a unique data source and improved grant date resolution, and over a longer time horizon in order for the effects of movements in stock prices to have time to impact on the volatility of returns. The experience of other researchers is to observe an increase in volatility following the granting of options. The reference point is the pre-grant variance at which exercise prices are set and managers are then incentivised to act accordingly (by increasing the variance of returns). Our ex ante model I prediction may be summarised thus:
Test 1: The alternative hypothesis of the ex ante model is that we observe variances increasing as a response to managers being immunised to exposure from downside risk of investment decisions.
To this end, variances in stock returns over eight, 6 monthly intervals in the post-granting period are compared by reference to the pre-grant period. Previous studies usually exclude consideration of the granting period from the analysis because of possible contamination of the results due to uncertainty of the grant date. This is not the case here because we have certain knowledge of the grant date. Nevertheless, we replicate the usual approach to compare our results. Evidence is reported in Table 1.
3.2. Model II — the ex post model
D
Variance ratios following the adoption of executive stock option schemes: full sample results 1984–1995a
Average Ratio of post Median Maximum Minimum Percentage Z Two-tailed variances\pre
variance grant variance variance variance variance signed-rank
grant variance probability for
5.543 1.103 22.404 0.976 62 3.296 0.007
2nd post grant 4.293
period
3rd post grant 5.474 1.090 3.908 37.707 0.765 57 2.566 0.0052
period
5th post grant 4.410 0.878 2.911 20.341 period
5.148 23.944 0.036 64 2.635 0.0043
7th post grant 5.882 1.171 period
0.866 63 2.001 0.0228
3.393
8th post grant 6.636 1.321 35.815
period
aVariances are averaged over 61 companies which are calculated for each 125 day (half year) period in the post-grant period. Nine periods are represented
in total including the first period which is the pre-granting period. The granting window is excluded. Variances ratios are calculated by reference to the pre-grant period (Vart/Var(pre-grant period)). The column headed ‘Z’ refers to the standard normal value derived from the Wilcoxon signed-rank test which
in-the-money options whilst out-the-money options might exhibit an increasing variance profile. Our model II predictions are summarised thus:
Test 2: For in-the-money options, the alternative hypothesis of the ex post model is that we observe variances decreasing as a response to managers being increas-ingly exposed to the downside risk of investment decisions.
Test 3: For out-the-money options, the alternative hypothesis for the ex post model is that we observe variances increasing as a response to a situation in which managers do not participate in option-based remuneration because of their
failure to adopt projects which would produce in-the-money options2
.
In a sense, Test 2 is a bad result for the company created by good managers in that the company does not experience greater risk (and hence return) because managers are protecting their unrealised gains. Test 3 has quite the opposite impact in that it produces a good (or intended) result for the company, but brought-about by bad managers. The increase in risk likely to be observed under Test 3 conditions is not likely to be the risk shareholders may wish to be exposed to.
4. Data and sampling
Data has been obtained from the archives of the General Announcements Office of The London Stock Exchange and represents source information. The data archives include records of all changes in the stock options of managers as they are required to be notified under the Stock Exchange Listing Agreement. A key advantage of the data source is that it contains a Stock Exchange stamp of the time of information release to the market, generally to the nearest minute. This enables the event date to be determined accurately.
The initial sample size was 120 companies granting options which, for the time period examined, represents a number close to that of the original population of companies granting options. The type of companies selected varied from listed companies with a market capitalisation as low as £100 million to the major UK listed companies, the intention being to give as wide a picture as possible. However,
2Test conditioning: we are aware that by sub-sampling on the basis of moneyness we may be
D.Brookfield,P.Ormrod/J.of Multi.Fin.Manag.10 (2000) 275 – 295 285 close examination of the data source revealed a number of potential data problems which we account for. Perhaps the most serious of these was the practice of issuing options up to the maximum permitted under tax legislation, not at one time, but over a period of years in a series of tranches. This creates the problem in examining intertemporal volatility of having overlapping options. Where, for instance, there are a series of options held with varying termination dates the changing incentives to take risks identified above are likely to cancel each other out, to a large extent. To overcome this problem, all companies which had multiple grants were excluded. This left a final sample of 61 companies which had only one grant of options in the period under investigation. By stratifying the population in this way, we increase the focus of our study by concentrating on those companies which have clear incentives arising from options contracts but it remains a comparable sample to
previous research (eg DeFusco et al., 1990)3
.
Turning to the sampling period, stock option schemes for employees have been eligible for tax relief since the Finance Act 1980 but executive stock option schemes have only qualified for Inland Revenue approval since the Finance Act 1984. Given the focus on the latter type of scheme, the relevant earliest date for sampling is, therefore, April 1984. Sampling took place up to 1995, thus the sample period covered was 1984 – 1995.
5. Results and analysis
5.1. Model I
The first test is to examine the pattern of variances over the 4 year period following the granting of options and sub-categorise the analysis by examining variance ratios referenced to the pre-granting period only. Wilcoxon signed rank tests are normally employed to test significance and are used here in testing Tables 1 – 3. Table 1 details the results for Test 1.
In all of the tables market-adjusted variances are used such that each variance is divided by the variance of the market index. On an average basis, the ratio of the first post-grant variance to the pre-grant variance is above one which ostensibly confirms earlier work in Skinner (1989) and DeFusco et al. (1990). However, the pattern of average variances in subsequent post-grant periods is not consistently increased. Whilst not calculated in the body of Table 1, the ratios of median variances are consistent with that of the average variances by reference to the pre-granting variance. On an average basis, therefore, the granting of options for a wide range of companies would support only the broad contention that volatility was increased as a consequence of the granting of options.
From a more detailed perspective, where both the sign and strength of variance ratios are measured on a company by company basis, a consistent pattern emerges
D
Variance ratios following the adoption of executive stock option schemes: in-the-money options sub-sample. 1984–1995a
Ratio of post Median
Average Maximum Minimum Percentage Z One-tailed
variances\pre
variance signed-rank
variance
variance grant variance variance
to pre- grant grant variance probability for
variance change
5.329 0.996 22.404 0.976 61.7 2.846 0.0023
2nd post grant 4.271
period
3rd post grant 4.700 0.879 3.879 27.132 0.765 57.4 2.021 0.0212
period
5th post grant 3.812 0.713 2.560 20.341
period
2.463 23.944 0.036 54.5 1.958 0.0250
7th post grant 5.298 0.991 period
0.866 58.6 1.285 0.1003
1.571
8th post grant 4.346 0.813 35.815
period
aVariances are averaged over 47 companies which are calculated for each 125 day (half year) period in the post-grant period. Nine periods are represented
in total including the first period which is the pre-granting period. The granting window is excluded. Variances ratios are calculated by reference to the pre-grant period (Vart/Var(pre-grant period)). The column headed ‘Z’ refers to the standard normal value derived from the Wilcoxon signed-rank test which
D
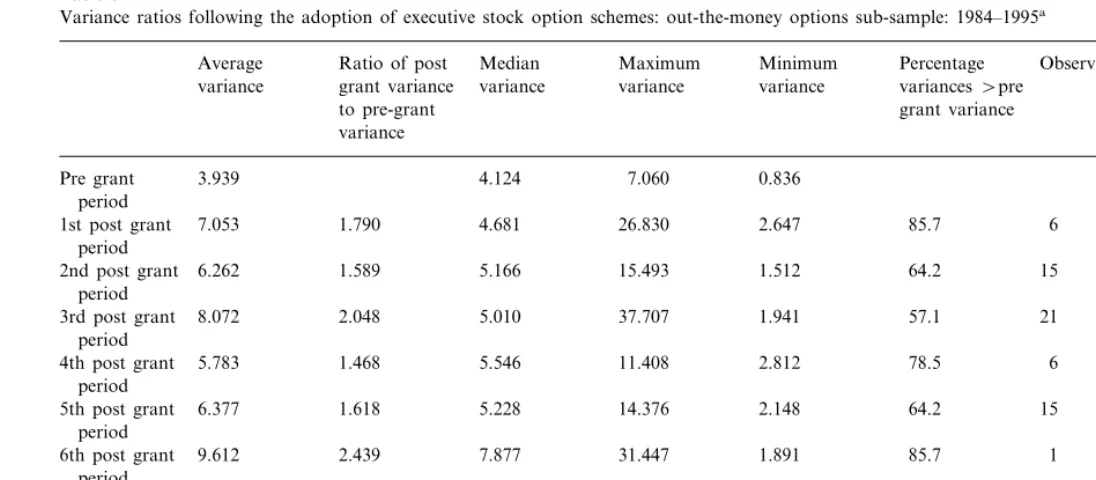
Variance ratios following the adoption of executive stock option schemes: out-the-money options sub-sample: 1984–1995a
Average Ratio of post Median Maximum Minimum Percentage ObservedT CriticalTat variances\pre
6.262 1.589 15.493 1.512 64.2 15 21
2nd post grant 5.166
period
1.941
3rd post grant 8.072 2.048 5.010 37.707 57.1 21 21
period
5th post grant 6.377 1.618 5.228 14.376 period
6.798 14.603 2.955 90.9 0 11
7th post grant 8.168 2.073 period
3.593 100.0 3 11
4.657
8th post grant 5.929 1.505 12.538
period
aVariances are averaged over 14 companies which are calculated for each 125 day (half year) period in the post-grant period. Nine periods are represented
in total including the first period which is the pre-granting period. The granting window is excluded. Variances ratios are calculated by reference to the pre-grant period (Vart/Var(pre-grant period)). The column headed ‘ObservedT’ refers to the Wilcoxon signed-rank test, small sample variate which measures
of increased variance over the full time horizon sampled. For example, in all cases the number of companies experiencing a variance increase is at no point below 50% of the sample, with the highest proportion reflected in the first post-grant period.
This result is reflected in the large-sample, Wilcoxon-based Z-statistic which
suggests that, with the exception of post grant periods 4 and 5, firms in the sample experienced variance increases at a statistically significant level. For variances referenced to the pre-grant period, therefore, we could not accept the null hypoth-esis implied in test 1 that the granting of options has no effect on the long-term pattern of volatility. Such a result confirms and extends the general findings of earlier US-based work based on shorter and cumulative sampling horizons. Broadly, therefore, we cannot find any evidence which might suggest that a longer-horizon view, based on a broad sample, offers a perspective on managerial behaviour which is different to that found at shorter sampling horizons. In essence, option-based contracts appear to incentivise managers to increase the risk profile of their organisations.
5.2. Model II
The results for tests 2 and 3 are reported in Tables 2 and 3, respectively, and represent sub-samples of the data reported in Table 1. The separation of the data is based on dividing the sample into in- and out-the-money options defined on the basis of the pattern of stock prices compared to exercise prices (the prices ruling at the grant date). For example, if a company’s stock price at the end of year 3 (the earliest date which exercise is allowed) is less than the stock price at the time of granting then the option is defined to be out-the-money. In-the-money options are analogously defined. This approach identifies a decision-point in the life of the option contract such that managers are now able to exercise their options and, hence, moneyness becomes tangible. Table 2 provides the details for in-the-money options and comprised a sample of 47 companies.
On the basis of the ratio of post-grant in-the-money average variances to the pre-grant period we observe an initial increase followed by ratios which universally suggest a decline in variance. For the most part, there is a higher proportion of companies that experience an increase in variance as opposed to a decrease but, it appears, the size of the increase (as opposed to its direction) is marginal compared to the overall sample represented in Table 1. This observation is supported by the
Z-statistics which present an equivocal pattern of the evolution of variances and
D.Brookfield,P.Ormrod/J.of Multi.Fin.Manag.10 (2000) 275 – 295 289 period. If the pre-grant variance is in any way accepted as a normal measure of volatility (which it may well be if it represents the period when the decision is made to grant options) then options do not induce managers to take riskier decisions when it is likely that they will participate fully in the distribution of returns, including the downside.
Table 3 provides the comparator analysis for out-the-money options with a sub-sample size of 14. The relatively small sample against in-the-money variances is to be expected in a generally inflationary environment, which was the experience in the sample period. Table 3 reports evidence of average variance increases over the sample horizon and the analysis is confirmed when variances are calculated on a median basis. The detail, on a company by company basis, reinforces the summary results in that the proportion of companies experiencing variance increases is universally above 50%. For all but one of the post-grant periods in Table 3 the
small sample Wilcoxon test statistics are significant at 95%4. It appears, therefore,
that variance increasing activities are substantial which provides support to an incentive structure that managers are choosing projects on the basis that, with
respect to option values at least, they have little to lose personally5. In this situation
it is quite possible that another perverse result emerges. Given the background of rising stock prices generally, the 14 companies comprising the sample in Table 3 have done particularly badly: so much so, that managers have overcome systematic increases in corporate value so at to reduce the value of their own organisations. On these grounds, it may be reasonable to argue that Table 3 measures variances which could be attributable to the managers (and in a conservative manner given the off-setting effects of systematic variance reductions), who have already demon-strated their inability to improve the fortunes of their companies. To then induce such managers to take riskier investment decisions does not seem, on the face of it, an act which is likely to maximise shareholder wealth.
One further observation is also relevant. Assuming the sub-samples to be truly disjoint in the sense that the sample partitioning properly reflects the characteristics of in- from out-the-money options, then it is true to say that the total sample variance analysis represented in Table 1 is inflated by the incorporation of variances of companies who exhibit out-the-money characteristics. The analysis of volatility response to option granting should therefore be conducted, we would argue, on the grounds of stratified samples based on options being in- or out-the-money, as expressed in Tables 2 and 3. By doing this, we suggest that the analysis more accurately reflects the incentive structures managers face in holding options from which clearer intertemporal effects may be discerned. A more consistent
explana-4The observed test statistic,T
0has to be less than it critical counterpart for the null to be rejected.
See Table G, Siegal, 1956.
5In such a situation, managers face only potential losses to human capital,W
h, since the value of
option holdings in Ws is at its minimum value of zero. It could be argued that any response by
tion for existing findings might then be related to a misinterpretation of immediate post grant variance increases and a failure to recognise the role of options being in-or out-the-money. With respect to the first point, it may be argued that the initial increase in variance is not necessarily a function of the incentivisation of managers. Rather, it seems more plausible that the granting of ESOS may produce uncertainty amongst investors as to the potential response of managers to the creation of a highly volatile reward system. This would be a market phenomenon and is independent of actual managerial investment and financing decisions. Moreover, it might be unrealistic to expect variance-inducing projects to be reflected in corporate volatility so soon after the granting of options. The significance of this point rests with a recognition of measuring the impact of options on managerial behaviour over an appropriate time horizon. The (usual) cumulative approach is to measure the impact of granting over different lengths of time but with the same starting point. Thus, a typical approach would involve the measurement of variance from some time shortly after the granting in projections of increasing length from the same starting point (as in DeFusco et al., 1990; Gucseli and Ho, 1993). However, this cumulative approach to analysing volatility fails to separate any initial market response to the issuing of an ESOS from longer term changes in managerial investment and financing decisions over the life of the option contract. This method, furthermore, does not tackle the apparent contradiction of why variances are not significantly increased when options are still yet to be exercised in periods
more relevant to the life of an option (3 – 10 years)6. Thus, the existing approaches,
by limiting their time horizons and the way in which variances are referenced, run the risk of confusing an initial response of the market to the issue of options which induce managers to engage in making riskier (volatility-inducing) investment decisions.
In sum, proponents of the argument that the granting of options has a volatility-inducing impact on managerial behaviour universally cannot sustain such a view over the longer-term when presented with the evidence of Table 2. We offer the market-based view as a possible explanation for our different results, although we do suggest that undiscriminating analysis of this kind, which does not reflect the ‘moneyness’ in stock options, may be subject to the very large variances of companies run by managers holding out-the-money options. For this reason, we suggest, the sampling time horizon is therefore a relevant perspective.
6. Leverage effects
One possible source of change in volatility over time may be due to alterations in financial risk arising from changes in gearing and, as such, may be independent of managerial influences. If firms are levered, then, even if the manager does not actively influence asset variance or firm leverage, growth in asset value will cause
D.Brookfield,P.Ormrod/J.of Multi.Fin.Manag.10 (2000) 275 – 295 291 leverage to decline (and vice versa for a decline in asset value). This will cause the volatility of equity returns to decline in the same way that a call option’s volatility declines as its asset value increases. Consequently, firms with options that, for example, end-up out-the-money will tend to have higher growth in stock return
volatility than firms with options that end-up in-the-money7. Thus, it may be the
case that we simply observe volatility changes which are due to leverage effects and hence, not necessarily, attributable to the existence of stock options.
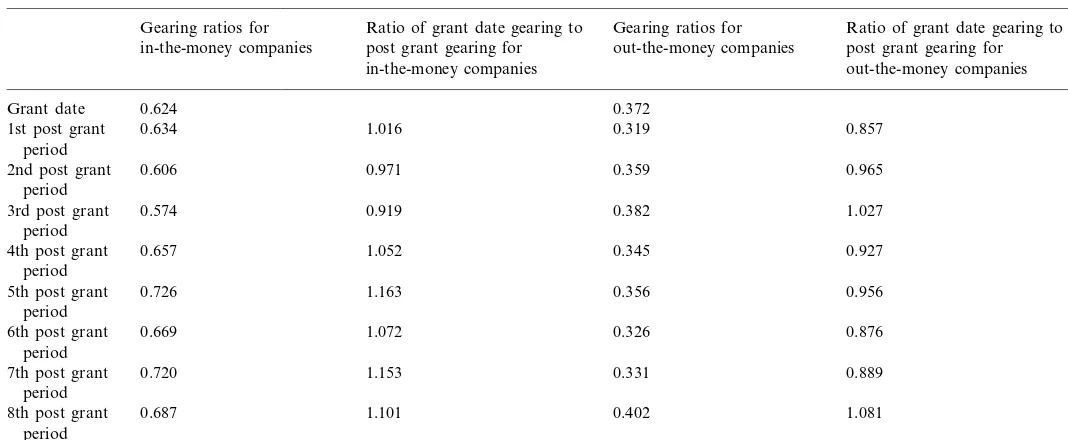
In order to examine the potential impact of changes in leverage, we report in Table 4 average gearing over the grant and post grant periods for the samples conditioned on option moneyness. Gearing data is extracted from Datastream and is defined as the ratio of the debt to capital employed. For in-the-money companies we would expect a fall in the gearing ratio as asset values increase. For out-the-money companies we would expect a decrease in gearing.
The table reveals, for in-the-money options that, on average, gearing has increased by about 7% over the sample period. There were no outliers in the sample. Under such circumstances we would expect an increase in the financial risk of the companies with a corresponding increase in variance of returns. In fact, what we do observe is that those periods with the most marked increases in variance (periods 1, 2, 3 and 6) are not closely matched by periods when large changes in gearing were apparent (periods 1, 4, 5, 6, 7, and 8). Whilst there may exist complex lag structures in the response of financial risk to gearing changes, such effects do not appear discernible from the evidence presented. Nevertheless, the general images of reduced risk and increased gearing reinforce our results and make our conclusions more conservative. For out-the-money options, we observe a decline in gearing over six out of the eight post grant periods. On its own, this might suggest a reduction in financial risk. If that is the case then the increases in operating risk indicated in Table 3 was more than that reported if the general background of financial risk was in decline. As with in-the-money options, the assessment of our results is made more conservative because of the impact of gearing.
7. Conclusions
We have proposed models of managerial response to incentive structures put in place by the granting of stock options and tested these against a representative sample refined on the basis of the pattern of multiple granting of options. Our analysis thus examines the incentives that may be put in place by the granting of options which may lead managers to focus on the impact of their investment and financing decisions on stock price volatility.
Our results, without segregation of the sample, support the conclusion that there are significant variance changes immediately following stock option granting, when referenced against the pre-granting variance benchmark. For the full sample,
7The inverse relationship between stock prices and volatility has been well-documented in the past
D
Leverage analysis following the adoption of executive stock option schemes: 1984–1995a
Gearing ratios for Ratio of grant date gearing to Gearing ratios for Ratio of grant date gearing to in-the-money companies post grant gearing for out-the-money companies post grant gearing for
in-the-money companies out-the-money companies
0.624
Grant date 0.372
1st post grant 0.634 1.016 0.319 0.857
period
aGearing ratios are provided for both in-the-money and out-the-money samples. Nine periods are represented in total which include gearing at the date
D.Brookfield,P.Ormrod/J.of Multi.Fin.Manag.10 (2000) 275 – 295 293 variance increases were found when assessed by the Wilcoxon signed-rank test. The methodology involved examining a series of discrete intervals post granting, rather than the approach in the existing literature of investigating cumulative periods. Notwithstanding this, the results support earlier, US-based work which suggests that variance increases following the granting of options. Our perspective does not suggest that taking a longer time-horizon, more consistent with the time to maturity of the option, contradicts such work.
The second stage of our study departs from the approach in the existing literature in analysing a division of the sample with respect to whether options are in- or out-the-money. The purpose of distinguishing on these grounds is to give a perspective on managerial response in a realistic environment in which managers are able to respond dynamically in making risky investment and financing deci-sions. Our tests have also included an analysis of firm leverage to discount any potential contamination of our results due to changes in financial risk alone. The incentive structure for in-the-money options might possibly suggest a risk reduction strategy as managers seek to protect the accumulated gains that have arisen over time. Our results suggest that there is a small increased variance in the initial post granting period, but subsequent intervals indicate a mixed response, at best. The initial variance increase is explained as a market phenomenon, rather than the result of increased risk-taking by managers as suggested in the current literature. The subsequent reduction in stock price variance observed in Table 2 contradicts the existing literature, but is consistent with the behavioural model developed in this paper which argues that managers with deep in-the-money options will, given the volatility of ESOS values, become not less risk averse, but more risk averse. This result also explains the problem in some existing work of why increased volatility has been found initially, relative to the pre grant period, but diminishes thereafter, notwithstanding the fact that the option contracts are still in issue.
Acknowledgements
This study was supported by a grant from the Research Board of the Institute of Chartered Accountants in England and Wales. Thanks are due to Bill Morrison, Julian Proctor and Jason Laws for research assistance and also to Lesley Newbury, Chris Knapp and Christine Jackson of the London Stock Exchange. The authors gratefully acknowledge access to data archives of the Exchange and for comments at seminars to INQUIRE, UK; Strathclyde University; the European Institute for Advanced Studies in Management, Brussels; Liverpool John Moores University and particularly to Richard Morris, Craig Heimstra and Arthur Thomas.
References
Agrawal, A., Mandelker, G., 1987. Managerial incentives and corporate investment and financing decisions. J. Financ. 42, 823 – 837.
Amihud, Y., Lev, B., 1981. Risk reduction as a managerial motive for conglomerate mergers. Bell J. Econ. 12, 605 – 617.
Black, F., Scholes, M., 1973. The pricing of options and corporate liabilities. J. Polit, Econ. 81, 637 – 654. Black, F., 1976. Studies of stock price volatility changes. In: Proceedings of the 1976 Meeting of the
American Statistical Association, Business and Economics Statistics Division.
Brickley, J., Bhagat, S., Lease, R., 1985. The impact of long-range managerial compensation plans on shareholder wealth. J. Account. Econ. 7, 115 – 129.
Carpenter, J.N., 1998. The exercise and valuation of executive stock options. J. Financ. Econ. 48, 127 – 158.
Cuny, C., Jorion, P., 1995. Valuing executive stock options with an endogenous departure decision. J. Account. Econ. 20, 193 – 205.
Datastream, 1991. Equity Research. Datastream International Ltd.
DeFusco, R., Johnson, R., Zorn, T., 1990. The effect of executive stock option plans on stockholders and bondholders. J. Financ. 45, 617 – 617.
Diamond, P.A., Stiglitz, J.E., 1974. Increases in risk and risk aversion. J. Econ. Theory 3, 156 – 168. Gaver, J., Gaver, K.M., 1993. Additional evidence on the association between the investment opportu-nity set and corporate financing, dividend and compensation policies. J. Account. Econ. 16, 125 – 160. Gucseli, S., Ho, T.S., 1993. Risk taking and wealth transfer effects of executive stock option schemes:
UK evidence, University of Lancaster, working paper.
Haugen, R., Sennet, L.W., 1981. Resolving the agency problems of external capital through options. J. Financ. 36, 619 – 648.
Huddart, S., Lang, M., 1996. Employee stock option exercises: an empirical analysis. J. Account. Econ. 21, 5 – 43.
Huddart, S., 1994. Employee Stock Options. J. Account. Econ. 18, 207 – 231.
Income Data Services, 1998. Executive Share Options, Research File 32, IDS Management Pay Review. Jensen, M., Meckling, W., 1976. Theory of the firm: managerial behaviour, agency costs and ownership
structure. J. Financ. Econ. 3 October, 305 – 360.
John, T.A., John, K., 1993. Top management compensation and capital structure’. J. Financ. 48, 949 – 974.
Main, B.G.M., Bruce, A., Buck, T., 1996. Total board remuneration and company performance. Econ. J. 106, 1627 – 1644.
Matsunga, H., 1995. The effects of financial reporting costs on the use of employee stock options’. Account. Rev. 70, 1 – 26.
D.Brookfield,P.Ormrod/J.of Multi.Fin.Manag.10 (2000) 275 – 295 295 Murphy, K.J., 1985. Corporate performance and managerial remuneration: an empirical analysis’. J.
Account. Econ. 7, 179 – 203.
Ormrod, P., Brookfield, D., 1996. Director share option schemes and market signalling, Liverpool University, 1 – 26, working paper.
Pavlik, E., Scott, T., Tiessen, P., 1993. Executive compensation: issues and research. J. Account. Lit. 12, 131 – 189.
Siegal, S., 1956. Nonparametric Statistics. McGraw – Hill, New York.
Skinner, D., 1989. Options markets and stock return volatility. J. Financ. Econ. 23, 61 – 78.
Smith, C.W., Watts, R.L., 1992. The investment opportunity set and corporate financing, dividend, and compensation policies. J. Financ. Econ. 32, 263 – 292.
Yermack, D., 1995. Do corporations award CEO stock options effectively? J. Financ. Econ. 39, 237 – 269.
Yermack, D., 1998. Companies’ modest claims about the value of CEO stock option awards. Rev. Quant. Financ. Account. 10 (2), 207 – 226.