THE IMPROVEMENT OF SUGAR DISTRIBUTION SYSTEM USING
VALUE STREAM MAPPING (VSM) APPROACH A CASE STUDY: INDUSTRI GULA
NUSANTARA, KENDAL, JAWA TENGAH
Muchamad Muchfi rodin
1, Henry Yuliando
1, Adi Djoko Guritno
11Department of Agroindustrial Technology, Faculty of Agriculture Technology, Gadjah Mada University, Jl. Flora No. 1 Bulaksumur, Yogyakarta 55281
Email: muchamad.muchfi [email protected]
ABSTRACT
This study was aimed to fi nd kind of improvements of sugar distribution system using value stream mapping (VSM) when some ineffi ciencies in physical and service activities were encountered that will cause wasting time. The VSM was directed to reduce non value added time as the performace parameter. VSM was used to analyze thus ineffi ciencies because using VSM can simply mapping to trace whole activities both of material and service fl ow from beginning to the end of process. A case study of Industri Gula Nusantara showed that in its service operations, there were an ineffi ciency in the process of issueing the loading order. Move thus activity a day earlier, the improvement sounds a shorter service time over order and delivery schedule which in further make a better operation and service over the whole process of sugar distribution. At same time a policy of safety stock or inventory leveling could minimize stock out occasion by the increasing of service level from 25% to 38% that was close to standard deviation of demand during lead time.
Keywords: Sugar, VSM, inventory
INTRODUCTION
Sugar distribution in Indonesia involves various parties, started from sugar cane farmers, sugar factory, distributors, retailers, consumers and governments. Availability of sugar in market is the responsibility of distributor to serve various regions, hence it requires high service level in distribution process. On the other hand, distributors must also consider the production rate of sugar factory and demand fl uctuations and volume in order to provide a quick response. Distributors also have to press down cost on sugar warehousing (Lee, 2006).
Because of the involvement of various parties, it might be increasing the occasion of ineffi ciencies in the distribution process. This ineffi ciency will reduce profi t and service response. Therefore, it is important to minimize such wasting time were encountered in either physical and administration process, where in this study it was approached by applying value stream mapping or known as VSM.
VSM is a tool that can visualize the process orienting to lean manufacture (Lee and Snyder, 2007). This tool is very helpful to give an explanation to streamline work processes. VSM widely refl ect the views of a process from external suppliers to external customers. The reason of using VSM
because it can help to observe whole streamline processes that simply to analyze and trace the ineffi ciency process that occurred from the beginning to the end of process. Silva (2012) stated the benefi ts of using VSM are : helps to see linked chain of processes and to envision future lean value stream, provides a common language and understand so that everyone has the same vision, integrates material and information fl ow.
VSM has a lot of help in reducing ineffi ciencies in production processes, organizations, services, and logistics. McManus and Millard (2002) have tried to use VSM to accelerate product development. Vinodh et al (2010), have been combining VSM with various lean manufacturing tools like 5s, kanban, kaizen (Gurumurthy and Kodali, 2011), and total productive maintenance to reduce processing time that impact to production costs and product prices in a camshaft industry in India. Vanany (2005) conducted a study on the use of value stream mapping to reduce unnecessary processes, defects, and determine inventory level on each department.
smaller size. In terms of improvement of the organizational structure, VSM can be used to measure leadership, behavior, and competencies (Emiliani and Stec, 2006).
VSM had helped in improving service levels in logistics service performance. The use of VSM can identify ineffi cient logistics processes that has complex supply chain Serano et al (2008). Another study conducted by Lehtinen and Torkko (2005) had succeeded in improving the performance of the food service industry towards lean production and lean supply by integrating suppliers and customers in terms of inventory, transportation, facilities, and information. The use of value stream mapping can be combined with other tools such as simulations, 5S and Kaizen which performed by Gurumurthy and Kodali (2011) that applied VSM to simulate and analyze ineffi ciency on jobshop production system in a furniture manufacture with some variation of the product where there was one dominant product.
This research is aimed to fi nd kind of improvements of sugar distribution system using value stream mapping (VSM) when some ineffi ciencies occured for the case of sugar distribution process of a sugar company Industri Gula Nusantara, Kendal, Central Java Province, Indonesia. Value sounds in VSM analysis of its company distribution process is drawn by mapping each stage of the process leading to added value. Therefore, value is an activity or transformation
of raw materials or information to meet consumers needs (Gasperz, 2007).
METHODS
Stages of values analysis of sugar distribution is adopted from Lee (2006) which had explored the VSM analysis into system observation, model mapping, determination of value added or non value added, identifi cation of waste, and performing restoration effort. Effi ciency can be measured by the ratio of value added time and non value added time. Output of VSM is used to make decision in inventory control policy to overcome the possible stockout.
System Observation
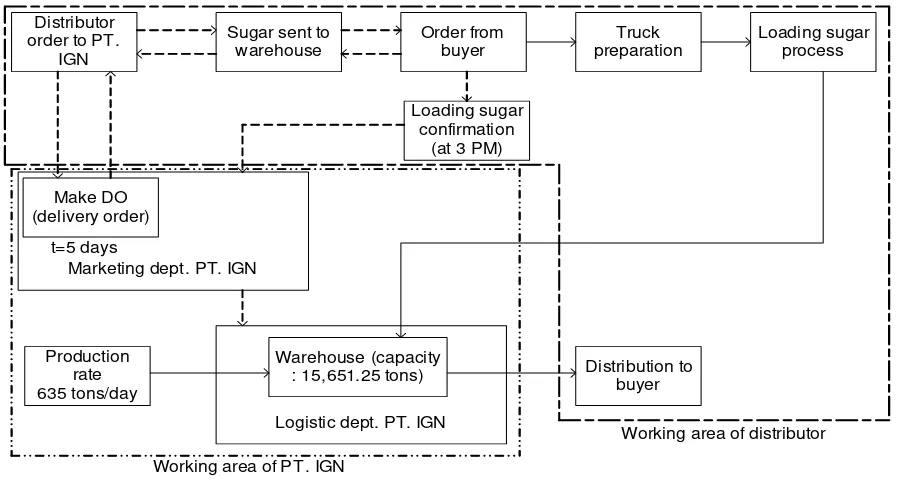
Distribution process began when a distributor put an order to the sugar factory and made payments. Five days after full payment, sugar factory would issue a delivery order (DO) letter. It indicated that distributor already had the sugar stored in the warehouse and ready for distribution. In this case, buyers are regionally served by distributor are Jakarta, Yogyakarta, Semarang, Kendal, Bandung, Surabaya, Salatiga, Ambarawa, Solo, Klaten, Purwokerto, Wonosobo, Cirebon, and Magelang.
: 15,651.25 tons) Distribution to buyer Marketing dept. PT. IGN
Working area of PT. IGN
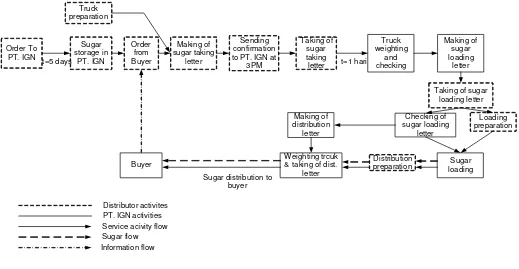
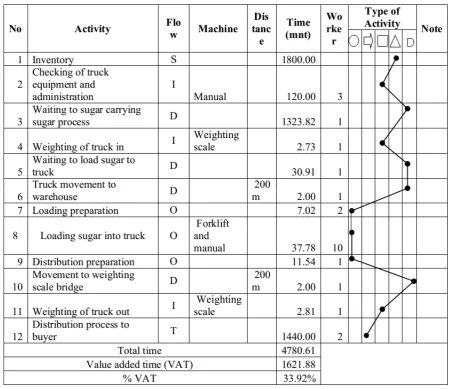
Delivery was made when a full payment was settled. Amount of buyers who will be served daily were confi rmed by marketing department. A confi rmation was carried out everyday at 15.00 pm. The following day, trucks would go to sugar warehouse or known as distribution center and showing “sugar withdrawal letter” for a loading. The complete processes are described in Figure 1 and Figure 2, where Table 1 shows cycle time of each processes.
Determination of Value Added and Non Value Added
Determination of value added and non value added was done by type of processes. Gazpers (2007) stated that there were three categories of activities, important and value-added activities, important activities but not value-added, and waste. Operation is value-added activity, inspection is important activity but not value-added, and waste for example product defect. Lee (2006) stated that all operation were value-added activities. Inspection, transportation, inventory, delay were not value-added activities. However, under particular conditions it could be different such as transportation could be a value-added activity when consumers were willing to pay for fast delivery.
Followed by a calculation of the percentage of value added time (% VAT) or known as process cycle effi ciency (PCE) is a comparison between the value added time to the process lead time (lead time, value added time, and non-value added time).
Table 1. Cycle time of each processes
No Activity CT (minutes)
1 Cheking of sugar taking letter 3.82
2 Weighting truck in 2.73
Checking truck 1.62
3 Making of loading order letter (SPM) 30.00
4 Taking of SPM 0.91
5 Loading preparation 7.02
Checking SPM 1.19
6 Loading of sugar 37.78
Making of distribution letter 10.00
7 Distribution preparation 11.54
8 Weighting truck in 2.81
Checking of distribution letter 1.37
Identifi cation of Waste
Identifi cation of waste based on the seven types of waste which is known as seven waste that had been formulated by Singo (1989) namely overproduction, unnecessary motion, excessive transportation, inappropriate processing, waiting / delay, defects, unnecessary inventory and they were not analyzed all (Vanany, 2005). It was depended on the condition of the company. In this study, the analysis of waste was based on two tools e.g. process activity mapping (PAM) and Truck
& taking of dist. letter
supply chain response matrix (SCRM). PAM gave a physical description and information fl ow, cycle of each processes, and distance among processes. It was used to show the process effi ciency for the whole chain. While SCRM was used for an observation whether there was an increasing or decreasing process in lead time and level of inventory on each activity within the process. This methods was used by New (1993) and by Forza et al. (1993) in a textile supply chain setting. In a more wide-ranging work, Beesley (1994) applied it in a range of industrial sectors including automotive, aerospace and construction. A similar, this approach was adopted also by Jessop and Jones (1995) in the electronics, food, clothing and automotive industries.
Performing Restoration Effort
First, from PAM application, we knew the attribute of each processes such as process type, cycle time, worker, and distance. It gave a base for analyzing ineffi cient, inappropriate, and unnecessary process. The result also could be used to calculate process cycle effi ciency.
Second, by using SCRM, it could be identifi ed the inventory level of sugar stock against the demand level. It explained how responsive of the inventory usage. To determine the inventory level, it was started by measuring the capability of white sugar supply, and how much safety stock must be employed to anticipate demand fl uctuations. According to Stratton and Warburton (2003), anticipation of fl uctuations in demand was necessary to expedite the distribution process leading to a lean distribution.
There were several types of inventory control models as stated by Herjanto (1999). In this study, we used the Economic Order Quantity (EOQ) to determine optimal stock in accordance to preliminary analysis over the demand behavior. The formula was adopted from Muckstadt and Sapra (2010) as follows:
A safety stock was determined to anticipate demand during lead time and determined by following formula:
SS = k xσL ...(2) SS : Safety stock
k : safety factor
σL : Standard deviation of demand rate in lead time
Silver and Peterson (1985) revealed that the safety factor was determined by various policies. However, in this study used two policies were employed. First,it was a policy which prior in percentage demand that can be served (P2) for region which had general distribution demand pattern. Second, it which prior in probability of no stockout (P1) for region which had exponential distribution demand pattern.
Formula for calculating safety factor of P2 is as follows:
...(3)
P2 : Expected service Q : Demand
σL : Standart deviation of demand rate in lead time Gu(k) : Probability of safety factor
Formula for calculating safety factor of P1 as follows:
Pu≥ (k) = 1 - P1 ...(4)
P1 : Probability of no stock out Pu> (k) : Probability of safety factor
RESULT AND DISCUSSION
Based on the above depiction of the sugar distribution process, it could be revealed that inbound logistics activity of the company is how to determine the ordering quantity of white sugar from sugar factory. The order system itself required distributors to make order as minimum as 1000 tons for a single order with indefi nite span of time. This policy resulted an inventory rate of 461.54 tons per day.
Outbound logistics activity of the company was the scheduling of white sugar delivery to buyers. Amount of sugar loaded per day on average is 367.87 tons per day with a standard deviation of 147.15 tons, or near 40% of demand. This deviation proved that the sugar demand behave radically.
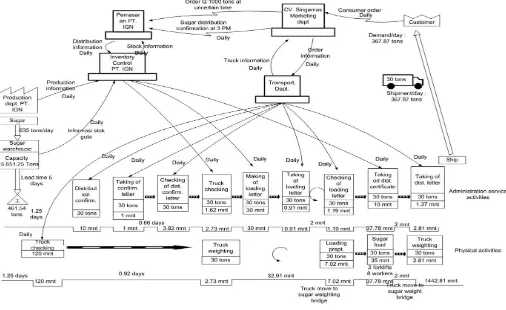
Figure 3. Value stream mapping of sugar distribution
Based on PAM, the VSM of the process could be developed to show the process cycle effi ciency, and by the same time we could notify kind of ineffi cient processes or activities. Cycle time of each activity was measured in comply with the value-added time (VAT) and non value added time (NVAT). Here, the mapping was applied for two types of
service processes, administrative and physical service process as in detail shown in Figure 5, and Figure 6, respectively. It was found that both of administrative and physical service process have 4780.61 minutes in total. Also it could be identifi ed that activity with the greatest value value added time is the transportation or approximately 30.31% of total process time.
There was an ineffi cient process which was relied on administrative activity in the processing of a loading order letter (SPM) that took 30 minutes. This letter was issued after receiving a confi rmation from the buyers a day before. When the trucks arrive, it must waited about half an hour to get a permit to load sugar as legalized by the loading order letter. However, this fi nding had become a suggestion to the company to do an improvement, and it was confi rmed that it can be implemented. By redesign the administrative activity of issuing SPM to be done after receiving a confi rmation a day before, it would safe half an hour in loading process, or reducing waiting time.
Further, to know level of inventory of white sugar and how responsive of inventory rate we used supply chain response matrix (SCRM). In SCRM we calculate day physical
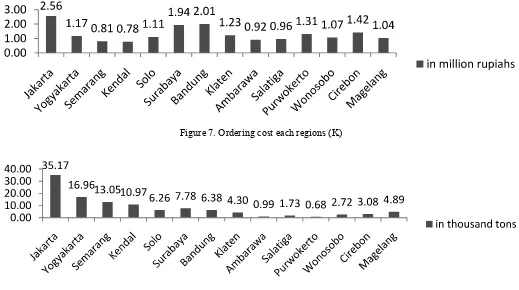
stock that compared inventory rate to demand rate. From the calculation of existing days physical stock = 461.53/367.87 = 1.25 showed that there was 25% tolerance of inventory in facing demand fl uctuations. However, with demand deviation 147.15 tons or 40% of average demand, hence there was high probability for stockout. Therefore we needed to calculate EOQ. To Calculate EOQ we needed data about ordering cost (K), annual demand ( ), holding cost (I), purchase order (C). Holding cost was 0,08% of purchase order per year and purchase order was 7,000,000 per ton. Ordering cost (K) and annual demand ( ) for each regions can be seen in Figure 7 and Figure 8, respectively.
For instance the EOQ for the Jakarta buyer is:
(EOQ for other regions can be seen in Figure 9, respectively).
Safety stock was a company policy of consumer service. The amount of safety stock was determined by using different policies based on order distribution pattern. Buyer region might have different order distribution pattern. Those who had normal distribution for their order, safety factor was determined by service policy that focused on how much service could be served and expected (P2). Buyer with an
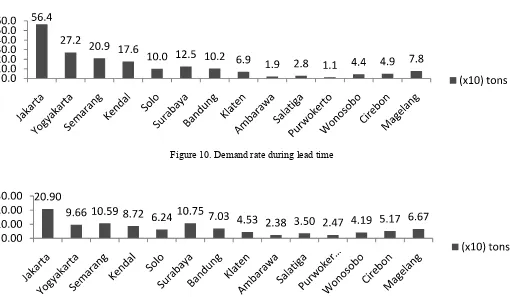
order that exponentially distributed should be approached by a safety factor that had a probability of no shortage (P1). To determine order distribution pattern we used kolmogorov-smirnov test. We needed data about demand rate during lead time which can be seen in Figure 10 respectively and standard deviation of demand rate during lead time which can be seen in Figure 11 respectively.
Figure 7. Ordering cost each regions (K)
Figure 8. Annual demand each regions ( )
On this study, based on the Kolmogorov-Smirnov test regions who have general demand pattern are Jakarta, Yogyakarta, Semarang, Kendal, and Solo, and those who have exponential demand pattern are Surabaya, Klaten, Salatiga, Ambarawa, Wonosobo, Purwokerto, Bandung, Cirebon, and Magelang. By determining service level at 99%, safety stock of Jakarta for instance is:
then searched using some function of the unit normal distribution table (see Silver and Peterson, 1985), we got
value of safety factor was 1.54 or safety stock 1.54 x 209 = 321.86 tons.
While, safety stock for the region with exponential distribution demand pattern, Surabaya for example is as follows:
Pu≥ (k) = 1.099 = 0.01
This obtained a safety factor 2.32 or equal to safety stock = 2.32 x 107.48 = 249.35 tons.
The complete calculation results of safety stock can be seen in Figure 12 respectively.
Figure 10. Demand rate during lead time
Figure 11. Standard deviation of demand rate during lead time
Yet, the average turn over inventory per day was 508.46 tons anticipating daily data on average 367.87 tons, or equivalent to:
This improvement (38%) represented the tolerance of inventory rate against demand rate, or it increased from 25% to 38% where it was close to demand standard deviation that was 40%.
CONCLUSION
The sugar distribution process was a operation and service process, both contained physical and administration activities. When this process was depicted by VSM it could be noticed that there were some ineffi ciency in term of its cycle time. A reducing or shortening cycle time was able to increase sevice performance or response and made a better inventory management which respect to the determination of safety stock as a policy for consumer order service. In this study it was found that administration activity of issuing the order loading letter had considerably taken waiting time. Therefore, this was strongly recommended to improve or reduce that waiting time by saving 30 minutes service time in order to increase service performance. At the same time, it could be notice that the current inventory policy unable to anticipate demand fl uctuations due to standard deviation of demand. By applying EOQ could increase service level from 25% to 38% where close to demand fl uctuation that was 40%. It was considerable more responsive to the erratic demand as proved by imposing two types of safety stock factor policy based on demand behavior whether they were normally or exponentially distributed.
REFERENCES
Beesley, A. (1994). A need for time-based process mapping and its application in procurement. Proceedings of the 3rd Annual IPSERA Conference. University of Glamorgan. pp. 41-56.
Emiliani, M.L. and Stec, D.J. (2004). Using value stream to imrpove leadership. The Leadership and Organisation Development Journal25(8): 622-645.
Endsley, S., Magill, M.K. and Godfrey, M.M. (2006). Creating a lean, Family Practice Management. pp.34-48.
Forza, C., Vinelli, A. and Filippini, R. (1993). Telecom-munication services for quick response in the textile-apparel industry. Proceedings of the 1st International
Symposium on Logistics. The University of Nottingham. pp. 119-126.
Gazperz, V. (2007). Lean Six Sigma for Manufacturing and Services Industries-Strategi Dramatik Reduksi Cacat/ Kesalahan, Biaya, Inventori, dan Lead Time dalam Waktu kurang dari 6 Bulan. Gramedia Pustaka Utama, Jakarta.
Gurumurthy, A. and Kodali, R. (2011). Design of lean manufacturing system using value stream mapping with simulation. Journal of Manufacturing Technology Management22(4): 444-473.
Herjanto (1999). Manajemen Produksi dan Operasi. PT. Gramedia Widiasarana Indonesia, Jakarta.
Hines, P. and Rich, N. (1997). The seven value stream mapping tools. International Journal of Operation and Production Management 17(1): 46-64.
Jessop, D. and Jones, O. (1995). Value stream process modelling: a methodology for creating competitive advantage. Proceedings of the 4th Annual IPSERA Conference. University of Birmingham.
Lee, Q. (2006). The Strategos Guide to Value Stream and Process Mapping. Enna Products Corporation. Bellingham.
Lee, Q. and Snyder, B. (2007). Value Stream and Process Mapping. Enna Products Corporation. Bellingham.
Lehtinen, U. and Torkko, M. (2005). The lean concept in the food industry: a case of contract a manufacture. Journal of Food Distribution Research36(3): 57-67.
Locher, A.D . (2008). Value Stream Mapping for Lean Development How to Guide for Streamlining to Market. Tylor and Francis Group, New York.
Lummus, R.R., Vokurka, R.J. and Rodeghiero, B. (2006). Improving quality trough value stream mapping: a case study in physician’s clinic. Total Quality Management and Business Exellence17(8): 1063-1075.
McManus, H.L. and Millard, R.L. (2002). Value stream analysis and mapping for product development.
Proceeding of the International Council of Aeronautical Sciences 23rd ICAS Congress. 8-13. Toronto, Canada.
Muckstath, J.A. and Sapra, A. (2010). Principle of Inventory Management. Springer, New York.
Nasution, A.H. (2003). Perencanaan and Pengendalian Produksi. Institut Teknologi Sepuluh November, Surabaya.
New, C. (1993). The use of throughput effi ciency as a key performance measure for the new manufacturing era.
The International Journal of Logistics Management
Serrano, I., Ochoa, C. and De Castro, R. (2008). Evaluation of value sream mapping in manufacturing system redesign. International Journal of Production Researh
46(16): 4409-4430.
Shingo, S. (1989). A Study of the Toyota Production System from an Industrial Engineering. Productivity Press, Cambridge.
Silver, E.A. and Peterson, R. (1985). Decision System for Inventory Management and Production Planning 2nd
Edition. John Wiley and Sons, New York.
Silva, S.K.P.N. (2012). Applicability of Value Stream Mapping (VSM) in the apparel industry in Sri Langka.
International Journal of Lean Thinking3(1).
Stratton, R. and Warburton, R.D.H. (2003). The strategic integration of agile and lean supply. International Journal Production Economic.85: 183-198.
Vanany, I. (2005). Aplikasi pemetaan aliran nilai di industri semen. Jurnal Teknik Industri 7(2): 127-137.