UNIVERSITI TEKNIKAL MALAYSIA MELAKA
This report submitted in accordance with requirement of the Universiti Teknikal Malaysia Melaka (UTeM) for the Bachelor Degree of Manufacturing Engineering
(Manufacturing Management Hons.)
by
NURHAZIMAH BINTI MOHD HAMKA B051210172
910227-01-6422
FACULTY OF MANUFACTURING ENGINEERING 2015
UNIVERSITI TEKNIKAL MALAYSIA MELAKA
BORANG PENGESAHAN STATUS LAPORAN PROJEK SARJANA MUDA
TAJUK: IMPLEMENTATION OFVALUE STREAM MAPPING IN TEXTILE MANUFACTURING COMPANY
SESI PENGAJIAN: 2014/2015 Semester 2
Saya NURHAZIMAH BINTI MOHD HAMKA
mengaku membenarkan Laporan PSM ini disimpan di Perpustakaan Universiti Teknikal Malaysia Melaka (UTeM) dengan syarat-syarat kegunaan seperti berikut: 1. Laporan PSM adalah hak milik Universiti Teknikal Malaysia Melaka dan penulis. 2. Perpustakaan Universiti Teknikal Malaysia Melaka dibenarkan membuat salinan
untuk tujuan pengajian sahaja dengan izin penulis.
3. Perpustakaan dibenarkan membuat salinan laporan PSM ini sebagai bahan pertukaran antara institusi pengajian tinggi.
4. **Sila tandakan ( )
SULIT
TERHAD
TIDAK TERHAD
(Mengandungi maklumat yang berdarjah keselamatan atau kepentingan Malaysia sebagaimana yang termaktub dalam AKTA RAHSIA RASMI 1972)
(Mengandungi maklumat TERHAD yang telah ditentukan oleh organisasi/badan di mana penyelidikan dijalankan)
Alamat Tetap:
DECLARATION
I declare that this thesis entitled “Implementation of Value Stream Mapping (VSM) in The Textile Manufacturing Company” is the result of my own research except as cited in the reference. This thesis has not been accepted for any degree and is not concurrently submitted in candidate of any other degree.
Signature: ……….…..….
Name: ………..
APPROVAL
I hereby declare that I have read this dissertation/ report and in my opinion this dissertation/ report is sufficient in term of scope and quality as a partial fulfillment of Bachelor of Manufacturing Engineering (Manufacturing Management).
Signature: ……….…..……….
Supervisor Name: ………..
DEDICATION
ABSTRACT
ABSTRAK
ACKNOWLEDGEMENTS
DECLARATION
2.1 Manufacturing Industrial Overview ... 7
2.5.1 5’S ... 18
2.5.2 Kaizen ... 19
2.5.3 Kanban ... 19
2.5.4 Cellular Manufacturing ... 20
2.5.5 Value Stream Mapping (VSM) ... 20
CHAPTER 3 ... 23
RESEARCH METHODOLOGY ... 23
3.1 Project Overview ... 23
3.2 Product Flow Identification and Analysis... 26
3.3 Development of Current State Mapping (CSM) ... 28
3.3.1 Semi-structure Interview and Focus Group Discussion ... 28
3.3.2 Natural and Indirect Observation... 29
3.3.3 Brainstorming ... 29
3.3.4 Time Study ... 30
3.3.5 Flow in Developing the Current State Map (CSM) ... 33
3.3.6 Determination of Waste and Analysing Problem Area ... 38
3.3.7 Spaghetti Diagram ... 38
4.1 Product Flow Identification and Analysis... 45
4.1.1 Pointing Process ... 47
4.1.2 Assemble process ... 50
4.1.3 Finishing Process (Passivation) ... 54
4.1.4 Quality Control Inspection ... 58
4.1.5 Packaging ... 59
4.1.6 Staging Area ... 62
4.1.7 Checking ... 62
4.2 Current State Map (CSM) ... 66
4.3 Analysis of CSM ... 68
4.3.1 Takt Time ... 69
4.3.2 Root Cause analysis ... 72
4.4 Identify and Analysis the Problem ... 77
4.4.1 Pointing Process ... 77
4.4.2 Assemble Process ... 78
4.4.3 Passivation Process ... 79
4.4.4 Quality Control Inspection ... 80
4.4.5 Packaging ... 81
4.4.6 Staging area ... 82
4.4.7 Checking ... 83
4.4.8 Palletizing ... 84
4.5 Proposed Improvement for the FSM ... 85
4.5.1 Improvement in Order System and Inventory ... 85
4.5.2 Improvement for Critical Workstation... 85
4.6 Development of FSM ... 98
4.6.1 Future State Map (FSM) ... 102
CHAPTER 5 ... 104
CONCLUSION AND RECOMMENDATION ... 104
5.1 Conclusion ... 104
5.2 Recommendation ... 105
REFERENCES ... 107
LIST OF TABLE
TABLE TITLE PAGE
2.1 Case Study for Application for Value Stream Mapping in Industry 22
3.1 Cycle time recording sheet 31
4.1 Cycle Time for Machine in One Shift for Two Pointing Machine 49 4.2 Amount of Total Output with the Scrap in one shift 49
4.3 Data for Time Study for Pointing Process 49
4.4 Cycle time for machine in in one shift for three assemble safety pin
machine 52
4.5 Amount of Total Output with the Scrap in one shift 52
4.6 Time study for passivation process 57
4.7 The cycle time for quality control inspection 58
4.8 Cycle time for packing process 61
4.9 Cycle time for checking process 62
4.10 Cycle time for palletizing and shipping 63
4.11 Average Data Collection 64
4.12 Requirement Data 65
4.14 Improvement and saving for pointing machine 87
4.15 Suggestion Step to Implement 5’S 91
4.16 Table For Planning Production 93
LIST OF FIGURE
FIGURE TITLE PAGE
1.1 Unsystematic arrangement of workplace 3
1,2 Product waiting for the next workstation 3
1.3 Spillage due to the maintenance of the machine issues 4
1.4 The product of yellow brass safety pin 5
2.1 Principle of LM 11
2.2 Example of Value Stream Mapping Tools 21
3.1 Project methodology 25
3.2 Overall Process flow for safety pin product 27
3.3 Stop watch for data collection 30
3.4 Passivation Process Flow 32
3.5 Drawn the customer, supplier and production control icon 33 3.6 Draw a data box below the customer icon and customer
requirement 34
3.7 Third step in developing CSM 34
3.8 Fourth step in developing CSM 35
3.9 The process attributes are entered in the data boxes 35
3.10 The information flow 36
3.11 The inventory is stored between processes is drawn 37
3.12 The arrow is drawn to show the push system 37
3.14 Ishikawa Diagram 41
3.15 Final year project (part 1) Gantt chart 43
3.16 Final year project (part 2) Gantt chart 44
4.1 Process flow for safety pin product 46
4.2 Pointing Process (Workstation 1) 47
4.3 Machine in production of safety pin 51
4.4 Output for one safety pin machine 51
4.5 Safety pin is pack for 1 load 51
4.6 Washing process of safety pin 54
4.7 The item is sulphuric acid, cap activator, hydrogen 54
4.8 Water rinsing 54
4.9 Drying process 54
4.10 Process Flow Chart for Passivation Process 56
4.11 Inspection of yellow brass safety pin 58
4.12 Insert the safety pin into the poly bag 59
4.13 The safety pin is counting 59
4.14 The poly bag is silt and make the below outer cover 59
4.15 Make the upper outer cover 59
4.16 Make the upper outer cover and place the poly bag safety pin 60
4.17 Insert the outer to the carton 60
4.18 Position of operator for manual packing process 60
4.19 Plastic wrapped process on the carton 63
4.20 The pallet will transfer to the shipping area 63
4.22 Current State Map (CSM) 66
4.23 VSM Icons 67
4.24 Percentage of value added activity and non value added activity. 69
4.25 Yamazumi Chart 70
4.26 Analysis of Four Workstation that exceed the takt time 71
4.27 Ishikawa Diagram 73
4.28 Pointing process in VSM 77
4.29 Assemble process in VSM 78
4.30 Arrangement of box that filled with stem before enter the assemble
process 78
4.31 Passivation Process in VSM 79
4.32 Quality Control Inspection in VSM 80
4.33 Packaging in VSM 81
4.34 Staging area in VSM 82
4.35 Checking process in VSM 83
4.36 Palletizing process in VSM 84
4.37 Previous spinal blade 85
4.38 New spindle blade 85
4.39 Previous downtime sheet 88
4.40 New downtime sheet 89
4.41 All tools in the tool box 90
4.42 5’S Implementation for all tools 90
4.43 Waiting Product 91
4.44 Company Passivation Planning 92
4.46 Quality Control area 94
4.47 Label template for urgent item 95
4.48 Label template for non-urgent item 95
4.49 No color code for the batch 95
4.50 Color code for the batch 96
4.51 Illustration on the storage area for all loads at staging area 96
4.52 Racking System at Inventory Area 97
4.53 Purpose FIFO Racking System 98
4.54 Change in cycle time for pointing process in FSM 98 4.55 Change in lead time for passivation process in FSM 99 4.56 Change in lead time for quality control inspection process in FSM 99 4.57 Change in lead time for packaging process in FSM 100
4.58 Future State Map (CSM) 102
LIST OF ABBREVIATION
VSM - Value Stream Mapping CSM – Current state Map
FSM – Future State Map
LM - Lean Manufacturing
VA - Value Added
NVA – Non Value Added
NNVA – Necessary but non value added
SMED – Single Minute Exchange Dies
JIT – Just In Time
FIFO – First In First Out
CHAPTER 1
INTRODUCTION
Throughout this chapter, it contains about the background of study, the problem statement, includes the objectives to be achieved throughout the project and the scope of the study. The limitation of the product study is also included in this chapter. Throughout this chapter, it provides a structure of the report which generally describes about chapter division and related contents to that particular chapter. In overall, it summarizes the progress of the whole project, describing how the whole project has been done.
1.1 Background of study
stage of the production process. The fact of increasing labor cost as well as reduce and control the operating cost are just a few reasons companies choose to outsource their operation. Instead of minimize their impact on natural resources at every stage of the production process; they were seeking to maximize customer value while minimizing waste. From these issues, by implement the lean manufacturing tools in the company, they can reduce any waste which is effect on increasing cost and toward on satisfy the customer demand. Leans can be defines as create more value for customer with fever resources which the value is any action or process that a customer would be willing to pay for. The main principle of lean is customer value, value stream, continuous flow, pull and perfection.
The main purpose of lean manufacturing is to eliminate or reduce waste in an operation, such as long lead times, defect and material waste. In order to detect where waste occurs in the operation flow, a value stream mapping (VSM) is construct. VSM is often used to prove current manufacturing processes to create better future state processes. It is important for companies to increasing and conducts business strategies to satisfy the customer demand.
1.2 Problem Statement
pin, straight pin, hook and eyes, snap fasteners and many more. The lack of implementation of lean manufacturing tools and technique, unsystematic arrangement of the workplace, failed to maintain the efficiency of machine, unsystematic planning, certain process have standard operating procedure (SOP), lack of manpower and etc.
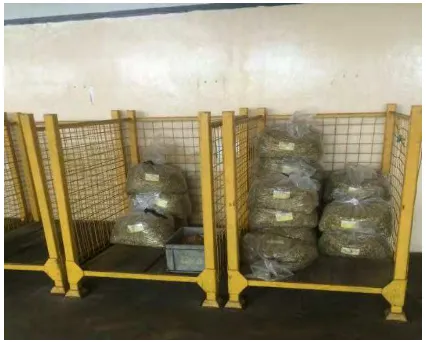
Figure 1.1: Unsystematic arrangement of workplace
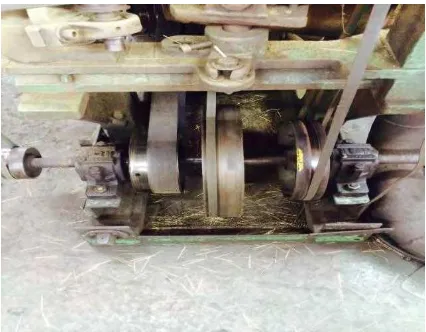
Figure 1.3: Spillage due to the maintenance of the machine issues
Figure 1.1 shows a poor arrangement of workplace, Figure 1.2 shows the product waiting for the next process and figure 1.3 shows the spillage due to the maintenance
of the machine issues. If the waste is not eliminate or reduce it can affect the process of the product in terms of lead time, delivery time, quality, system performance, system efficiency and production cost. By implementation of the Lean Manufacturing Tool and Technique, the Value Stream Mapping (VSM) Method is purpose. From this method, the causes of the waste can be identified and then preventive action can be taken to eliminate or reduce any related issues.
1.3 Objective
This study embarks on the following objectives:
1) To develop Current State Mapping of textile manufacturing 2) To determine waste by analyse Current State Mapping 3) To develop future state map
1.4 Scope
production process, passivation process, quality inspection, packing and palletizing. The focus on this project is proposing some improvement to the company to eliminate or reduce waste and lead time.
Figure 1.4: The product of yellow brass safety pin
1.5 Structure of the Report
Chapter 1: Introduction
This chapter explains and focus about the background of study, problem statement, objectives and the structure of the report the scope of the study.
Chapter 2: Literature Review
This chapter focus on any information which is related to the project. Then, need to summarize the main idea. By following the information from past studies, research and books, it will show a path and guide for the project in the future.
Chapter 3: Methodology
It describes the overview of research methods, research flow or methodology, and how to conduct the research methods. It shows the procedures and workflow of this project in detail from the beginning.
Chapter 4: Result and Discussion
This chapter focus on process flow analysis from the data, development of current state map and analysis. From the analysis, the action is purposed to develop the future state map.
Chapter 5: Conclusion and Recommendation