March 2011
© Ministry of Health Malaysia
Published by:
The National Healthcare Statistics Initiative (NHSI) Clinical Research Centre
Ministry of Health 3rd Floor, MMA House 124, Jalan Pahang 53000 Kuala Lumpur Malaysia
Tel. : (603) 40439300
Fax : (603) 40439400
e-mail : [email protected]
Website : http://www.crc.gov.my/nhsi
This report is copyrighted. Reproduction and dissemination of this report in part or in whole for research, educational or other non-commercial
purposes are authorized without any prior written permission from the copyright holders provided the source is fully acknowledged. Suggested
citation is Clinical Research Centre. National Healthcare Establishments & Workforce Statistics (Hospital) 2008-2009. Kuala Lumpur 2011
This report is also published electronically on the website of the National Healthcare Statistics Initiative at: http://www.crc.gov.my/nhsi
Funding:
The National Healthcare Statistics Initiative is funded by a grant from the Ministry of Health Malaysia (MRG Grant Number NMRR-09-842-4718)
PREFACE
The Ministry of Health (MOH) is not just the largest provider of medical services in Malaysia; it also has overall responsibility for the stewardship of our healthcare system. To this end, the MOH must undertake the difficult tasks of healthcare policy-making and planning to ensure the effective, efficient and equitable delivery of medical services to our people.
The demand of evidence-based policy-making requires that, wherever possible, for healthcare policy & planning decisions should be based on careful analysis using sound and transparent data, more specifically, on the systematic and rigorous use of statistics to decide on programme design and policy choice; forecast the future, monitor policy implementation, and evaluate policy impact.
There is hardly any basic statistical information about available healthcare facilities and health workforce in the country, such as: • How many cardiac catheterisation laboratories and interventional cardiologists are there in the country?
• How many such facilities and cardiologists do we need say 5 years from now?
We have even less statistical data on healthcare activities and services delivered by our healthcare system. For example:
• How many Malaysian children visited their GPs or primary care doctors for asthmatic wheeze?
• How many Malaysian women have undergone mastectomy? And with what health outcome?
• How many Malaysian men were discharged from hospital with liver cirrhosis? And with what health outcomes?
I am convinced that the better use of better statistics will lead to better policy and better healthcare outcomes. Healthcare statistics is a key element of any country’s policy-making, monitoring and evaluation system. And the MOH is already publishing statistics on healthcare financing and expenditures, statistics on the use of medicines and availability of medical devices.
We must now extend the range of routinely available statistical data to include healthcare facilities, health workforce and healthcare services (hospital discharges, ambulatory care, surgical operations etc). I have therefore instructed my officers to further strengthen the statistical capacity in the MOH, reinforced by the necessary administrative and legal authority, to access all available data from multiple and varied sources in our healthcare system, to ensure the routine and timely availability of healthcare statistics to improve the evidence base for healthcare policy. The availability of such a statistical resource is also critical to support healthcare research.
To all those who have contributed directly or indirectly to the success of the first National Healthcare Establishments and Workforce Statistics (Hospitals), I thank you for your cooperation. I look forward to receiving the first edition of the series of reports on National Healthcare Statistics 2008-2009.
………
Dato’ Dr. Hasan Abdul Rahman
PREFACE I
ACKNOWLEDGEMENTS III
ABOUT THE NATIONAL HEALTHCARE STATISTICS INITIATIVE IV
NATIONAL HEALTHCARE ESTABLISHMENT AND WORKFORCE (HOSPITAL) PROJECT TEAM VI
MEMBERS OF NATIONAL HEALTHCARE ESTABLISHMENT AND WORKFORCE (HOSPITAL) EXPERT PANELS VII
NATIONAL HEALTHCARE ESTABLISHMENT AND WORKFORCE (HOSPITAL) STUDY METHODOLOGY IX
ABBREVIATIONS XIII
CHAPTER 1 : OVERVIEW ON HOSPITALS AND SPECIALIST SERVICES IN MALAYSIA 1
CHAPTER 2 : HOSPITAL SERVICES IN MALAYSIA 3
CHAPTER 3 : MATERNITY SERVICES IN MALAYSIAN HOSPITALS 19
CHAPTER 4 : PAEDIATRIC SERVICES IN MALAYSIAN HOSPITALS 27
CHAPTER 5 : SURGICAL SERVICES IN MALAYSIAN HOSPITALS 39
CHAPTER 6 : EMERGENCY & TRAUMA SERVICES IN MALAYSIAN HOSPITALS 53
CHAPTER 7 : ANAESTHESIOLOGY SERVICES IN MALAYSIAN HOSPITALS 57
CHAPTER 8 : OPHTHALMOLOGY SERVICES IN MALAYSIAN HOSPITALS 67
CHAPTER 9 : ONCOLOGY SERVICES IN MALAYSIAN HOSPITALS 73
CHAPTER 10 : CARDIOLOGY SERVICES IN MALAYSIAN HOSPITALS 81
CHAPTER 11 : RENAL DIALYSIS SERVICES IN MALAYSIA 89
APPENDIX 1 : PARTICIPANTS OF THE NATIONAL HEALTHCARE ESTABLISHMENTS AND
WORKFORCE SURVEY 2008-2009 97
APPENDIX 2 : MEDICAL SUBSPECIALTIES 101
APPENDIX 3 : OTHER SPECIALTIES IN MEDICINE 106
ACKNOWLEDGEMENTS
The National Healthcare Statistics Initiative (NHSI) would like to thank the following for their participation, assistance, support or contribution:
• Director General of Health, Malaysia
• Deputy Director General of Health (Research and Technical Support), Ministry of Health (MOH) • Deputy Director General of Health (Medical), MOH
• Deputy Director General of Health (Public Health), MOH • Director, Medical Development Division, MOH
• Director, Medical Practice Division, MOH
• Director, Planning and Development Division, MOH
• Director, Clinical Research Centre (CRC), Ministry of Health (NIH) • Heads of Clinical Services in MOH
• Health Informatics Centre, MOH
• State level Unit Kawalan Amalan Perubatan Swasta (UKAPS) • UKAPS Selangor
• All participating public and private hospitals which provided or allowed access to their Establishment and Workforce data • University of Malaya Medical Centre, Hospital Universiti Kebangsaan Malaysia, Hospital Universiti Sains Malaysia • KPJ Healthcare Berhad
• Pantai Holdings Berhad • National Obstrectics Registry • National Renal Registry • National Eye Registry
• Malaysian Medical Council, Association of Private Hospitals of Malaysia, Obstetrical & Gynaecological Society of Malaysia, Malaysian Paediatric Association, Malaysian Society of Anaesthesiologist, Malaysian Optical Council, Malaysian Psychiatric Association, Malaysian Oncology Society, Federation of Private Medical Practitioners Association of Malaysia and Academy of Medicine Malaysia
• Members of NHEWS Expert Panels who helped write this report
• All who have supported or contributed to the success of the NHEWS and this report
Datuk Dr Noor Hisham Abdullah
Principal Investigator
Dr Lim Teck Onn
Principal Co-Investigator
National Healthcare Establishment & Workforce Survey (Hospital) Project Team,
Ministry of Health Malaysia
ABOUT THE NATIONAL HEALTHCARE STATISTICS INITIATIVE
Background
A healthcare system consists of physical facilities, human resources, medical technologies (medicines & devices), and the institutions related to the financing, regulation and delivery of healthcare. It exists to provide personal medical services to a population.
Evidence-based policy-making means that, wherever possible, public policy decisions should be informed by careful analysis using sound and transparent data. More specifically, it may be defined as the systematic and rigorous use of statistics to achieve issue recognition, inform programme design and policy choice; forecast the future, monitor policy implementation, and evaluate policy impact. Policy outcomes are crucially affected by the extent to which relevant evidence is used to shape policy design, and by the speed with which the results of monitoring are fed back into policy implementation. We urgently need to develop the statistical capacity in Malaysia to improve the evidence base for healthcare policy, and to support the design, monitoring and evaluation of healthcare policy implementation.
Objectives
The Malaysian National Healthcare Statistics Initiative (NHSI) aims to make available objective, timely and reliable healthcare statistical information to meet the need of healthcare policy-makers, planners and managers, the healthcare industry community, the health professionals and researchers. It seeks to accomplish this through a family of healthcare surveys that systematically access available data from multiple and varied sources in our healthcare system or otherwise design and conduct sample surveys to collect previously unavailable data.
The NHSI’s intention is to put as much statistical information as possible about Malaysian healthcare in the public domain in a useful, easy to understand and credible manner.
• Document the availability and distribution of healthcare facilities, services, workforce and medical technology (drugs and devices) in the country.
• Document the use of healthcare and medical technology (drugs and devices), and identify disparities in the use by socioeconomic status, geography, and other population characteristics.
• Monitor trends in healthcare delivery and use of medical technology (drugs and devices). • Provide information for making changes in healthcare policies and programmes. • Evaluate the impact of healthcare policies and programmes.
Survey strategy, data sources & surveys
HEALTHCARE SURVEYS AVAILABLE STATISTICS OR EXISTING DATA SOURCES
HEALTHCARE SURVEY TO COLLECT PREVIOUSLY UNAVAILABLE DATA
National Healthcare Establishment & Workforce Survey (NHEWS)
• Healthcare facility administrative and registration database
• Health professionals registers
The NHEWS targets ALL registered healthcare establishments in the country (100% sample). The sampling frame for public facilities is available from the MOH, while the sampling frame for registered private facilities is available from Cawangan Kawalan Amalan Perubatan Swasta (CKAPS).
National Medicines Use Survey (NMUS)
• Healthcare facility administrative records (purchasing, dispensing etc) • Pharmaceutical manufacturers’ or
distributors’ drugs sales records
General Practices & Primary Care Prescription Survey. This is incorporated into the Ambulatory Medical Care Survey (see 4 below).
National Medical Device Survey (NMDS)
• Healthcare facility administrative records (asset inventory, purchasing, etc) • Medical device manufacturers’ or
distributors’ drugs sales records • Radiation device registration data
Survey on available medical technology targets ALL registered healthcare establishment in the country (100% sample). This is incorporated within the Healthcare Establishment & Workforce Survey (see 1 above).
National Medical Care Survey (NMCS)
• Routine health service statistics from Health Informatics Centre MOH, Department of Statistics and various patient registers
• Population mortality data from Department of Statistics
• The Ambulatory Medical Care Survey targets ALL registered primary care practices (General Practices or
Klinik Kesihatan) in the country (100% sample). • The sampling frame for public facilities are the
registered Klinik Kesihatan (KK) from the Family Health Development Division and the sampling frame for private facilities are the registered entities with Medical Practice Division (CKAPS).
Administrative and legal authority underpinning data collection
Public hospitals and clinics under the jurisdiction of the Medical Development Division (Bahagian Perkembangan Perubatan) and Family Health Development Division (Bahagian Perkembangan Kesihatan Keluarga) respectively were directed to provide access to available data and participate in the healthcare surveys.
For private healthcare establishments and other private sector entities, legal authorities for the collection of such data by the MOH are provided by, where applicable, the Private Healthcare Facilities and services Act 1998, Control of Drugs & Cosmetics regulation 1984 and the soon to be introduced Medical Device Bill. The relevant regulatory authorities in the MOH are the Medical Practice Division, National Pharmaceutical Control Bureau and Medical Device Bureau respectively. They have designated the Clinical Research Centre (CRC) as their data collection agency.
Organisation and Collaboration
The NHSI is a collaborative project among several organisations in the MOH. These are • Medical Development Division (Bahagian Perkembangan Perubatan)
• Family Health Development Division (Bahagian Pembangunan Kesihatan Keluarga) • Medical Practice Division (Bahagian Amalan Perubatan)
• Planning and Development Division (Bahagian Perancangan and Pembangunan) and its Health Informatics Centre (Pusat Informatik Kesihatan)
• Pharmaceutical Services Division (Bahagian Farmasi) and National Pharmaceutical Control Bureau (Biro Pengawalan Farmaseutikal Kebangsaan)
• Engineering Services Division (Bahagian Perkhidmatan Kejuruteraan) and Medical Device Bureau (Biro Kawalan Peralatan Perubatan) • And the Clinical Research Centre (Pusat Penyelidikan Klinikal), which provides the necessary functional capacity, information infrastructure
and quantitative techniques to support the project.
NATIONAL HEALTHCARE ESTABLISHMENTS AND WORKFORCE SURVEY (HOSPITAL) PROJECT TEAM
PRINCIPAL INVESTIGATOR DATUK DR NOOR HISHAM ABDULLAH
PRINCIPAL CO-INVESTIGATOR DR LIM TECK ONN
CO-INVESTIGATORS DR NOORAINI BABA
DR MD KHADZIR SHEIKH AHMAD
PROJECT COORDINATOR DR SHEAMINI SIVASAMPU
PROJECT LIASON OFFICERS DR AFIDAH ALI
DR ZUHAIDA DATO’ CHE EMBI
PROJECT MANAGERS DR ARIZA ZAKARIA (JULY 2009 – JUNE 2010)
DR SHARMILA M. K. LAKSHMANAN
SURVEY COORDINATOR MS NABILAH MAMAT KHALID
RESEARCH OFFICERS
MS NURHAMIZAH MOKHSIN MS MUNIRAH MOHAMED MS ZURAIDAH TASIM
STATISTICIAN MS LENA YEAP
DATABASE DEVELOPERS / ADMINISTRATORS
MEMBERS OF NATIONAL HEALTHCARE ESTABLISHMENTS AND WORKFORCE SURVEY (HOSPITAL)
EXPERT PANELS
HOSPITAL SERVICES
EXPERT PANELS INSTITUTIONS
Dr Nooraini Baba Medical Practice Division, Ministry of Health Dr Teng Seng Chong Medical Development Division, Ministry of Health Dr Lailanor Haji Ibrahim Hospital Kuala Lumpur
Dr Ahmad Razid Salleh Medical Practice Division, Ministry of Health Dr Laili Murni Mokhtar Medical Development Division, Ministry of Health Dr Afidah Ali Medical Practice Division, Ministry of Health Dr Sheamini Sivasampu Clinical Research Centre, Ministry of Health Haji Amiruddin Abdul Satar KPJ Healthcare Berhad
Datin Sabariah Fauziah Jamaluddin KPJ Healthcare Berhad
Matron Faridah Omar Nursing Division, Ministry of Health
MATERNITY SERVICES
EXPERT PANELS INSTITUTIONS
Dato’ Dr Ravindran Jegasothy Hospital Kuala Lumpur Dato’ Dr Ghazali Ismail Hospital Sultan Ismail
Prof Dr Muhammad Abdul Jamil Mohd Yassin Pusat Perubatan Universiti Kebangsaan Malaysia Dr Mymoon Alias Family Health Development Division, Ministry of Health
Dr Soon Ruey Hospital Likas
Dr Arpah Ali Medical Development Division, Ministry of Health
Dr Lee Kun Yun Hospital Sungai Buloh
PAEDIATRIC SERVICES
EXPERT PANELS INSTITUTIONS
Dr Lim Yam Ngo Hospital Kuala Lumpur
Dr Irene Cheah Guat Sim Hospital Kuala Lumpur
Prof Dr Zabidi Azhar Hussin Hospital Universiti Sains Malaysia Datin Dr Ang Kim Teng Institute of Health Management
Dr Jafanita Jamaludin Medical Development Division, Ministry of Health Dr Yung Chen Lin Clinical Research Centre, Ministry of Health
SURGICAL SERVICES
EXPERT PANELS INSTITUTIONS
Datuk Mr Harjit Singh Hospital Selayang
Dato’ Dr Abdul Jamil Abdullah Hospital Sultanah Nur Zahirah Mr Andrew Gunn Kean Beng Hospital Sultanah Aminah
Mr Tan Wee Jin Hospital Pulau Pinang
Dr Mohamed Yusof Abdul Wahab Hospital Tengku Ampuan Rahimah, Klang Dr Patimah Amin Medical Development Division, Ministry of Health Ms Nik Nor Aklima Binti Nik Othseman Clinical Research Centre, Ministry of Health
EMERGENCY SERVICES
EXPERT PANELS INSTITUTIONS
Dr Sabariah Fauziah Jamaludin Hospital Sungai Buloh
Assoc Prof Dr Hj Ismail Mohd Saibon Pusat Perubatan Universiti Kebangsaan Malaysia
Dr Khairi Kassim Hospital Tengku Ampuan Afzan, Kuantan
Dr Teo Aik Howe Hospital Pulau Pinang
Dr Mahathar Abd Wahab Hospital Kuala Lumpur
Dr Al Zamani Mohammad Idrose Hospital Kuala Lumpur
Dr Ahmad Tajuddin Mohamad Nor Hospital Tengku Ampuan Rahimah
ANAESTHESIOLOGY AND INTENSIVE CARE SERVICES
EXPERT PANELS INSTITUTIONS
Dr Ng Siew Hian Hospital Kuala Lumpur
Datin Dr V. Sivasakhti Hospital Melaka
Dr Mary S. Cardosa Hospital Selayang
Dr Jenny Tong May Geok Hospital Tuanku Jaafar
Dr Sharmila M.K.Lakshmanan Clinical Research Centre, Ministry of Health
OPHTHALMOLOGY SERVICES
EXPERT PANELS INSTITUTIONS
Dr Elias Hussein Hospital Selayang
Dr Pall Singh Tun Hussein Onn National Eye Hospital
Dr Goh Pik Pin Clinical Research Centre, Ministry of Health
Dr Shamala Retnasabapathy Hospital Sungai Buloh
Dr Abdul Mutalib Othman Hospital Kuala Krai
Dr Zuraidah Mustari Hospital Sultanah Nur Zahirah
Mr Ismail A. Shukor Malaysian Optical Council
Dr Jethananda Ganesan Muthi Clinical Research Centre, Ministry of Health
ONCOLOGY SERVICES
EXPERT PANELS INSTITUTIONS
Dr Gerard Lim Chin Chye Hospital Kuala Lumpur
Dr Muhammad Azrif Ahmad Annuar Pusat Perubatan Universiti Kebangsaan Malaysia
Dr Inderjeet Kaur Gill Medical Development Division, MOH
Ms Lim Yeok Siew Hospital Ampang
Ms Nabilah Mamat Khalid Clinical Research Centre, Ministry of Health
Dr Sharmila M.K.Lakshmanan Clinical Research Centre, Ministry of Health
CARDIAC SERVICES
EXPERT PANELS INSTITUTIONS
Dato’ Dr Omar Ismail Hospital Pulau Pinang
Prof Dr Sim Kui Hian Hospital Umum Sarawak
Dato’ Dr Mohd Hamzah Kamarulzaman Hospital Pulau Pinang
Prof Dr Wan Azman Wan Ahmad Pusat Perubatan Universiti Malaya
Dr Abd. Kahar Ghapar Hospital Serdang
Dr Shaiful Azmi Yahaya National Heart Institute
Mr Lim Ka Keat Clinical Research Centre, Ministry of Health
RENAL DIALYSIS SERVICES
EXPERT PANELS INSTITUTIONS
Datuk Dr Ahmad Ghazali Ahmad Kutty Hospital Kuala Lumpur
Dr Goh Bak Leong Hospital Serdang
Dr Sunita Bavanandam Hospital Kuala Lumpur
Dr Lily Mushahar Hospital Tuanku Jaafar
Ms Lee Day Guat National Renal Registry
NATIONAL HEALTHCARE ESTABLISHMENTS & WORKFORCE SURVEY (HOSPITAL) STUDY METHODOLOGY
Introduction
The Malaysian National Healthcare Statistics Initiative (NHSI) comprises a family of four surveys. These are the National Healthcare Establishments & Workforce Survey (NHEWS), National Medicines Use Survey (NMUS), National Medical Device Survey (NMDS) and the National Medical Care Survey (NMCS). They were designed to produce healthcare statistics either through compilation of available statistics and data from existing sources, or through primary sample surveys of healthcare providers in Malaysia.
This section provides a detailed description of the methods used in the NHEWS. The NHEWS was conducted through the use of survey forms for the hospitals.
Sample design
The NHEWS collected data from the entire hospital universe in Malaysia. Only hospitals which met the following eligibility criteria were included:
• Hospitalsprovidingacute(curative)care.
• Generalhospitals,maternityhospitals,specialisedinstitutionse.g.cardiology,eyeandchildren’sgeneralhospitals.
Hospitals that were excluded from this survey were:
• Military hospitals as well as hospital units of institutions, such as prison hospitals and the orang asli hospitals were excluded.
• Hospitalsandhospitalbedsavailableforlong-termcare(e.g.nursinghomes,psychiatricinstitution,rehabilitationandpalliativecare)were
excluded with the exception on the chapter for psychiatry.
There was no readily available sampling frame for the universe of hospitals in Malaysia. The hospital sampling frame therefore was constructed from multiple sources including the following:
•
MOH’s Hospital listing• CKAPS’sprivatehospitalregister • NationalMedicalandHealthDirectory
• AssociationofPrivateHospitalsinMalaysia’s(APHM)website • Individualhospitals’website
There were 341 hospitals in Malaysia in 2008-2009.
Survey operations and data collection
The Clinical Research Centre (CRC) was the data collection agency for the NHEWS. In collaboration with the Medical Development Division, Medical Practice Division, Engineering Division and Medical Device Bureau of the MOH, the CRC developed the survey operation procedures, designed, printed, and distributed all field manuals and Case Report Forms (CRF) for the survey. The CRC was also responsible for the daily operations of the survey, the training of field staff and trouble-shooting whenever there were queries.
Hospital induction
The first task of the NHEWS field operations consisted of inducting sampled hospitals into NHEWS. Hospital induction is the process of getting sampled hospitals to participate in the survey.
Hospital induction began with the distribution of letters of introduction to the hospital administrators or directors. Several relevant documents were enclosed with the letter as below:
• InformationbrochureontheNHEWS • Surveyinstructionmanual
• AnendorsementletterfromtheDeputyDirectorGeneral(Medical)oftheMOHforpublichospitals • AnendorsementletterfromtheDirectoroftheMedicalPracticeDivisionforprivatehospitals.
Private Hospital Induction
All private hospitals were invited to attend an induction meeting held in the Institute for Health Management, Kuala Lumpur on 3rd July 2009. During this meeting the hospital representatives were briefed on the objective of the survey, data required and various data submission options. Basic information on the hospitals was obtained through a Hospital Induction Questionnaire filled by the participants. A hands-on training was also conducted to familiarise the participants with the online data submission system. Hospitals that were not represented during the induction meeting were contacted on a later date in an effort to include their participation and to provide them with the relevant documents by mail.
Public Hospital Induction
Details of the induction as below:
NO DATE LOCATION TARGETED PARTICIPANTS
1 25th January 2010 Ipoh, Perak From Perak
2 3rd February 2010 Alor Setar, Kedah From Kedah and Perlis
3 4th February 2010 Kota Bharu, Kelantan From Kelantan
4 5th February 2010 Kuantan, Pahang From Pahang
5 8th February 2010 Johor Bharu, Johor From Johor
6 10th February 2010 Kuching, Sarawak From Sarawak
7 10th February 2010 Georgetown, Pulau Pinang From Pulau Pinang
8 12th February 2010 Kota Kinabalu, Sabah From Terengganu
9 12th February 2010 Seremban, Negeri Sembilan From Negeri Sembilan
10 1st March 2010 Kuala Terengganu From Terengganu
11 4th March 2010 WP Kuala Lumpur From WP Kuala Lumpur
Data collection and quality control
Data collection for NHEWS was authorised under the Private Healthcare Facilities and Services Act 1998. Participation, however, was voluntary. Data collected in the NHEWS were consistent with the Data Protection Act 2010. All information collected was held in the strictest confidence according to law and research ethics guidelines.
Approval for the NHEWS protocol was granted by the MOH Research and Ethics Committee (MREC) in 2010.
Two data collection procedures were used in the survey. Respondents had the option of either mode of submission that is by 1. Submission of Paper Case Report Forms (CRF)
2. Electronic submission of data via eCRF
For both data collection procedures, an ongoing quality control programme was conducted on the coding and entering of data. Several data security features were built into the data entry module along with other features such as compulsory data checking function, inconsistency checks and autocalculations to improve the quality of data and ensure the security of data. Data cleaning was then performed based on the results of edit checks. Data update and data checking of the dataset was performed when there was a query of certain fields as and when necessary. It could be due to requests by users, correction of data based on checking via data queries in the eCRF or after receiving results for preliminary data analysis. During data standardisation, missing data were handled based on derivation from existing data. Data de-duplication was also performed to identify duplicate records in the database that might have been missed out by source data providers.
Range checks and consistency checks were subsequently peformed after the data entry was completed. Verification of certain outliers was done with the Source Data Providers via verbal and written communication and the data were cross checked against other sources of data such as the Health Information Management System reports, Malaysian Medical Council Doctor Database, professional societies, National Specialist Register and Registry Central Surveys.
The total number in the population, inclusion criteria, number of establishments included in the study and response rates are summarised in the table below:
University Hospitals 3 All 3 3 (100%)
Private hospitals 201 All private hospitals 201 112 (55.7%)
Final query resolution / data cleaning / database lock
A final edit check run was performed to ensure that the data is clean. All queries were resolved before the database was locked, to ensure data quality and integrity. The final dataset was subsequently locked and exported to a statistician for analysis
.
Statistical Methods
In this report, the outcomes such as establishments, services, activities, facilities, work force and devices are expressed by state, sector and year. The Turnover Interval (TOI) was calculated using the below formula:
TOI= (B*365.25/N)-ALOS
Where B is Number of Inpatient beds N is Number of Admissions
ALOS is Average Length of Stay
The number of hospitals & Specialist servicesdetails per 10000 inhabitants and per million inhabitants was calculated as follows:
Number of hospitals & Specialist servicesdetails /10000 population=
T
P
×
10000Number of devicesdetails /million population=
T
P
×
1000000Where T is an estimate of the total quantity of variables available in the country in the year under consideration and P is the mid-year population of Malaysia or the relevant geographic region where the survey was conducted.
An estimate of the total quantity of the device/ service/ facility , T=
∑
W T
i i ,where;
Ti is the value of the quantity of device/ service/ facility available in the ith facility in the year,
Wi is the sampling weight of the ith facility
Wi =
1
p
The statistical estimation of the totals varies depending on the survey methods and the sampling design employed to the collected data, and if necessary with adjustment for incomplete data.
Survey Sampling weight and adjustment
Hospital and specialist services
Response propensity stratification
Adjust base weight in each class (formed by cross-classification of a few auxiliary variables) by inverse of weighted response rate Φ in each class.
Auxiliary variables to form weighting class could also be selected by logistic regression to model response status.
As the response rate of the survey was less than 100%, the procedures described above incorporated the sampling weight of the sampling unit in the estimation of total.
The sampling weight for each sampling unit or units of analysis has the following components:
1. Probability of selection
The basic weight is obtained by multiplying the reciprocals of the probability of the selection at each step of the sampling design.
2. Adjustment for non-response
SUMMARY OF STUDY PROCESS
Identification of Source Data Providers
Source data provider reporting with built in edit checks
Data editing in the light of queries, data verification
Data standardization, de-duplication,
record matching, review and coding
Final query resolution
Databases locked (October 2010)
Data analysis and report writing (Nov-Dec 2010)
Q
U
E
R
I
E
ABBREVIATIONS
ALOS Average Length of StayAPHM Association of Private Hospitals of Malaysia
BOR Bed Occupancy Rate
CCU Coronary Care Unit
CKAPS Cawangan Kawalan Amalan Perubatan Swasta
CRC Clinical Research Centre
MREC MOH Research and Ethics Committee
MRI Magnetic resonance imaging
NGO Non Governmental Organisation
NHEWS National Healthcare Establishments and Workforce Survey
NHSI National Healthcare Statistic Initiatives
NICU Neonatal Intensive Care Unit
NMCS National Medical Care Survey
NMDS National Medical Device Survey
NMUS National Medicines Use Survey
NOR National Obstetrics Registry
NRR National Renal Registry
O&G Obstetrics and Gynaecology
OECD Organisation for Economic Co-operation and Development
OT Operating Theatre
PD Peritoneal Dialysis
PICU Paediatric Intensive Care Unit
PPUKM Pusat Perubatan Universiti Kebangsaan Malaysia
PPUM Pusat Perubatan Universiti Malaya
SCN Special Care Nursery
SDP Source Data Provider
SRS Stereotactic Radiosurgery
TOI Turnover Interval
UKAPS Unit Kawalan Amalan Perubatan Swasta
WP Wilayah Persekutuan
CHAPTER 1
|
OVERVIEW ON HOSPITALS AND SPECIALISTS SERVICES IN MALAYSIA
Lim TO1, Sivasampu S1, Ariza Z1, Nabilah MK1
1. Clinical Research Centre, Ministry of Health
The Malaysian healthcare system consists of both public and private sector hospitals. This is the first in series of technical report reviewing current characteristicand trend in the number, composition,and distribution of hospitals, selected services, human workforce i.e. doctors/ specialists’ ratio and highly advanced medical devices.
For the year 2008-2009 there were a total of 334 hospitals that provided acute care services with a density of 0.12 hospitals per 10000 population. The majority of the hospitals and beds in Malaysia are concentrated in the State of Selangor & Federal Territories of Wilayah Persekutuan Putrajaya, Wilayah Persekutuan Kuala Lumpur (WPKL) and the State of Johor. A significant number of hospitals in the above locations were tertiary hospitals. Perlis was the only state that had no private hospitals. If enumerated separately, both the Federal Territories of WP Putrajaya and WP Labuan are being served entirely by the public sector.
Private hospitals have been proliferating over the past decade and contributed to about 60% of the Malaysian hospital population. However, hospital care in Malaysia is still heavily dominated by the public sector i.e. Ministry of Health being the largest healthcare provider. Approximately 75% of all hospital beds and 71% of the total hospital admissions were reported in the public sector.
Despite an increase in the number of public and private hospitals providing services, specifically pediatric and maternal services, the number of specialists is still significantly inadequate when compared with other developed countries or MOH’s own projected target.
This report has also demonstratedthat about 60% of specialized services, namely intensive care (ICU) and paediatric intensive care (PICU) were being provided by the public sector. More than 86% of the Neonatal Intensive Care Unit (NICU) beds were found in the public sector.
There are 538 Haemodialysis (HD) centres in Malaysia. The private sector provides 42.4% HD services, followed by Non Governmental Organization (NGO) contributing 31% and the public sector at 26.6%. The total number of haemodialysis centres in Malaysia increased by 222% from 167 in 2000 to 538 in 2009. However, 37% of peritoneal dialysis services were provided by public sector.
A study on the burden of disease using disability-adjusted life years (DALY) in 2004 showed that the five leading diseases in Malaysia were ischaemic heart disease followed by mental illness, cerebrovascular disease/stroke, road traffic injuries and cancers. Under the 10th Malaysian Plan, the Ministry of Health has prioritised the development of cardiac, emergency and oncology services for the nation. In Malaysia, 51 hospitals which provide cardiac services are equipped with coronary care units (CCU). There is however inequity in the distribution of this service, as they are mainly concentrated in the urban areas. The same scenario is evident for oncology and emergency medicine.
The ratio of doctors in hospitals (excluding housemen) to population is 1:1870. Seventy four percent of these doctors are serving in the public hospitals with 26% in the private hospitals. The highest densities of doctors are in WPKL with 19.81 per 10000 population. It must be pointed out that WPKL has the largest public hospitals, including Hospital Kuala Lumpur, University Malaya Medical Centre and Pusat Perubatan Universiti Kebangsaan Malaysian.
The Ministry of Health has invested heavily in developing the capacity and capability of human workforce. This is especially so for our specialists services. There were 2,836 specialists working in the MOH hospitals, 703 specialists in the universities setting and 2,692 specialists in the private sector. Details of specialists other than those reported in the chapters are available in Appendix 2 and 3.
Only one fifth of the cardiologists (32) were working in the public sector. There were 57 oncologists in the country and this equates to an oncologist: population ratio of 2: per million populations, with half of them in the public sector and the entire regional centre. Ironically, in the field of Emergency Medicine, all 84 specialists were found to be working in the public sector.
There were 785 surgeons in this country of which the largest surgical subspecialist group was the urologist (n=91). However, breast and endocrine surgeons were the smallest subspecialty with only 9 such subspecialists in this country. There were 644 anesthesiologists in Malaysia, resulting in an anesthesiologist to population ratio of 1:42,000 population. The surgical-based specialists per anaesthetists to anesthesiologist ratio were 4:1 showing a relative shortage of anesthesiologists.
Problems that affect the MOH workforce include shortage of skilled personnel, movement of health professionals from the public sector to the private sector, inadequate expertise in some critical areas, and difficulty in placement and retention of doctors and nurses in more remote areas. Apart from continuous staff shortages, the government recognizes that the misdistribution of health personnel continues to pose problems, including imbalance distribution in rural areas such as the States of Sabah and Sarawak.
Visits ratio to the Emergency Medicine and Trauma department (2,523 visits per 10000 populations) in our country was far higher than the ratios reported in developed countries.Malaysia does not have adequate number of Emergency and Trauma departments to cater for the needs of its population. Existing departments were also burdened by over utilization of their services.
CHAPTER 2
|
HOSPITALS SERVICES IN MALAYSIA
Nooraini B1, Teng S C2, Lailanor I3, Ahmad Razid S1, Sivasampu S4, Afidah A1, Laili Murni M2, Amiruddin S5, S Fauziah J5, Faridah O6.
1. Medical Practice Division, 2. Medical Development Division, MOH, 3. Kuala Lumpur Hospital, 4. Clinical Research Centre, Ministry of Health, 5. KPJ Healthcare Berhad, 6. Nursing Division, MOH
Summary: Eighty new hospitals have been built over the last 10 years. Although most of these were private hospitals, the public hospitals had the bulk of admissions and the most number of beds. As the national average for bed occupancy was only 50.57%, the efficiency of these hospitals can be further improved. Seventy four percent of the doctors (excluding housemen) were serving in the public hospitals. This chapter addresses the issues of provision and not financing.
The types of hospitals reported in this chapter are:
1. Public hospitals with acute care services under the Ministry of Health and public universities
2. Private hospitals with acute care services including private maternity centres as defined under the Private Healthcare Facilities and Services Act 1998
Throughout Malaysia there were a total of 334 hospitals providing acute care services in 2009. Of these, 232 (69%) hospitals responded to the survey and the remaining 102 (31%) hospitals were included in the final analysis based on the imputed values through regression methods (Fig 1).
Out of the 334 hospitals, 133 were public acute hospitals and 201 private acute hospitals, with a density of 0.12 hospital per 10000 population. There are 77 hospitals without specialist, 80 single specialty hospitals, 83 tertiary hospitals, and 94 secondary hospitals. Whereas, Australia, which has a 22 million population, has 737 public acute hospitals and 561 private acute hospitals for the corresponding period.1
Table 2.1 Distribution of Respondents and Non-respondents of Acute Care Services by Sector
Status Public Private Total
Overall, the state of Selangor and Wilayah Persekutuan Putrajaya combined had the highest number, with 57 (17%) hospitals, of which 11 were public hospitals and 46 private hospitals. This was followed by Wilayah Persekutuan Kuala Lumpur (WPKL) with 45 (13.4%) hospitals comprising of 4 public and 41 private hospitals. Johor was the third highest with 40 hospitals comprising of 11 public and 29 private hospitals. Perlis was the only state that has no private hospitals. If enumerated separately, both WP Putrajaya and WP Labuan did not have private hospitals and hence were served entirely by the public sector. However, WPKL had the highest density of hospitals in Malaysia with 0.26 per 10000 population. Possible explanations for high density are better developed states, more urban, better infrastructures, more affluent thus higher demand for hospital services particularly private services, and proximity to Singapore (in the case of Johor). Many of these hospitals are also tertiary hospitals with subspecialty services (Table 2.2).
Out of the total 47586 beds, 75% (35745 beds) were in the public sector and 25% (11841 beds) in the private hospitals. WPKL had the highest density of beds (6875 beds) that is 40.37 per 10000 population, followed by Pulau Pinang with 24.77 beds per 10000 population and Melaka with 21.86 beds per 10000 population. The least dense coverage was seen in Sabah and Wilayah Persekutuan Labuan with 12.36 beds per 10000 population (Table 2.3).
Organisation for Economic Co-operation and Development (OECD) countries reported and average of 38 beds per 10000 population for the year 20092 while Singapore had 26 beds per 10000 population in the year 2006. These are way higher than our national bed density of 17.06 per 10000 population for the same period. Obviously, there is still much room for expansion with regards to the provision of beds in acute hospitalsfor our population.
As for hospital doctors, the number and density were based on the information submitted by the hospitals. The total number of doctors (excluding housemen) was 14829, where 74% were in the public hospitals and 26% were in the private hospitals. The highest density of doctors was in WPKL with 19.81 per 10000 population. It must be pointed out that WPKL has the largest public hospitals, including Hospital Kuala Lumpur, University Malaya Medical Centre and Pusat Perubatan Universiti Kebangsaan Malaysian. The hospital doctor density for WPKL was more than double that of Melaka, the state with the next highest hospital doctor density (8.69 per population). Meanwhile the state with the least hospital doctor density was Sabah and WP Labuan, with 1.35 per 10000 population (Table 2.5).
In terms of inpatient admissions, it was found that there were 3,151,745 admissions for both public and private hospitals, with the majority of admissions (71%) seen in the public hospitals. Once again, WPKL had the highest rate of hospital admission with 1985.8 per 10000 population, followed by Pulau Pinang with 1797.75 per 10000 population. The least number of admissions was in Sabah and Wilayah Persekutuan Labuan, with 652.8 per 10000 population (Table 2.6).
Regarding bed utilisation, Malaysia had an average bed occupancy rate (BOR) of 50.57%, with 56.22% for the public hospitals and 46.66% for the private hospitals. Perlis had the highest BOR of 75.11%, followed by Kelantan with 65.37%. Sarawak had the lowest BOR of 36.54% (Table 2.7). However 75 of the private hospitals had missing values and imputation was therefore performed.
The average length of stay for acute care (ALOS) in Malaysia was 3.23 days, with the ALOS in public hospitals exceeding that of the private hospitals by 0.14 days. The request for transfer of acutely ill patients from private to public hospitals or the request for earlier discharge by the patients themselves due to economic reasons could be a factor. The state of Perlis had the longest ALOS of 3.70 days, versus the shortest ALOS of 2.30 days in Johor. Pearson (2009) reported that the ALOS for acute care hospital in OECD countries was 6.5 days.2
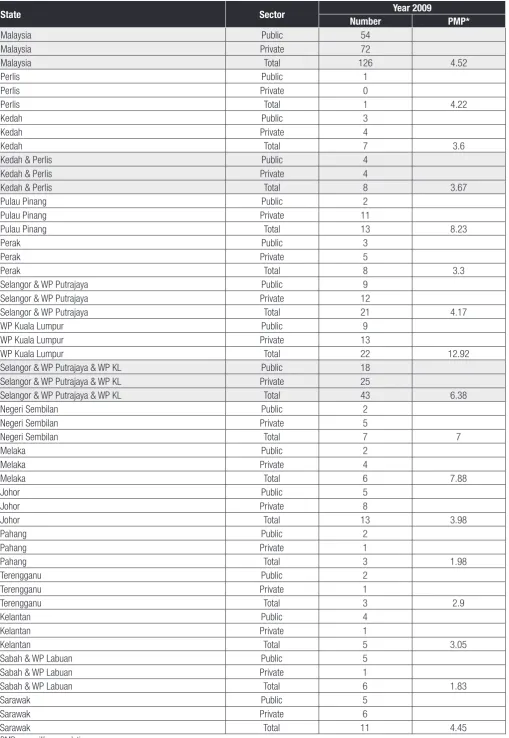
In total, Malaysia had 126 Computed Tomography Scanners (CT scan), of which 43% (54 scanners) were in the public hospitals and 57% in the private hospitals. WPKL had the most number of CT scanners, followed by Selangor and Pulau Pinang (Table 2.8). It is a deliberate policy of the MOH to place CT Scanners and MRIs only in our specialist hospitals with radiologists. This, together with our policy of regionalization of some specialty and subspecialty services will influence the differential distribution of CT scanners and MRI machines.
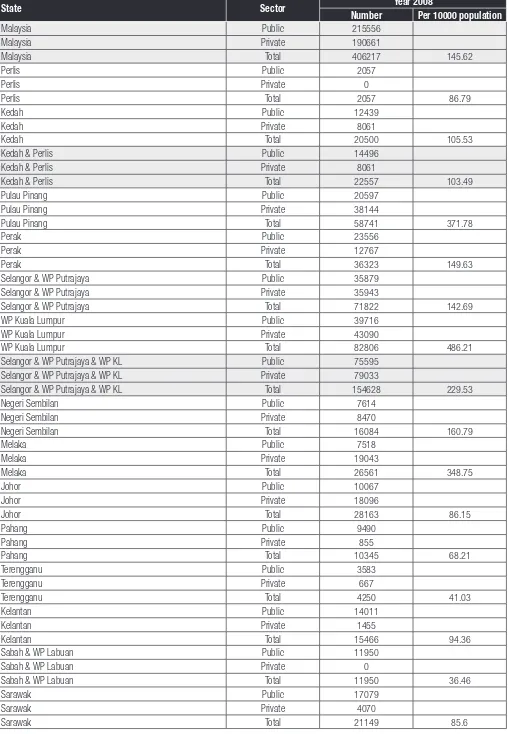
As for workload, the number of CT scans performed in Malaysia were 406217 or 145.6 per 10000 population, and 46% were performed in the public hospitals. WPKL had the highest rate of CT scans being performed, that is 486.21 per 10000 population, followed by Pulau Pinang with 371.78 scans per 10000 population; whereas Sabah and Wilayah Persekutuan Labuan had the lowest number with 36.5 scans per 10000 population (Table 2.9).
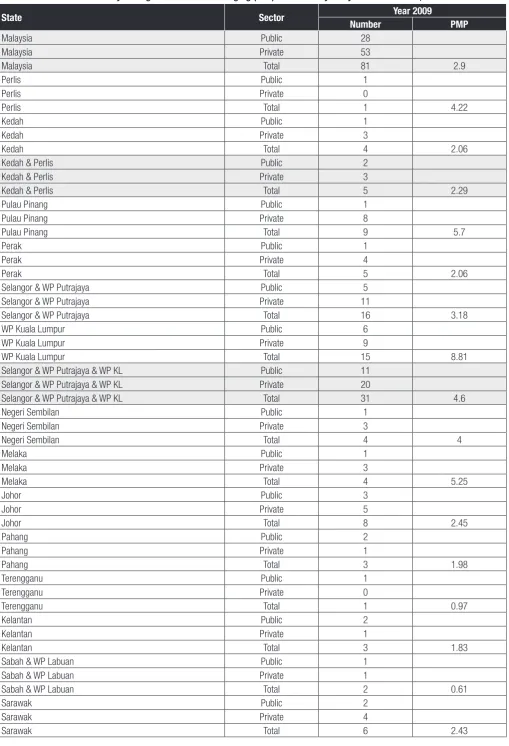
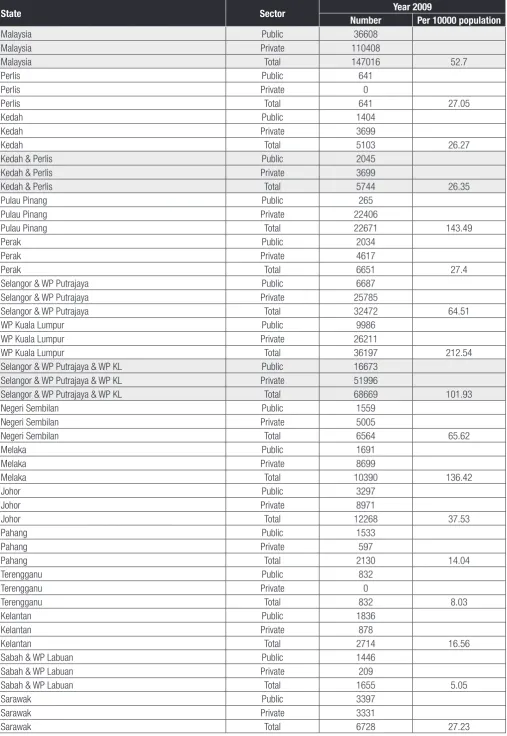
The total number of Magnetic Resonance Imaging (MRI) units in Malaysia was 81. Thirty five percent were in the public hospitals and 65% in the private sector. WPKL had the most number of MRIs that is 17 units, followed by Selangor with 16 units (Table 2.10). The number of MRI scans performed in Malaysia was 147016 or 52.7 per 10000 population. However, the majority (72%) of the MRI scans were performed in the private hospitals. Once again, WPKL had the highest number of MRI procedures being performed with 212.5 per 10000 population, followed by Pulau Pinang with 166.1 per 10000 population and Melaka with 143.5 per 10000 population (Table 2.11).
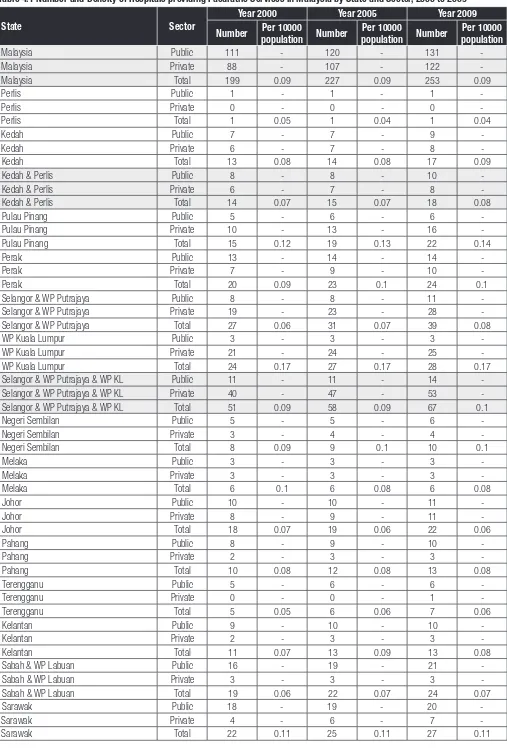
Table 2.2 Number and Density of Hospitals in Malaysia by State and Sector, 2000 to 2009
State Sector
Year 2000 Year 2005 Year 2009 Number Per 10000
Malaysia Private 141 - 172 - 201
-Malaysia Total 254 0.11 294 0.11 334 0.12
Perlis Public 1 - 1 - 1
-Perlis Private 0 - 0 - 0
-Perlis Total 1 0.05 1 0.04 1 0.04
Kedah Public 7 - 7 - 9
-Kedah Private 8 - 10 - 11
-Kedah Total 15 0.09 17 0.09 20 0.1
Kedah & Perlis Public 8 - 8 - 10
-Kedah & Perlis Private 8 - 10 - 11
-Kedah & Perlis Total 16 0.09 18 0.09 21 0.1
Pulau Pinang Public 5 - 6 - 6
-Pulau Pinang Private 17 - 20 - 23
-Pulau Pinang Total 22 0.17 26 0.18 29 0.18
Perak Public 13 - 14 - 14
-Perak Private 9 - 13 - 15
-Perak Total 22 0.1 27 0.12 29 0.12
Selangor & WP Putrajaya Public 8 - 8 - 11
-Selangor & WP Putrajaya Private 28 - 36 - 46
-Selangor & WP Putrajaya Total 36 0.09 44 0.09 57 0.11
WP Kuala Lumpur Public 4 - 4 - 4
-WP Kuala Lumpur Private 31 - 37 - 41
-WP Kuala Lumpur Total 35 0.25 41 0.26 45 0.26
Selangor & WP Putrajaya & WP KL Public 12 - 12 - 15
-Selangor & WP Putrajaya & WP KL Private 59 - 73 - 87
-Selangor & WP Putrajaya & WP KL Total 71 0.13 85 0.14 102 0.15
Negeri Sembilan Public 5 - 5 - 6
-Negeri Sembilan Private 4 - 5 - 6
-Negeri Sembilan Total 9 0.11 10 0.11 12 0.12
Melaka Public 3 - 3 - 3
-Melaka Private 4 - 4 - 4
-Melaka Total 7 0.12 7 0.1 7 0.09
Johor Public 10 - 10 - 11
-Johor Private 21 - 23 - 29
-Johor Total 31 0.11 33 0.11 40 0.12
Pahang Public 8 - 9 - 10
-Pahang Private 6 - 7 - 7
-Pahang Total 14 0.11 16 0.11 17 0.11
Terengganu Public 5 - 6 - 6
-Terengganu Private 0 - 0 - 1
-Terengganu Total 5 0.05 6 0.06 7 0.07
Kelantan Public 9 - 10 - 10
-Kelantan Private 2 - 3 - 3
-Kelantan Total 11 0.07 13 0.09 13 0.08
Sabah & WP Labuan Public 17 - 20 - 22
-Sabah & WP Labuan Private 5 - 6 - 6
-Sabah & WP Labuan Total 22 0.07 26 0.09 28 0.09
Sarawak Public 18 - 19 - 20
-Sarawak Private 6 - 8 - 9
Figure 2.1 Number of Hospitals in Malaysia by Sector, 2000 to 2009
Figure 2.2 Number of Hospitals in Malaysia by State and Sector in 2009
Table 2.3 Number and Density of Hospital Beds in Malaysia by State and Sector, 2000 to 2009
State Sector
Year 2000 Year 2005 Year 2009 Number populationPer 10000 Number populationPer 10000 Number populationPer 10000
Malaysia Public 29842 - 31438 - 35745
-Malaysia Private 9828 - 10682 - 11841
-Malaysia Total 39670 17.05 42120 16.12 47586 17.06
Perlis Public 404 - 404 - 404
-Perlis Private 0 - 0 - 0
-Perlis Total 404 19.46 404 18 404 17.05
Kedah Public 908 - 908 - 2183
-Kedah Private 417 - 443 - 451
-Kedah Total 1325 7.93 1351 7.31 2634 13.56
Kedah & Perlis Public 1312 - 1312 - 2587
-Kedah & Perlis Private 417 - 443 - 451
-Kedah & Perlis Total 1729 9.2 1755 8.47 3038 13.94
Pulau Pinang Public 1822 - 1930 - 1930
-Pulau Pinang Private 1782 - 1861 - 1983
-Pulau Pinang Total 3604 28.62 3791 25.81 3913 24.77
Perak Public 3330 - 3470 - 3470
-Perak Private 815 - 862 - 917
-Perak Total 4145 19.46 4332 19.2 4387 18.07
Selangor & WP Putrajaya Public 2823 - 2823 - 4625
-Selangor & WP Putrajaya Private 2173 - 2305 - 2707
-Selangor & WP Putrajaya Total 4996 11.93 5128 10.83 7332 14.57
WP Kuala Lumpur Public 4163 - 4163 - 4163
-WP Kuala Lumpur Private 2344 - 2549 - 2712
-WP Kuala Lumpur Total 6507 45.95 6712 43.13 6875 40.37
Selangor & WP Putrajaya & WPKL Public 6986 - 6986 - 8788
-Selangor & WP Putrajaya & WPKL Private 4517 - 4854 - 5419
-Selangor & WP Putrajaya & WP KL Total 11503 20.52 11840 18.82 14207 21.09
Negeri Sembilan Public 1419 - 1419 - 1527
-Negeri Sembilan Private 206 - 336 - 437
-Negeri Sembilan Total 1625 19.12 1755 18.55 1964 19.63
Melaka Public 1006 - 1006 - 1006
-Melaka Private 659 - 659 - 659
-Melaka Total 1665 27.8 1665 23.35 1665 21.86
Johor Public 2813 - 2813 - 3517
-Johor Private 744 - 799 - 1025
-Johor Total 3557 13.02 3612 11.65 4542 13.89
Pahang Public 1315 - 1735 - 1845
-Pahang Private 177 - 191 - 191
-Pahang Total 1492 11.31 1926 13.5 2036 13.42
Terengganu Public 1288 - 1364 - 1364
-Terengganu Private 0 - 0 - 18
-Terengganu Total 1288 12.11 1364 13.42 1382 13.34
Kelantan Public 2375 - 2399 - 2399
-Kelantan Private 59 - 142 - 142
-Kelantan Total 2434 15.59 2541 16.88 2541 15.5
Sabah & WP Labuan Public 2950 - 3770 - 3866
-Sabah & WP Labuan Private 167 - 184 - 184
-Sabah & WP Labuan Total 3117 9.94 3954 13.11 4050 12.36
Sarawak Public 3226 - 3234 - 3446
-Sarawak Private 285 - 351 - 415
Figure 2.3 Number of Hospital Beds in Malaysia by Sector from Year 2000 to 2009
Figure 2.4 Number of Hospital Beds in Malaysia by State and Sector in 2009
0
Table 2.4 Number of Acute Hospital Bed Strength and Sector, 2009
Bed Strength Public Private Total
Number Percentage Number Percentage Number Percentage
<=10beds 1 0.75 69 34.33 70 20.96
11-50beds 13 9.77 71 35.32 84 25.15
51-100beds 40 30.08 22 10.95 62 18.56
101-200beds 32 24.06 23 11.44 55 16.47
201-500beds 21 15.79 16 7.96 37 11.08
>500beds 26 19.55 0 0.00 26 7.78
Table 2.5 Number and Density of *Hospital Doctors in Malaysia by State and Sector, 2000 to 2009
State Sector
Year 2000 Year 2005 Year 2009 Number Per 10000
Malaysia Public 9217 - 9590 - 10918
-Malaysia Private 3086 - 3497 - 3911
-Malaysia Total 12303 5.29 13087 5.01 14829 5.32
Perlis Public 122 - 122 - 122
-Perlis Private 0 - 0 - 0
-Perlis Total 122 5.88 122 5.43 122 5.15
Kedah Public 114 - 114 - 582
-Kedah Private 108 - 116 - 121
-Kedah Total 222 1.33 230 1.24 703 3.62
Kedah & Perlis Public 236 - 236 - 704
-Kedah & Perlis Private 108 - 116 - 121
-Kedah & Perlis Total 344 1.83 352 1.7 825 3.79
Pulau Pinang Public 767 - 784 - 784
-Pulau Pinang Private 351 - 386 - 409
-Pulau Pinang Total 1118 8.88 1170 7.97 1193 7.55
Perak Public 918 - 947 - 947
-Perak Private 337 - 352 - 373
-Perak Total 1255 5.89 1299 5.76 1320 5.44
Selangor & WP Putrajaya Public 1130 - 1130 - 1836
-Selangor & WP Putrajaya Private 745 - 813 - 973
-Selangor & WP Putrajaya Total 1875 4.48 1943 4.1 2809 5.58
WP Kuala Lumpur Public 2381 - 2381 - 2381
-WP Kuala Lumpur Private 746 - 899 - 993
-WP Kuala Lumpur Total 3127 22.08 3280 21.08 3374 19.81
Selangor & WP Putrajaya & WPKL Public 3511 - 3511 - 4217
-Selangor & WP Putrajaya & WPKL Private 1491 - 1712 - 1966
-Selangor & WP Putrajaya & WP KL Total 5002 8.92 5223 8.3 6183 9.18
Negeri Sembilan Public 381 - 381 - 387
-Negeri Sembilan Private 117 - 138 - 147
-Negeri Sembilan Total 498 5.86 519 5.48 534 5.34
Melaka Public 478 - 478 - 478
-Melaka Private 184 - 184 - 184
-Melaka Total 662 11.05 662 9.28 662 8.69
Johor Public 704 - 704 - 830
-Johor Private 187 - 210 - 261
-Johor Total 891 3.26 914 2.95 1091 3.34
Pahang Public 318 - 567 - 573
-Pahang Private 64 - 77 - 77
-Pahang Total 382 2.9 644 4.51 650 4.29
Terengganu Public 482 - 488 - 488
-Terengganu Private 0 - 0 - 10
-Terengganu Total 482 4.53 488 4.8 498 4.81
Kelantan Public 775 - 779 - 779
-Kelantan Private 35 - 70 - 70
-Kelantan Total 810 5.19 849 5.64 849 5.18
Sabah & WP Labuan Public 274 - 340 - 348
-Sabah & WP Labuan Private 89 - 93 - 93
-Sabah & WP Labuan Total 363 1.16 433 1.44 441 1.35
Sarawak Public 373 - 375 - 383
-Sarawak Private 123 - 159 - 200
-Sarawak Total 496 2.4 534 2.31 583 2.36
Figure 2.5 Number of Hospital Doctors in Malaysia by Sector, 2000 to 2009
Figure 2.6 Number of Hospital Doctors in Malaysia by State and Sector in 2009
Table 2.6 Number and Rate of Hospital Admissions in Malaysia by State and Sector, 2009
Kedah & Perlis Total 240310 1102.54
Pulau Pinang Public 130949
Selangor & WP Putrajaya Public 298905
Selangor & WP Putrajaya Private 245551
Selangor & WP Putrajaya Total 544456 1081.66
WP Kuala Lumpur Public 170313
WP Kuala Lumpur Private 167884
WP Kuala Lumpur Total 338197 1985.77
Selangor & WP Putrajaya & WPKL Public 469218
Selangor & WP Putrajaya & WPKL Private 413435
Selangor & WP Putrajaya & WPKL Total 882653 1310.24
Negeri Sembilan Public 84720
Sabah & WP Labuan Public 209800
Sabah & WP Labuan Private 4185
Sabah & WP Labuan Total 213985 652.79
Sarawak Public 170067
Sarawak Private 16202
12
Figure 2.7 Number of Hospital Admissions in Malaysia by State and Sector in 2009
Table 2.7 Average Length of Stay (ALOS), Bed occupancy rate (BOR) and Turnover Interval (TOI)* among Hospitals in Malaysia, 2009
State Sector Year 2009 Year 2009 Year 2009
ALOS, days BOR, % *TOI, days
Malaysia Public 3.31 56.22 3.24
Kedah & Perlis Public 2.98 58.69 2.27
Kedah & Perlis Private 3.79 46.74 5.97
Kedah & Perlis Total 3.44 51.87 4.38
Pulau Pinang Public 4.09 68.06 2.16
Pulau Pinang Private 3.24 60.46 2.20
Pulau Pinang Total 3.49 62.72 2.18
Perak Public 2.80 46.94 3.43
Perak Private 2.27 39.31 5.18
Perak Total 2.50 42.60 4.43
Selangor & WP Putrajaya Public 3.47 57.55 2.82
Selangor & WP Putrajaya Private 4.84 55.50 3.44
Selangor & WP Putrajaya Total 4.56 55.92 3.31
WP Kuala Lumpur Public 6.14 66.38 4.39
WP Kuala Lumpur Private 3.31 46.94 7.44
WP Kuala Lumpur Total 3.62 49.09 7.10
Selangor & WP Putrajaya & WPKL Public 4.06 59.52 3.17
Selangor & WP Putrajaya & WPKL Private 4.27 52.31 4.93
Selangor & WP Putrajaya & WPKL Total 4.23 53.55 4.63
Negeri Sembilan Public 2.90 51.04 3.93
Negeri Sembilan Private 3.23 59.77 1.75
Negeri Sembilan Total 3.06 55.35 2.85
Melaka Public 3.14 64.25 2.62
Sabah & WP Labuan Public 3.63 52.65 4.11
Sabah & WP Labuan Private 2.00 25.17 8.21
Sabah & WP Labuan Total 3.19 45.24 5.22
Sarawak Public 3.24 40.04 5.67
Sarawak Private 2.06 30.83 16.94
Sarawak Total 2.79 36.54 9.95
Table 2.8 Number and Density of Computed Tomography Scanner in Malaysia by State and Sector, 2009
Kedah & Perlis Total 8 3.67
Pulau Pinang Public 2
Selangor & WP Putrajaya Public 9
Selangor & WP Putrajaya Private 12
Selangor & WP Putrajaya Total 21 4.17
WP Kuala Lumpur Public 9
WP Kuala Lumpur Private 13
WP Kuala Lumpur Total 22 12.92
Selangor & WP Putrajaya & WP KL Public 18
Selangor & WP Putrajaya & WP KL Private 25
Selangor & WP Putrajaya & WP KL Total 43 6.38
Negeri Sembilan Public 2
Sabah & WP Labuan Public 5
Sabah & WP Labuan Private 1
Sabah & WP Labuan Total 6 1.83
Sarawak Public 5
Sarawak Private 6
Sarawak Total 11 4.45
Table 2.9 Number and Rate of CT Scan Performed in Malaysia by State and Sector, 2008
Kedah & Perlis Total 22557 103.49
Pulau Pinang Public 20597
Selangor & WP Putrajaya Public 35879
Selangor & WP Putrajaya Private 35943
Selangor & WP Putrajaya Total 71822 142.69
WP Kuala Lumpur Public 39716
WP Kuala Lumpur Private 43090
WP Kuala Lumpur Total 82806 486.21
Selangor & WP Putrajaya & WP KL Public 75595
Selangor & WP Putrajaya & WP KL Private 79033
Selangor & WP Putrajaya & WP KL Total 154628 229.53
Negeri Sembilan Public 7614
Sabah & WP Labuan Public 11950
Sabah & WP Labuan Private 0
Sabah & WP Labuan Total 11950 36.46
Sarawak Public 17079
Sarawak Private 4070
Table 2.10 Number and Density of Magnetic Resonance Imaging (MRI) Unit in Malaysia by State and Sector, 2009
Kedah & Perlis Total 5 2.29
Pulau Pinang Public 1
Selangor & WP Putrajaya Public 5
Selangor & WP Putrajaya Private 11
Selangor & WP Putrajaya Total 16 3.18
WP Kuala Lumpur Public 6
WP Kuala Lumpur Private 9
WP Kuala Lumpur Total 15 8.81
Selangor & WP Putrajaya & WP KL Public 11
Selangor & WP Putrajaya & WP KL Private 20
Selangor & WP Putrajaya & WP KL Total 31 4.6
Negeri Sembilan Public 1
Sabah & WP Labuan Public 1
Sabah & WP Labuan Private 1
Sabah & WP Labuan Total 2 0.61
Sarawak Public 2
Sarawak Private 4
Table 2.11 Number and Rate of MRI Scan Performed in Malaysia by State and Sector, 2008
Kedah & Perlis Total 5744 26.35
Pulau Pinang Public 265
Selangor & WP Putrajaya Public 6687
Selangor & WP Putrajaya Private 25785
Selangor & WP Putrajaya Total 32472 64.51
WP Kuala Lumpur Public 9986
WP Kuala Lumpur Private 26211
WP Kuala Lumpur Total 36197 212.54
Selangor & WP Putrajaya & WP KL Public 16673
Selangor & WP Putrajaya & WP KL Private 51996
Selangor & WP Putrajaya & WP KL Total 68669 101.93
Negeri Sembilan Public 1559
Sabah & WP Labuan Public 1446
Sabah & WP Labuan Private 209
Sabah & WP Labuan Total 1655 5.05
Sarawak Public 3397
Sarawak Private 3331
Limitations
1. Recategorisation of facilities. For e.g. private hospitals changing status to private clinic within the 2008-2009 periods. Private hospitals changing management and name of facility however maintaining the same address. Similarly some maternity centres were closed or instead downsized to maternity homes that only conduct normal deliveries.
2. It is important to note that transmigration of patients across states occurs frequently and may not reflect the actual admission rate of the population in the individual states (Table 2.6). This is very obvious in states like Wilayah Persekutuan Kuala Lumpur and Selangor, Pulau Pinang, Kedah and Perlis.
3. Admission practices vary between public and private sector and states. For example, there is variation in admission practice for services like oncology, surgery and ophthalmology. As a result those receiving the same type of service may be counted as day surgery cases in some hospitals and not considered under the category of inpatient admissions in other hospitals.
4. The definition of total number of medical practitioners varies between public and private sector (Table 2.5). We were informed that some private hospitals consider medical practitioners as encompassing all the healthcare professionals in the institution. Also, there is likelihood that some public hospitals have included house officers in the tally of hospital doctors, while others have not. Another obvious limitation is that some specialists be working in more than one private hospital and therefore may have been counted more than once. This also includes public specialists working as locums in private hospitals.
5. The different types of hospital, i.e. with or without specialty services, was not taken into consideration in the calculation of BOR (Table 2.6.) For e.g. Hospital Melaka, a specialist hospital, has a BOR of 89.5% (2007)5 compared to the BOR of a non specialist like Hospital Jasin with a much lower BOR of 30.24% (2007 either because of bypassing the non-specialist hospital in preference of the specialist hospital or a need to transfer patients to the specialist hospital for appropriate care.
References
1. Australian Institute of Health and Welfare 2010. Australian hospital statistics 2008-09. Health Services Series no. 17. Cat. No. HSE 84. Canberra: AIHW.
2. Pearson, M. Written Statement to Senate Special Committee on Aging. OECD Sept 2009.
3. Ministry of Health Singapore at http://www.moh.gov.sg/mohcorp/hcservices.aspx . (Accessed 3rd November 2010 )
4. Canadian Institute for Health Information, Medical Imaging in Canada, 2007 (Ottawa, Ont.: CIHI, 2008)
CHAPTER 3
|
MATERNITY SERVICES IN MALAYSIAN HOSPITALS
Ravindran J1, Soon R2, Jamil MA3, J. Ravichandran4, Ghazali I5, Mymoon A6, Arpah A6, Lee KY7
1 Hospital Kuala Lumpur, 2 Hospital Wanita dan Kanak-kanak, Sabah, 3 Pusat Perubatan Universiti Kebangsaan Malaysia, 4 Hospital Sultan Aminah, Johor, 5 Hospital Sultan Ismail, Johor, 6 Medical Development Division, MOH, 7 Clinical Research Centre, Ministry of Health.
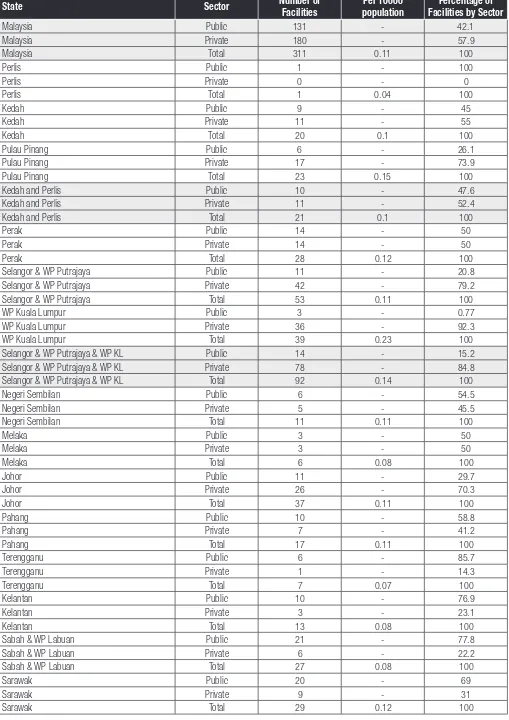
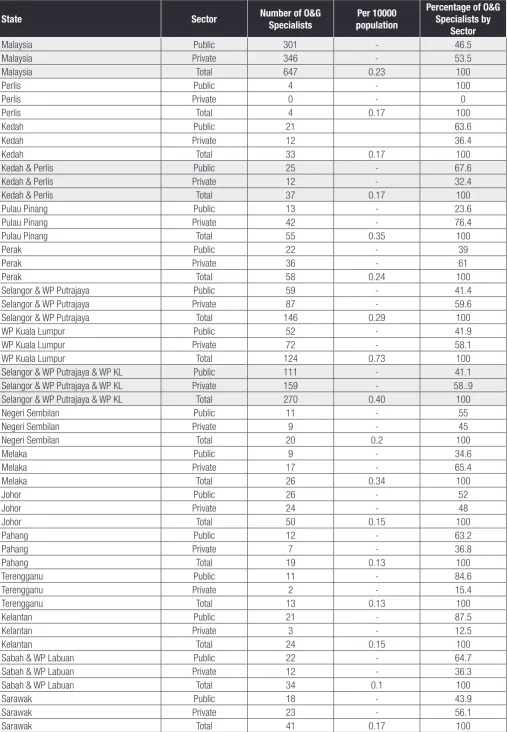
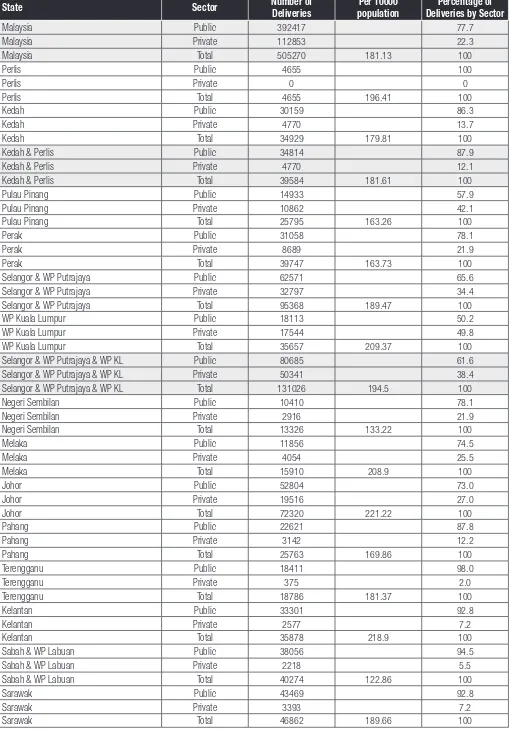
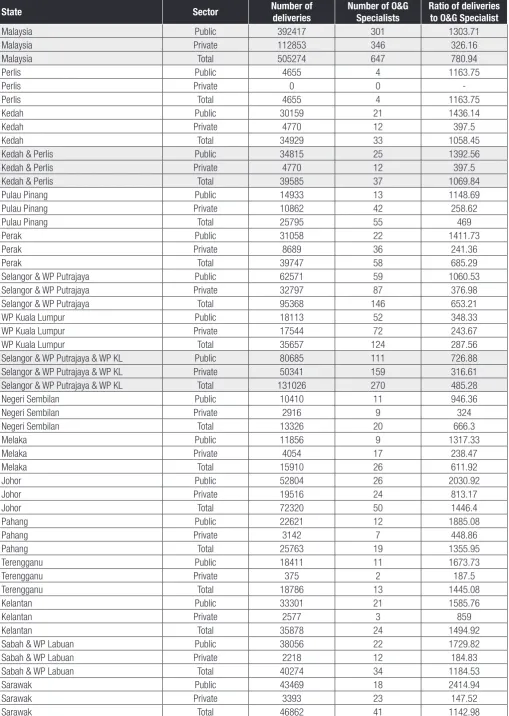
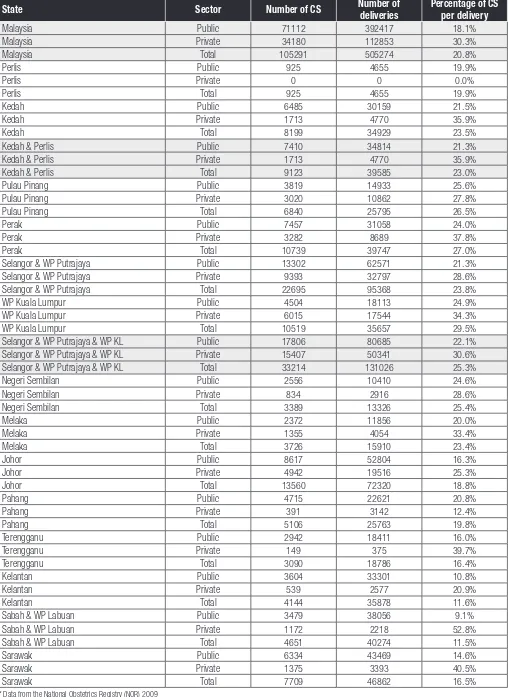
Summary: This chapter highlights 5 key indicators; 1) number and density of hospitals providing maternity services, 2) number and density of obstetrics & gynaecologists (O&G) specialists, 3) number and rate of deliveries, 4) ratio of delivery to O&G specialist and 5) number and percentage of Caesarean Section (CS) per delivery in Malaysia, by state and sector in 2009. The 311 hospitals that provide maternity services in the country have 647 O&G specialists and they have conducted 505270 deliveries and 105291 CS in 2009. Overall, there is mal-distribution in the workforce and in the workload between the public and the private sector and between different regions in the country. There is also a higher CS rate in the private sector compared to the public sector.
This survey on maternity services was conducted in all inpatient establishments that receive and provide nursing and midwifery care for women in labour or for women immediately after childbirth. Other facilities which do not have inpatient facilities but do provide delivery services for women in labour, for example, the rural health clinics especially in the states of Sabah and Sarawak in East Malaysia, were not included in this survey.
A total of 341 facilities were invited to participate in this survey but 30 of these were excluded as these facilities did not provide maternity services or had no beds. Response rate of the remaining 311 hospitals was 70.4% (219 of 311 facilities). For one facility which had missing data for the number of deliveries and 115 facilities with missing data on the number of Caesarean Sections performed, we used statistical regression methods to impute the data.
Data was presented according to states. However, cross border migration to seek maternity services especially within the KL-Selangor-WP region and the Kedah-Perlis region and all other state borders were likely to occur.
Wilayah Persekutuan Kuala Lumpur (WP KL) recorded the highest density of maternity services at (0.23) per 10000 population, followed by Penang (0.15 per 10000 population) and Selangor/WP Putrajaya at (0.14 per 10000 population). These three states had more private hospitals providing maternity services (92.3% in WP KL, 79.2% in Selangor/WP Putrajaya and 73.9% in Penang) than the public hospitals. For states with low density of maternity services, Perlis had the lowest number with only one public hospital for the whole state and no private facilities. Terengganu was the state with the second lowest density; 6 out of the 7 facilities were public hospitals and only one was private hospital. While in Sarawak, Sabah, Kelantan, Terengganu, Pahang, Negeri Sembilan and Perlis, public maternity services outnumbered private maternity facilities. (Table 3.1)
Malaysia had 647 Obstetrics and Gynaecology (O&G) specialists; 346 (53.5%) of which were in the private sector. Wilayah Persekutuan Kuala Lumpur had the highest number of O&G specialists at 0.73 per 10000 population while Penang came in second with 0.35 per 10000 population. Out of a total of 15 states, 9 had low numbers of O&G specialists (0.20 or less per 10000 population); the lowest was Sabah, with only 0.10 specialists per 10000 population. There were generally lower numbers of O&G specialists providing maternity services in the East Coast states of Peninsular Malaysia (Kelantan, Terengganu and Pahang) and in East Malaysia (Sabah and Sarawak).
Apart from that, there was a disparity between the distribution of O&G specialists between the private and public sectors especially in those states with higher density of O&G specialists. For example, in Penang, 76.4% of the O&G specialists were serving in the private sector, followed by Melaka (65.4%) and Perak (61%). Likewise, in Selangor/ WP Putrajaya, 59.6% of O&G specialists work in the private sector, while the number is 58.1% in WPKL. (Table 3.2)
In this survey, 505,274 deliveries were reported for 2009. This did not include home deliveries, deliveries in transit, deliveries in alternative birthing centers (both urban and rural) and deliveries in non responding centers. This figure was apparently higher than estimated live birth figures given by the Health Management Information System (HMIS). This may be due to the fact that our survey captured information on citizens, non citizens and even illegal immigrants who had given birth in facilities participating in the survey.
The O&G specialists in public facilities had a higher workload with 1303.72 deliveries per O&G specialist compared with 326.17 deliveries per specialist in the private facilities. The highest workload is seen among public specialists in Sarawak (2414.94 deliveries per O&G specialist) and this is followed closely by public specialists in Johor (2030.92 deliveries per O&G specialist). By contrast, the lowest workload of 147.52 deliveries per O&G specialist was recorded among private O&G specialists in Sarawak (Table 3.4)
There were a total of 105291 Caesarean Sections (CS). This accounted for 20.8% of all deliveries captured in this survey. This rate was higher than a previously reported figure of 15.7% published for 2006.1 The CS rates per delivery in public hospitals were 18.1% compared with 30.3% in private facilities. The highest CS rate was in WP KL where 29.5% of all deliveries were by Caesarean Sections compared with Sabah and Kelantan which had the lowest CS rates of 11.5% and 11.6% of all deliveries respectively. All the states, with the exception of Pahang and Perlis, registered more CS in private facilities compared with public facilities. In Sabah, the rate of CS in private facilities was five times higher than the rate in public facilities; In Sarawak; the rate was 3 times higher. (Table 3.5
Table 3.1 Number and Density of Hospitals Providing Maternity Services in Malaysia by State and Sector, 2009
State Sector Number of
Facilities
Pulau Pinang Public 6 - 26.1
Pulau Pinang Private 17 - 73.9
Pulau Pinang Total 23 0.15 100
Kedah and Perlis Public 10 - 47.6
Kedah and Perlis Private 11 - 52.4
Kedah and Perlis Total 21 0.1 100
Perak Public 14 - 50
Perak Private 14 - 50
Perak Total 28 0.12 100
Selangor & WP Putrajaya Public 11 - 20.8
Selangor & WP Putrajaya Private 42 - 79.2
Selangor & WP Putrajaya Total 53 0.11 100
WP Kuala Lumpur Public 3 - 0.77
WP Kuala Lumpur Private 36 - 92.3
WP Kuala Lumpur Total 39 0.23 100
Selangor & WP Putrajaya & WP KL Public 14 - 15.2
Selangor & WP Putrajaya & WP KL Private 78 - 84.8
Selangor & WP Putrajaya & WP KL Total 92 0.14 100
Negeri Sembilan Public 6 - 54.5
Negeri Sembilan Private 5 - 45.5
Negeri Sembilan Total 11 0.11 100
Melaka Public 3 - 50
Sabah & WP Labuan Public 21 - 77.8
Sabah & WP Labuan Private 6 - 22.2
Sabah & WP Labuan Total 27 0.08 100
Sarawak Public 20 - 69
Sarawak Private 9 - 31
Table 3.2 Number and Percentage of *O&G Specialists in Malaysia by State and Sector, 2009
State Sector Number of O&G Specialists
Kedah & Perlis Public 25 - 67.6
Kedah & Perlis Private 12 - 32.4
Kedah & Perlis Total 37 0.17 100
Pulau Pinang Public 13 - 23.6
Pulau Pinang Private 42 - 76.4
Pulau Pinang Total 55 0.35 100
Perak Public 22 - 39
Perak Private 36 - 61
Perak Total 58 0.24 100
Selangor & WP Putrajaya Public 59 - 41.4
Selangor & WP Putrajaya Private 87 - 59.6
Selangor & WP Putrajaya Total 146 0.29 100
WP Kuala Lumpur Public 52 - 41.9
WP Kuala Lumpur Private 72 - 58.1
WP Kuala Lumpur Total 124 0.73 100
Selangor & WP Putrajaya & WP KL Public 111 - 41.1
Selangor & WP Putrajaya & WP KL Private 159 - 58..9
Selangor & WP Putrajaya & WP KL Total 270 0.40 100
Negeri Sembilan Public 11 - 55
Negeri Sembilan Private 9 - 45
Negeri Sembilan Total 20 0.2 100
Melaka Public 9 - 34.6
Sabah & WP Labuan Public 22 - 64.7
Sabah & WP Labuan Private 12 - 36.3
Sabah & WP Labuan Total 34 0.1 100
Sarawak Public 18 - 43.9
Sarawak Private 23 - 56.1
Sarawak Total 41 0.17 100