12
The Impact of Corporate Image of PT XYZ towards Job Applicant Attraction in
Surabaya
Janice, Jessica Inez Leosaputro
International Business Management Program, Petra Christian University Jl. Siwalankerto 121-131, Surabaya
E-mail: [email protected], [email protected]
ABSTRACT
Human capital is considered as a crucial factor that can impact company performance. It is expected that Indonesia will face talent scarcity (BCG, 2013). In Surabaya, PT XYZ also competes with other companies to attract the best talents to join the company. This research is conducted with the aim to find out the effect of corporate image in attracting job applicants. The data was gathered using simple random sampling by distributing questionnaires to 109 respondents in Surabaya. The data was analyzed by using Multiple Linear Regression Analysis. The result shows that the corporate image simultaneously has significant impact on job applicant attraction. Meanwhile, as individual dimension, employer image and CSR image has significant impact toward job applicant attraction.
Keywords: Human capital, corporate image, job applicant attraction, regression.
ABSTRAK
Sumber daya manusia merupakan salah satu faktor krusial yang dapat mempengaruhi performa perusahaan. Berdasarkan prediksi, Indonesia akan menghadapi kelangkaan tenaga kerja terdidik (BCG, 2013). Di Surabaya, PT XYZ juga bersaing dengan perusahaan-perusahaan lainnya untuk menarik minat tenaga kerja terbaik untuk bergabung dengan mereka. Penelitian ini dilakukan untuk mengetahui efek dari corporate image terhadap minat pelamar kerja. Data diperoleh menggunakan metode simple random sampling dengan mendistribusikan kuesioner kepada 109 responden di Surabaya. Data kemudian dianalisa dengan menggunakan analisa Regresi Linear Berganda. Hasil penelitian menunjukkan bahwa corporate image secara keseluruhan mempunyai pengaruh yang signifikan terhadap minat pelamar kerja. Secara dimensi individu, employer image dan CSR image mempunyai pengaruh yang signifikan terhadap minat pelamar kerja.
Kata Kunci: Sumber daya manusia, corporate image, ketertarikan pelamar kerja, regresi.
INTRODUCTION
Human Capital is believed as a crucial factor that can determine the overall performance and also the future of a company. According to Wasik (2013), human capital has the most impact for business future. As human capital is such an important part, companies begin to put their focus more on employee attraction, retention, and engagement (Bersin, 2013).
Attraction is believed as the most influential stage in recruitment process as without attraction, all other stages cannot be done. Attracting job applicants is important as by having more people to apply for the job, company can be more selective and choose the best candidates that can help the company to grow further (Carlson, Connerley & Mecham III, 2003). One of the best ways to attract the best talents to join the company is by selling their corporate image. Early researches suggested that the perception of the
company influence job applicants to decide whether they should pursue the job or not (Carpenter, 2013). This is supported by a research conducted by public relations consultants Hill & Knowlton which states that 96% of 527 MBA students of 12 top-universities in United States, Europe and Asia said that reputation was an important factor in their
choice of potential employer” (in Auger, Devinney,
Dowling, Eckert and Lin, 2013, para. 2).
13 Head of Surabaya Chambers of Commerce and Industry, Djamhadi, who says in an article that 53% of labor force in East Java are still under qualified (Prasojo, 2014). It is supported by the data from by Dinas Tenaga Kerja, Transmigrasi dan Kependudukan Provinsi Jawa Timur (2014) that stated in East Java, for the year 2013, there were as much as 956,667 job vacancies available. Out of those vacancies, 794,754 of them are for D-1, S-1, and S-2 graduates. On the other hand, there were only as much as 819,958 applicants, while only 95,351 of them were coming from D-1, S-1, and S-2 graduated applicants.
As the competition to gain the best talent is predicted to be tighter, this research aim to examine whether building corporate image will have a positive impact towards the company recruitment issue in attracting best talents, specifically in the case of PT XYZ. PT XYZ is one of the biggest manufacturing companies in Indonesia, which has total market share more than 30% in terms of particular fast-moving consumer goods (FMCG) products.
LITERATURE REVIEW
Corporate Image
According to Highhouse, Brooks and Gregarus (2009),
corporate image is “the foundation of collective corporate
reputation assessments”. It means, corporate image is something perceived by individual while reputation is collective assessment from individuals. The image held by individuals does not necessarily mean that the company really possesses it. Highhouse et al, (2009) define corporate image to have four dimensions which are employer image, market image, financial image, and CSR image.
All these dimensions that have been identified by researchers may not be suitable in all cases. Lemmink et al. (2003) stated that each organization will be perceived through different aspects according to the image that the company has and therefore, it will be inevitable that the dimensions to describe each company need to be customized
to adjust with company’s situation. In this current research, the definition and framework of the corporate image will be adopted from the theory suggested by Highhouse et al. (2009) as the dimensions provided by Highhouse et al. (2009) is in accordance with the corporate image that is tried to be built by PT XYZ as shown in their vision, which are employer image, market image and CSR image.
According to Highhouse (2009), employer image is
“the image of the organization as an employer, including how well they treat the employees” (in Carpenter, 2013
p.14). Also the employer image can be acknowledged based
on “the value of impressions and the perceptions about the hiring organization.” (in Carpenter, 2013, p.41). Each of the
hiring company might possess different image based on the
company’s performance in related with how well they treat the employee and also the prospective employee.
Market image is defined as “the image of the organization as a producer of goods and/ or services” (in
Carpenter, 2013, p.41). In the research of Carpenter (2013), market image is explained to be “influenced by the quality of
the goods and services produced by the company” (p.44). It
is considered as the most accessible one for public which means public will have more information regarding the market image.
CSR image defined by Aguinis and Glavas (2012) as
“context-specific organizational actions and policies that take
into account stakeholders’ expectations and the triple bottom line of economic, social and environmental performance” (in
Carpenter, 2013, p.47). Lai et al., (2010) also stated that CSR image can be defined as the perception of the stakeholder for
the company’s responses toward the “general social concern” that happens around the stakeholders (in Perez &
Bosque , 2012 p.1).
Job Applicant Atrraction
Based on the definition from Equal Employment
Opportunity Commission’s (EEOC) Uniform Guidelines on
Employee Selection Procedures (n.d), job applicant is an individual who shows interest to be hired or recruited in employment opportunities. The applicants can show their interest to the organization through the submission of resumes, application forms, and other methods depending on
the organization’s requirements.
Connerley, Carlson and Mecham III (2003) define
attraction as job applicant’s overall organization assessment related with the organization attractiveness. It is resulted by
organization’s activities to obtain individuals to apply for a
job in the company. According to Turban, Forret and
Hendrickson (1998), understanding job applicant’s attraction
and the factors that influence it is particularly important because it serves as a point that attracts the best quality applicants to put in their application for the job. The inability of the company to attract highly qualified applicants will subside the efficacy of the recruitment. Many factors at varying degrees are considered to be able to influence
applicant’s attraction and the most recognized one is
corporate image.
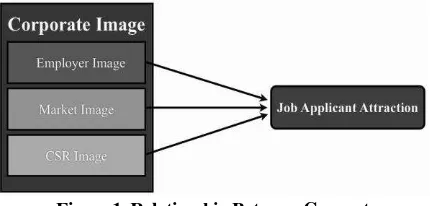
Relationship Between Concepts
The corporate image to be used in this research is based on the theory from Highhouse et al. (2009) which consists of employer image, market image, and CSR image. The attraction indicators coming from Fisher et al. (1979) and Highhouse et al. (2003) are general attractiveness, intention and prestige. This section will discuss the relationship between the corporate image and job applicant attraction.
14 ethical the company. As suggested by Chatman (1989), applicants are more attracted to companies that they believe have values and norms. Below is the model of the relationship between concepts suggested by this current research.
Figure 1. Relationship Between Concepts
Similarly with this research assumption that there is relationship between corporate image with job applicant attraction, a research conducted by Kim et al., (2012) also have similar assumption. The research by Kim et al., (2012) use corporate image which has similar measurement with
both employer and market image in the writers’ research and also employer brand equity which has similar defition as
employer image in the writers’ research. This research confirms the writers’ theoretical framework, using Highhouse (2009)’s corporate image dimensions, which
incorporated both Kim et al., (2012) corporate image and employment brand equity. The result of Kim et al. (2012) study shows that employment brand equity has significant influence on intention to pursue job opportunity has
confirmed the writers’ hypothesis regarding employer
image. However, their research in hospital industry showed that there was no significant relationship between corporate image and the intention to pursue job opportunity. Therefore, in this current research, the writers try to examine the relationship between those two dimensions in order to re-confirm the outcomes in PT XYZ as suggested by Kim et al. (2012) who stated in the journal that the outcomes might differ in other industry and other country outside South Korea.
This current research is also supported by the research of Lemmink, Schuijf and Streukens (2003). The result of
Lemmink et al. (2003) also supports the writer’s theoretical
background which involves the corporate image and the company employment image to explain the application intentions of the job applicants. It has been proven in the result that both corporate image and the company employment image has positive significant result towards the job applicants intention.
Moreover, even though Tsai and Yang research used different theory which was based on the marketing theory from Keller (2000), three out of four image dimensions used (i.e. corporate product image, corporate credibility image and corporate citizenship image) have much similarity in the definition with the dimensions from Highhouse (2009). This research confirmed writers; theoretical background as this research also use the corporate image as independent variable and organizational attractiveness which has the same
definition as job applicant attraction in the current research as the dependent variable. The research by Tsai and Yang has shown that all the dimensions of corporate image have significant influence on organizational attractiveness.
The writers has developed four hypotheses regarding the research outcome, which are as follows:
H1: Corporate Image of PT XYZ simultaneously has significant influence in attracting job applicants.
H2: Employer Image of PT XYZ has significant influence in attracting job applicants
H3: Market Image of PT XYZ has significant influence in attracting job applicants
H4: CSR Image of PT XYZ has significant influence in attracting job applicants
RESEARCH METHOD
The purpose of this study is to observe the relationship between corporate image of PT XYZ and their job applicant attraction through theories and by conducting hypotheses testing. Therefore, in this current study, the writers conduct causal-explanatory study. Causal-explanatory study is used to learn about the relationship between variables. This study goes further than descriptive study which only describe an event. Explanatory study tries to explain why it happens through theories and hypotheses. Through causal-explanatory study, the writers will be able to test the hypotheses and understand the influence of each corporate dimensions toward job applicant attraction.
In this research, the writers try to find out the corporate image impact on the job applicant attraction, hence, the dependent variable will be the job applicant attraction. It will be measured by using five items from Highhouse et al. (2003), which is basically perfecting the previous theory originated from Fisher et al. (1979). Those items include
‘The applicant’s intention to apply to the company if they are offered’, ‘The applicant’s intention to accept the job if offered’, ‘The applicant’s attraction level to work for the company’, ‘The applicant’s knowledge about the company that makes them interested or disinterested’ and ‘The applicant’s perception about the reputation of the company’.
In this research, the independent variable is corporate image which is represented by the three out of four dimensions of corporate image, which are employer image, market image, and CSR image originated from Highhouse et al,. (2009). Since in his journal, Highhouse et al. (2009) provide no measurement regarding the corporate image dimension, hence, the writers adopt the measurement concept from Fombrun et al (2000).
To measure employer image, five items are used based on the concept from Fombrun et al. (2000). The five items of
statement used are ‘The company gives competitive working
15 To measure market image, three items are used based on the concept from Fombrun et al. (2000). According to Fombrun et al. (2000), in terms of market image, there are four indicators which can be used as the measurement. Those
indicators are ‘stand behind’, ‘product’s innovativeness’, ‘product’s quality’ and ‘product’s value for money’.
However, due to the nature of the product offered by the company that does not provide any guarantee, only three indicators will be used in this current research as the indicators for measuring market image. The three items of
statement used are ‘The company has the ability to produce unique products’, ‘The company has the ability to produce high quality products’ and ‘The company produce product that has a good value of money’.
To measure CSR image, three items are used based on the concept from Fombrun et al. (2000). The three items of
statement used are ‘The company has shown that it supports charity’, ‘The company is responsible towards the environment’ and ‘The company has shown good treatment
towards people’.
In this current research, the type of data that will be used are nominal, ordinal, and interval data. Nominal data are used for the classification questions of the respondents such as gender, university origin, occupation and domicile. Ordinal data are used for age classification and working experience. Those questions use nominal and ordinal data since the alternatives given by the writers and chosen by the respondent merely showing the information regarding the
respondent’s profile without any clear distinction or ranks between categories.
Another type of data that will be used is interval data.
In this current research, the respondent’s responses in
choosing their preferred scale (out of the 6 points Likert scale) based on the indicators stated in the questionnaire for each dependent and independent variables will be summed to obtain the total score that represent each of the variables. The total score is classified as interval data.
In creating the questionnaires, the writers prefer the Likert scale since it allows the respondent to choose which statement that describes their preference or opinion the best (Kumar, 2012). 6-points of Likert scale is chosen since the writers prefer to have even number of category to force respondents to chosse between agree and disagree to avoid middle point or neutral opinion, while at the same time provide objective response from respondents (Maholtra, 2010). Moreover, according to the previous researchers, number of categories more than 7 will be less efficient (Aguirre, 2010).
The population in this current study will focus on talents (i.e., S-1 graduates with maximum two years of working experience or S-1 students who would like to work in a company) in Surabaya. This research use simple random sampling as the sampling method. This sampling method is used to achieve generalizability. Even though the desired sample frame is not available, the writers try to be as random as possible in obtaining the sample. In order to gain randomness in taking sample for S-1 students, the writers distribute the questionnaire to several universities which are located in all areas in Surabaya (West, East, North, South and
Central Surabaya) such as Universitas Ciputra, Universitas Kristen Petra, Universitas Surabaya, Universitas Airlangga, Universitas Widya Mandala, and institut Sains Terapan dan Teknologi Surabaya. To have random sample for S-1 graduates with maximum two years experience, the writers will spread the questionnaire to the desired population in the malls throughout Surabaya (e.g. Galaxy Mall, Tunjungan Plaza, Supermall Pakuwon Indah, Ciputra World Surabaya and Royal Plaza) as malls are the common place for all people from all social range to gather in Surabaya.
Validity test is done to ensure that the indicators being used are right. According to Ghozali (2011), validity test is conducted by comparing the value of r that is calculated from the questionnaire result (r-data) with the r value in the table (r-table). The r- data can be checked from the SPSS output, which is the located in the Correlated Item – Total Correlation column. The r-table can be seen from the 2-tailed table with the degree of freedom (df) of n – 2 with n as the number of sample. If the r- data is bigger than the r-table, then the indicators are said as valid. All indicators used for particular variable must fulfill this criteria.
Reliability test is also done to ensure that the indicators used are free from random error (Cooper and Schindler, 2011). As stated by Pallant (2005), the second way to test reliability is through internal consistency test. It tests the consistency of the measuring indicators. This test is
measured from the Cronbach’s Alpha. According to Ghozali (2011), if the Cronbach’s Alpha of a variable is higher than
0.7, that particular variable can be concluded as reliable. The
higher the Cronbach’s Aplha (closer to 1), the better the
reliability of that particular variable.
In order to measure the relationship between corporate image job applicant attraction, this current study uses multiple linear regression analysis. As stated by Cooper and Schindler (2011), this type of regression is used when there is one dependent variable with more than one independent variables. Through this multiple linear regression analysis, the value of dependent variable can be predicted. Below is the multiple linear regression equation.
Y
�= β + β X
�+ β X
�+ ⋯ +
β X
�+ �
�(3.2)
Which:
Y� =The i-th observation of the dependent variable.
β =Constant value (the value of Y when all X equals to zero).
16 β , … , β =The slope coefficients for each of the
independent variables.
�� =The error term in i-th observation (normally assumed to be zero)
As part of the multiple regression, F-test is done. It is a test to measure the overall significance of the model. It tries to examine appropriateness of the regression model be used in the research. It means it tries to analyze whether all of the independent variables that is included in the regression model have significant impact toward the dependent variable or not. Ghozali (2011) asserts that in order to test the hypothesis developed using F- test, researcher might either look at the significance F or at the F- value. This current research use the confidence level of 95%, therefore, the significance level is 5%. Significance F is compared to the significance level. If significance F is less than 5% significance level, it means the H0 is rejected. On the other hand if significance F is more than 5% significance level then the H0 cannot be rejected. Meanwhile, F-value test) is compared to the F-table (F-critical value). If F- value (F-test statistic) is greater than the table (critical value), H0 can be rejected. However, if F-value (F-test statistic) is lower than the F-table (F-critical value), the H0 cannot be rejected.
t-test is also done to determine the influence of the relationship between each independent variable toward the dependent variables by using significance t (P- value) or t-value (t-test statistic). As stated by Ghozali (2011), there are two ways to test the hypothesis which are through significance t and t-value (t-test statistic). Significance t (P- value) is compared with significance level ( ), while t-value (t-test statistic) is compared with t-table (t-critical value). In this current research, confidence level of 95% is used. The t-critical value can be obtained from 2-tailed t-table with significance level of 5%. Therefore, significance t (P-value) of less than 0.05 indicates that the H0 is rejected. On the other hand if the significance t (P-value) is greater than 0.05, the H0 fail to be rejected. Similarly, if t-value (t-test statistic) is lower or greater than +/- t-table (t-critical value), it indicates that H0 is rejected which means there is significant relationship between that particular independent variable with the dependent variables. On the other hand if t-value (t-test statistic) is in between the + t-table and – t-table, it indicates that H0 fail to be rejected. Furthermore, the t-test result will also show the coefficient of the variables involved in the research. Since this research uses the Likert scale, which use the respondents opinion as the base of the choice made, the coefficient used will be standardized coefficient beta since it standardized all the measurement. As asserted by Starkweather and Herrington (2014) the standardized coefficient beta is suitable to be used in social research which
analyze the society’s opinion.
Last, adjusted R square is done as the indicator to show how well an model in describing the real condition in the population. Cooper and Schindler (2011) states that the more the result of the adjusted R square close to 1, the better the model describe the condition of the population in the reality.
RESULTS AND DISCUSSION
Table 1. Validity Statistic of Employer Image
Variable Corrected Item – Total
Correlation Information
Salary 0.539 Passed
Benefit 0.645 Passed
Management 0.448 Passed
Culture 0.452 Passed
Relationship 0.480 Passed
Table 2. Validity Statistic of Market Image
Variable Corrected Item – Total
Correlation Information
Unique 0.646 Passed
Quality 0.732 Passed
Value 0.672 Passed
Table 3. Validity Statistic of CSR Image
Variable Corrected Item Correlation – Total Information
Charity 0.541 Passed
Responsible 0.675 Passed
Rights 0.532 Passed
In order to test the validity of the data, the r-value of the questionnaire result (data) will be compared with the r-value from the table (r-table) based on degree of freedom (df) of n-2. As there are 110 questionnaires distributed and 109 of them are returned, the value of n-2 will be 107. Based on the degree of freedom of 107, the r-table is 0.1882 and it will be compared with the r-data is taken from the Corrected Item – Total Correlation column. If it is higher than the r-table, it is regarded as valid. The result shown in table 1, table 2, and table 3 shows that all indicators used to measure the respective variables are valid as they all have corrected item-total correlation value higher than 0.1882.
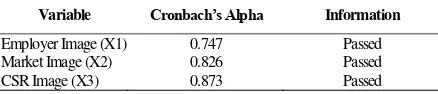
Table 4. Reliability Statistic
Variable Cronbach’s Alpha Information
Employer Image (X1) 0.747 Passed
Market Image (X2) 0.826 Passed
CSR Image (X3) 0.873 Passed
In order for the data to be considered as reliable, the
value of the Cronbach’s Alpha of each variable must be
higher than 0.7 (Ghozali, 2011). Table 4 shows that all
variables are reliable as the Cronbach’s Alpha of all variables
are higher than 0.7. Table 5. ANOVA Table
Variable F-value Significance Level Information
Regression 16.635 0.000 Significant
17 accept the first alternative hypothesis consequently. Based on the two approaches, the researcher obtain uniformed result which shows that Corporate Image has significant influence towards the Job Applicant Attraction.
This current research result confirms the previous research conducted in 1993 by Gatewood, Gowan, and Lautenschlager (1993) and Highhouse, et al. (2009) which found that corporate image has significant correlation with the job applicant intentions to apply for a job in a company (in Lemmink, et al., 2003, p. 2). Moreover, the later research conducted by Lemmink et al (2003) further confirm the same results that corporate image was one of the initiator of the
applicant’s intention to apply for a company. The current researchers also agree with all the research results since based
on the researcher’s observation, there is likeliness for
applicants to look for all the information about the company before applying the job to a certain company.
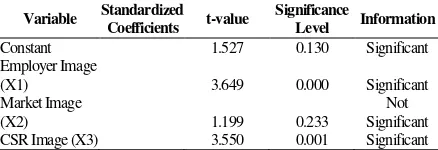
Table 6. Regression Coefficient Table
Variable Standardized Coefficients t-value
Significance
Level Information
Constant 1.527 0.130 Significant
Employer Image
As the decision rule, if the significance-t is lower than the significance level (0.05), thus the null hypothesis will be rejected and the alternative hypothesis will be accepted. Meanwhile, if the t-value (t-test statistic) is greater or lower than +/- 1.98 which is the value of the t-table (using significance level = 0.05 and df = 108) then similarly, the null hypothesis will be rejected. When the null hypothesis is rejected, then the researcher can confirm that the certain independent variable (Employer, Product and/or CSR image) has significant impact towards Job Applicant Attraction as the dependent variable.
The result from table 6 shows that employer image has significant influence towards Job Applicant Attraction. In addition, it also give further information regarding the coefficient of the employer image as the independent variable under the column standardized coefficient Beta. Based on the value stated, every 1 unit increase in the standard deviation of the employer image will resulted to
additional 0.321 increase of the Job Applicant Attraction’s
standard deviation, net to the other effect of changes resulted by the other independent variable.
The result, which indicates that employer image significant influence in attracting job applicants to apply to a company, is also strengthened by the theory from Williams and Bauer (1994); Albinger and Freeman (2000) and Carless (2003), which states that the impression of the prospective employer (employer image) is believed as one of the key success factor in attracting the job applicants (in Gomez & Neves, 2011, p. 4). Moreover, employer image is also found to have significant positive influence towards job applicant attraction based on the previous research result in analyzing
organization attractiveness towards applicants’ intention to
apply (Gomez & Neves, 2011). This hypothesis also has confirmed the theory from Highhouse et al, (2009), which is used as the base theory for this research. Furthermore, the result is in accordance with Lemmink et al. (2003) research which states that company employment image has significant influence toward job applicant attraction. As one of the biggest manufacturers in Indonesia, PT XYZ always try to maximize the well beings of their employee. As the result, PT XYZ has been chosen as best public company and most admired company in 2013. These awards will improve their image as prospective employer which as stated by Williams and Bauer (1994); Albinger and Freeman (2000) and Carless (2003) can attract more job applicants. (in Gomez & Neves, 2011, p. 4)
Meanwhile, the second independent variable, market image, the significance-t value is higher than the significance level 0.05, and also the t- value lies between +/- 1.98. As the consequence, the null hypothesis is fail to be rejected which means there is insignificant influence of the market image towards the Job Applicant Attraction.
Even though it is not in accordance with the result from previous researches such as Tsai and Yang (2010), which indicates that market image has significant influence on applicant attraction, the result of this current research is
actually quite reasonable. Based on the researcher’s
evaluation and observation, there are several things which could be the possible causes why market image of PT XYZ
don’t have any significant influence towards job applicant
attraction. The first possible reason is that the applicants will look for different aspects of information based on the industry that they will enter. As the example, in the mining industry the applicants might look for information about
company’s security issue more than the company’s product
quality. Lemmink et al. (2003) asserts that each organization will be perceived by job applicants through different aspects. It means, in the previous researches, the job applicants consider market image as the aspect that will influence their attraction toward that certain company or the industry. For PT XYZ, however, job applicants does not consider the market image to make them attracted toward the company.
The second possible cause might lies in the type of the product produced by PT XYZ itself. The type of product produced by PT XYZ is for a specific target market as only 35% of Indonesian people, who mostly are men, consume that type of product (Ghosh, 2012). Meanwhile the rest of the population have little or even no interaction with the product. Apart from the packaging and marketing activities, the product itself cannot easily be differentiated from the products produced by competitors if it is not consumed. As indicated by Tsai and Yang (2010), the market image of the company will only attract applicants if the product is perceived as highly innovative and have high quality. If the product is perceived as innovative and have good quality, it will give signs to the applicants that the company looks for individuals who have high quality. It also implies to the applicants that the company offer opportunity for them to develop themselves and be more innovative as individual.
The innovation for PT XYZ’s product is mostly shown
18 consumable products, the innovativeness, quality and value of money of product produced by PT XYZ cannot easily be distinguished by people if they do not regularly consume the
product or even they haven’t taste the products before. Since
only 35% of Indonesian people consumes it, there is possibility that the respondents are majorly included in the 65% of Indonesia people who never consumes PT XYZ products. If most of the respondents of this current research have never consumed the products, they will not have any clear conception about the innovation, quality and value of the product. As the consequence, they cannot conclude whether the company itself is innovative and look for high quality individuals or not. Because of the obscure opinion that they have toward the market image, it probably does not affect their attraction toward PT XYZ.
The third possible cause is that in looking for the company to work for, applicants will majorly consider about the characteristics of the job and of the company as employer first aside from other factors. According to Rynes (1989), Turban et al. (1998) and Chapman, Uggerslev, Carroll, Piasentin and Jones (2005), the most influential factor in attracting job applicant is the type of work and the company
characteristics (i.e., employer’s image) itself. It means the
market image will be the later things to be considered by the applicants. The market image (i.e., product) of a company
might not significantly influence the applicant’s decision in
applying to a company since the product of a company does not directly related with the job and the environment that they will face. Therefore, market image does not have any significant impact in attracting job applicant to apply to and join with PT XYZ.
Lastly regarding the last independent variable, CSR Image, the t value is lower than the significance-level ( ) 0.05, additionally the t-value is greater than 1.98. This means the null hypothesis is rejected, and the alternative hypothesis is accepted. Hence, the CSR image has significant influence towards the Job Applicant Attraction. In addition, the standardized coefficient of AvgCSR alsgo gives
information that every 1 unit increase on the CSR Image’s
standard deviation will resulted to additional 0.314 increase
in the Job Applicant Attraction’s standard deviation, net to
the other effect of changes resulted by the other independent variable.
This result is in line with the previous researches. As stated by Capriotti & Moreno (2007), CSR image has been perceived as the effective tool for a company to influence how applicants perceive about a company (in Sjostrand, 2009, p. 4). Further, Sjostrand (2009) himself along with Turban and Greening (1997) aver that CSR could increase
the company’s attractiveness to be the place to work for. The
reason why CSR could increase the attractiveness as stated by Albinger & Freeman (2000) is that companies that concern the environmental issue around them are perceived to have high moral standards (values and norms) in their company (in Sjostrand, 2009, p. 4). Therefore, the company will be believed to have a good working condition inside them thus will treat their employees well, will attract the applicants to join the company. In his research paper, Sjostrand (2009) also found that CSP (Corporate Social
Performance) of a company can affect the how company control the human resource management (recruitment, motivation and retention). The result of the current research also conform the research by Tsai and Yang (2010) which also indicates that citizenship image has significant influence on applicant attraction.
PT XYZ has done various CSR activities frequently which improves the social condition around the company’s
location, such as improving the earning rate of Indonesian’s
farmer under System of Rice Intensification Program and supporting the development of small and medium enterprises in Indonesia through organizing an exhibition to promote the
SME’s products in the market. As the result, PT XYZ is
perceived as a company with high moral standards, proven to attract job applicants to apply for a job in PT XYZ. (Wirausahanews.com, 2014).
In order to analyze on how much the independent variable can explain the dependent variable, adjusted R square test need to be done. The result for the adjusted R square, as shown in table 7 below, indicates that 30.3% of the variation in the corporate image of PT XYZ can explain the variation in the job applicants attraction.
Table 7. Adjusted R Squarre Test
R R Square Adjusted R Square Std. Error of the Estimate
0.568 0.322 0.303 0.66497
As shown by the result of adjusted R square, 30.3% of the variation in the corporate image can explain the job applicant reaction. It means there are 69.7% of other variables outside the regression model that have influence towards job applicant attraction toward PT XYZ. Edwards and Quinter (2011) suggest that in choosing a job, applicants might be influenced by many aspects such as personal interest of the applicant, learning experience they receive in university, and influence from family or relatives. Additionally Turban et al. (1998), suggested that location of the company also influence job applicant.
CONCLUSION
In conclusion, based on the F-test conducted, it was known that corporate image has significant impact towards the job applicant attraction. This result validate the first hypothesis. Furthermore, since the t-test result shows significant value for employer image and CSR image, therefore employer image and CSR image were found to have significant impact towards job applicant attraction, which confirms the second and fourth hypothesis at the same time. On the other hand, the t-test shows that there is insignificant value between market image and job applicant attraction, thus in validation the third hypothesis, the result will be market image has no significant impact towards job applicant attraction.
19 sampling is not random enough and not all of the population element has the same chance to be selected. Therefore, the researchers suggest the future researchers to find the appropriate time and cost to obtain the population list. So that the future research result may have more random response and all the population element have the same chance to be selected. Thus the future research result may better explain the phenomena in the reality.
The second limitation is regarding the limited sample size. In terms of sample size, the writers have fulfilled the minimum requirement specified by Green (1991) which resulting in the minimum 72 respondents for this current research. In spite of that, there are other requirements such as Slovin formula that cannot be followed by the writers due to the unavailability of the population list. Further, due to the limitation of cost and time, the writers can only obtain 109 respondents. Although this research has successfully fulfilled the minimum requirement originated by Green (1991), the researchers suggest the future research to have more respondents involved by comparing the the minimum number respondent requirement rules from several authors and adjust with the capability of the future researchers themselves to obtain more number of respondents. The bigger sample size used in the research is believed to gain more accurate result which may describe the phenomena that happen in the society.
The third limitation is related to the limited independent variable. This current research solely uses corporate image as the independent variable to explain job applicant attraction. Nevertheless, the result of the current research implies that there are 69.7% of other variables that have influence toward job applicant. Even though it has big impact toward job applicant attraction, these 69.7% of other variables have not been covered and examined in this current research. Therefore, the researchers encourage the future researchers to improve the theory by collaborating more theories related with corporate image to find the unknown factors from which may describe the rest 69.7% of the original population.
Lastly, the limitation is coming from limited area coverage to obtain samples. The samples taken for this research are already able to represent Surabaya. However, there are still many other places where the samples can be taken such as campus fair, job fair, and offices across Surabaya. As the researchers has try to distribute the questionnaires in malls and universities throughout Surabaya, the researchers believe that there will be more better places to distribute the questionnaires such as job fair, campus fair or other career exhibition which will be the place for the job applicants from all around Surabaya to gather and look for jobs. Those places are believed to be the best place to distribute the questionnaires since most of the attendants are match with the respondent requirements used in the research.
REFERENCES
Auger, P., Devinney, T.M., Dowling, G.R., Eckert, C. & Lin,
N. (2013, March 19). How much does a company’s
reputation matter in recruiting?. MIT Sloan Management Review. Retrieved February 20, 2014,
from
http://sloanreview.mit.edu/article/how-much-Bersin, J. (2013, December 19). The year of the employee: Predictions for talent, leadership, and HR technology in 2014. Forbes. Retrieved February 20, 2014, from http://www.forbes.com
Boston Consulting Group. (2013). Talent shortages, already bad, will grow worse in Indonesia. Retrieved
February 21, 2014, from
http://www.bcg.com/media/PressReleaseDetails.asp x?id=tcm:12-134979
Carpenter, J. E. (2013). The role of corporate image perceptions in selection: Testing an impression formation model (Doctoral Dissertation). Retrieved
February 2, 2014, from
https://etd.ohiolink.edu/ap:10:0::NO:10:P10_ETD_ SUBID:87204
Connerly, M.L., Carlson, K. D. & Mecham III, R. L. (2003). Evidence of differences in applicant pool quality. Personnel Review, 32(1), 22-39.
Cooper, D. R. & Schindler, P. S. (2011). Business research methods. 11th ed. New York: Mcgraw-Hill. Fisher, C. D., Ilgen, D. R., & Hoyer, W. D. (1979). Source
Credibility, Information Favorability, and Job Offer Acceptance1. Academy of Management Journal, 22(1), 94-103.
Fombrun, C. J., Gardberg, N. A., & Sever, J. M. (2000). The reputation quotient: A multi-stakeholder measure of corporate reputation. Journal of Brand Management, 7(4), 241-255.
Ghosh, P. R. (September 12, 2012). Indonesia – smoking itself to death. Retrieved May 6, 2014, from http://www.ibtimes.com
Ghozali, I. (2011). Aplikasi analisis multivariate dengan program IBM SPSS 19. Semarang: Badan Penerbit Universitas Diponegoro.
Gomes, D., & Neves, J. (2011). Organizational attractiveness and prospective applicants' intentions to apply. Personnel Review, 40(6), 684-699.
Highhouse, S., Brooks, M. E., & Gregarus, G. (2009). An organizational impression management perspective on the formation of corporate reputations. Journal of Management, 35(6), 1481-1493.
Highhouse, S., Lievens, F., & Sinar, E. F. (2003). Measuring attraction to organizations. Educational and Psychological Measurement, 63(6), 986-1001. Kim, K. H., Jeon, B. J., Jung, H. S., Lu, W. & Jones, J.
(2012). Effective employment brand equity through sustainable competitive advantage, marketing strategy, and corporate image. Journal Of Business Research, 65 (11), 1612-1617.
Kumar, R. (2011). Research methodology. Los Angeles: SAGE.
20 explaining application intentions. Journal of Economic Psychology, 24(1), 1-15.
Malhotra, N. K. (2010). Marketing research: An applied orientation. 6th ed. New Jersey: Pearson Education, Inc.
Pérez, A., & del Bosque, I. R. (2013). Measuring CSR Image: Three Studies to Develop and to Validate a Reliable Measurement Tool. Journal of business ethics, 118(2), 265-286.
Prasojo, H. (2014, February 12). Kadin Surabaya imbau Karwo perhatikan tingkat SDM di Jatim. Whatindonews. Retrieved February 27, 2014, from http://whatindonews.com/
Schawbel, D. (2013, December 18). Companies are now competing for talent against entrepreneurial talent. Forbes. Retrieved February 21, 2014, from http://www.forbes.com/
Sjostrand, N. (2009). Do Companies Attract Quality Work Force Through CSR - Experience of Two Swedish MNCs. Retrieved February 8, 2014, from http://epubl.ltu.se/1402-1552/2010/052/LTU-DUPP-10052-SE.pdf
Cooper, D. R. & Schindler, P. S. (2011). Business research methods. 11th ed. New York: Mcgraw-Hill. Tsai, W. C., & Yang, I. W. F. (2010). Does image matter to
different job applicants? The influences of corporate image and applicant individual differences on organizational attractiveness. International Journal of Selection and Assessment, 18(1), 48-63.
Turban, D. B., Forret, M. L., & Hendrickson, C. L. (1998). Applicant attraction to firms: Influences of organization reputation, job and organizational attributes, and recruiter behaviors. Journal of Vocational Behavior, 52(1), 24-44.