T H E J O U R N A L O F H U M A N R E S O U R C E S • 45 • 1
Two Sides of the Same Coin
U.S. “Residual” Inequality and the Gender
Gap
Marigee P. Bacolod
Bernardo S. Blum
A B S T R A C T
We show that the narrowing gender gap and the growth in earnings in-equality are consistent with a simple model in which skills are heteroge-neous, and the growth in skill prices has been particularly strong for skills with which women are well endowed. Empirical analysis of DOT, CPS, and NLSY79 data finds evidence to support this model. A large increase in the prices of cognitive and people skills—skills with which women are well endowed—and a decline in the price of motor skills account for up to 40 percent of the rising inequality and 20 percent of the narrowing gender gap.
I. Introduction
Two major developments have characterized the U.S. labor market since 1970: the dramatic rise in income and wage inequality and the narrowing of the male-female wage gap. Two important literatures have sprung up to investigate the degree to which the rise in income and wage inequality and the narrowing of the wage gap can be attributed to changes in the returns to skills.1They find that
1. See Altonji and Blank (1999) for a survey of the gender gap literature and Katz and Autor (1999) for a survey of the inequality literature.
Marigee Bacolod is an assistant professor of economics at the University of California—Irvine and Ber-nardo Blum is an assistant professor of business economics at the Rotman School of Management, Uni-versity of Toronto. The authors would like to thank Ho Jin Lee for research assistance. This paper has benefited from insightful comments from Sandy Black, Paul Devereux, Ig Horstmann, Joe Hotz, Jun Ishii, Ken Sokoloff, Will Strange, Dan Trefler, and an anonymous referee. The authors also thank con-ference and seminar participants at the 2006 American Economic Association Annual Meetings, Clare-mont McKenna College, CSU-Fullerton, UC Davis, UC Irvine, UC Merced Conference on Rising Earn-ings Inequality, University of Toronto, and the 2005 Southern California Applied Economics
Conference. The data used in this article can be obtained beginning August 2010 through July 2013 from Marigee Bacolod, Department of Economics, University of California—Irvine, 3151 Social Science Plaza, Irvine, CA 92697-5100,具mbacolod@uci.edu典.
[Submitted April 2008, accepted December 2008]
198 The Journal of Human Resources
higher returns to skills can help explain the rise in wage inequality but should have
widened the gender wage gap (for example, Blau and Kahn 1997). We show that both phenomena are consistent with a simple model in which skills are heteroge-neous and the growth in skill prices has been particularly strong for skills with which women tend to be endowed. Empirical analysis of the Dictionary of Occupational Titles (DOT), the Current Population Survey (CPS), and the National Longitudinal Survey of Youth 1979 (NLSY79) data over the period 1968–90 finds evidence to support a model in which skills are heterogeneous within education, experience, and other standard explanatory variables.
Our analysis moves beyond the usual measures of workers’ skills such as edu-cation and experience by making use of DOT, CPS, and NLSY79 to characterize several types of worker skills. DOT measures a large number of skills that are required to perform over 12,000 occupations in the U.S labor market. Assuming that workers are assigned to jobs in some sort of hedonic market clearing process, we can infer workers’ skills from the occupation in which they are employed. We use this hedonic imputation to characterize the workers’ cognitive, motor, and people skills as well as physical strength. We then match the DOT data with both the CPS and NLSY79 data to identify workers’ wages and other individual characteristics.
We find that the wage returns to cognitive and people skills more than doubled during the 1968–90 period, with the distinction that people skills became more valuable by being complementary to other skills. In the same period, the wage return to motor skills declined by 60 percent and the return to physical strength did not change in a statistically significant way. We also find that within educational groups the top of the wage distribution was in cognitive- and people-intensive occupations while the bottom was in motor-intensive occupations. Therefore, the estimated changes in skill prices can help explain the increase in residual inequality observed in the United States. Such estimated changes in skill prices can also help explain the narrowing of the gender wage gap, since we find that by 1980 females were in more cognitive- and people-intensive occupations relative to males. To be more concrete, changes in wage returns to cognitive, motor, and people skills as well as physical strength accounted for 20–40 percent of the observed changes in residual inequality for different education groups and for around 20 percent of the narrowing in the gender gap.
Our findings add to different literatures, such as the aforementioned that aim to identify the sources of rising inequality and the narrowing of the gender gap in the United States in the 1970s and 1980s. These wage inequality and wage gap litera-tures find a widespread increase in the demand and price of skills in the 1980s, which led to changes in the wage structure that raised inequality (for example, Bound and Johnson 1992; Katz and Murphy 1992; Juhn, Murphy, and Pierce 1993; and others) and widened the gender pay gap (for example, Blau and Kahn 1997). In contrast, our analysis shows that some skills became more valuable while others became less valuable in the 1970s and 1980s and that these skill price changes can help explain both the rising inequality and the narrowing of the gender gap.
Bacolod and Blum 199
tasks. For instance, Autor, Levy, and Murnane (2003) use the DOT variablefingdex
(finger dexterity) as a measure of routine manual tasks and the DOT variable eye-hand (eye-hand-foot coordination) as a measure of nonroutine manual tasks. We instead argue that thefingdexandeyehandvariables (along with seven others) cap-ture different aspects of the motor/manual skills required to perform an occupation and thus categorize them under the broad umbrella ofmotor skills required to per-form an occupation. We do the same to capture the different aspects of cognitive and people skills. Interestingly, we find that the wage returns of the seven variables that we believe capture different aspects of cognition significantly increased over the period covered in our sample. The wage returns of all the nine DOT measures that capture aspects of motor/manual abilities either did not change in value or became less valuable during the same period. Finally, the wage returns on the four variables that we believe capture aspects of workers’ people skills also increased during the period, although some of them in a statistically nonsignificant way.
One recent paper in the task-based literature that particularly relates to ours is Black and Spitz-Oener (2007). It builds on our analysis by using the Qualification and Career Survey, a German data set where workers self-report tasks they perform in their jobs. The authors use these self-reported measures to study if changes in the tasks performed by males and females and their associated prices explain the closing of the gender pay gap in Germany. Some of their findings are similar to ours while others are different. They find that changes in the tasks performed within occupations explain a large part of the narrowing of the gender gap in Germany. We also find that changes in observed job and individual characteristics explain a large part of the narrowing of the gender gap in the United States (for example, Blau and Kahn 1997). However, they find that changes in task prices contributed to widening the gender gap in Germany while we find that such task-price changes contributed to narrowing the gender gap in the United States. A number of reasons may account for the different results. First, the U.S. and German labor markets may have been affected by different economic forces. Indeed, this seems to be the case since most of the narrowing of the gender gap happened in the United States in the 1980s (Blau and Kahn 1997, 2006) and in Germany in the 1990s (Black and Spitz-Oener 2007). Second, the skill measures that Black and Spitz-Oener use are significantly different than ours, with their measures focusing on the routine versus nonroutine aspects of jobs. Finally, the occupation classification in their data set is more aggregated than ours, containing only around 80 occupations. If the employment composition of males and females was changing differently within their broadly defined occupations, task-price estimates and their effects on the gender pay gap might suffer from ag-gregation bias. Of course, only a more detailed analysis of the two data sets can identify the sources of the different findings.
Our results also relate to the findings of Borghans, ter Weel, and Weinberg (2006). Using DOT and similar data sets from the U.K. and Germany, they show that the rising importance of soft skills and their associated prices help explain the wage outcomes of women. We complement their findings by showing that people skills did not become more valuable by themselves but that they made cognitive and motor skills more valuable and that such price changes also affected inequality.
200 The Journal of Human Resources
then the gender gap will narrow. Also, if brains are less well distributed among workers than brawn, then the rising price of brains can also increase wage inequality. We provide empirical confirmation that the prices of cognitive (brains) and people skills increased relative to the price of motor skills during the period 1968–90 and that such price changes narrowed the gender gap. However, we show that the ob-served changes in skill prices affected inequality not because some skills were not as well distributed as others but rather because within education and experience groups the top and bottom of the wage distribution were intensive in different skills. The remainder of the paper is organized as follows. The next section presents the analytical framework, while Section III describes the data sets used. Section IV puts forth the empirical strategy and the main estimation issues, presents the estimated wage returns to skills, and discusses a number of robustness checks. Section V quantifies how much of the observed rise in residual inequality was due to the estimated changes in skill prices, and Section VI measures how much of the observed narrowing of the male-female wage gap was due to skill price changes. The final section concludes.
II. Analytical Framework
Suppose we have for each individualiat timetthe following wage equation:
⬘ ⬘
lnw ⳱Z ␥ⳭX Ⳮε
(1) it it t it t it
wherewitis wage earnings,Xitis a vector of standard explanatory variables such as gender, race, education, and experience, and t is a vector of prices of these ex-planatory variables. Zit is a vector with the worker’s cognitive, people, and motor skills as well as physical strength, while␥tis a vector of prices of these skills.
We use DOT data to characterize workers’ physical strength and cognitive, motor, and people skills, and CPS and NLSY79 data to obtain workers’ wages and other individual characteristics. We then use Equation 1 to estimate the price vectorst and␥t. In our preferred specification, we pool together all workers in our sample and thus assume that labor markets are not segmented. As we discuss in detail in Section VI, our preferred specification is different than the preferred specification in Blau and Kahn (1997).
Once we have estimates for t and␥t, we implement the full distributional ac-counting framework as proposed in Juhn, Murphy, and Pierce (1993). Thus, we rewrite Equation 1 as:
logw ⳱
{
X ⳭZ ␥}
Ⳮ{
X(
ⳮ)}
Ⳮ{
Z(
␥ⳮ␥)}
(2) it it it it t it t
ⳮ1 ⳮ1 ⳮ1
Ⳮ
{
F(
X,Z)
Ⳮ(
F(
X,Z)
ⳮF(
X,Z))}
it it it
Bacolod and Blum 201
the second brackets captures the effects of the estimated changes in t(the prices of the standard explanatory variables in Xit). The term inside the third brackets captures the effects on the wage distribution of the estimated changes in ␥t(the prices of physical strength as well as cognitive, motor, and people skills). Finally, the terms inside the last brackets capture the effect of changes in the distribution of wage residuals. Note that since our analysis focuses on the effects of changes in the prices of physical strength as well as cognitive, motor, and people skills, we do not separate the effects of changes in unobserved characteristics and their prices.2
We apply the decomposition above to simulate the effects of changes in observed characteristics, their prices, and unobserved components on two statistics of the wage distribution, the ratio of the 90th to 10th percentile, and the relative average wage paid to males and females. Previous economic analysis suggests that the narrowing gender gap is particularly surprising given the growth in overall earnings inequality. Changes in the wage structure due to skill prices contributed to rising inequality and widening of the gender gap (for example, Juhn, Murphy, and Pierce 1993; Blau and Kahn 1997). We show that both phenomena are consistent with the simple model above in which skills are heterogeneous within education, experience, and other standard explanatory variables if the growth in skill prices was particularly strong for skills with which women tend to be endowed. The analyses in the next sections provide empirical support for this model.
III. Data
The data we use in this paper brings together information from the Fourth Edition of DOT, the CPS, and the NLSY79. DOT is a database that char-acterizes the multiple skill requirements of occupations. Matching DOT with CPS and NLSY79 allows us to characterize the skills of workers.
Our approach to identifying individual worker skills follows that of Autor, Levy, and Murnane (2003) and others by supposing that in a labor market equilibrium workers are matched to jobs that require skills they have. To be concrete, a worker currently employed as an engineer knows calculus (indicated in DOT as General Educational Development in Math⳱6) while one employed as a janitor lacks the
skill of direction, planning, and control (indicated in DOT asdcp⳱no). The hedonic
imputation of worker skills from occupations is imperfect, and we thus run a number of robustness checks to investigate in detail the effects such imputation might have on the paper’s main results. We should note, however, that it is not at all clear that alternative ways of measuring skills would do a better job. Would a survey of workers’ self-reported skills produce a better measure of, for instance, a worker’s ability to direct, control, and plan than the judgment of an employer? We turn now to a description of the data and their construction process.
202 The Journal of Human Resources
A. Dictionary of Occupational Titles (DOT)
DOT was first developed in response to the demand of an expanding public em-ployment service for standardized occupational information to support job placement activities. The U.S. Employment Service recognized a need for such information in the mid-1930s, soon after the passage of the Wagner-Peyser Act, which established a federal-state employment service system.
The Fourth Edition of DOT, released in 1977, provides measures of 44 different skills required to perform more than 12,000 detailed occupations in the U.S. labor market. The DOT measures are the result of comprehensive studies by trained oc-cupational analysts of how jobs are performed in establishments across the United States and are composites of data collected from diverse sources. Primarily, U.S. Department of Labor occupational analysts “go out and collect reliable data which is provided to job interviewers so they may systematically compare and match the specifications of employer job openings with the qualifications of applicants who are seeking jobs through its facilities” (U.S. Department of Labor Office of Admin-istrative Law Judges Law Library). For the Fourth Edition of DOT, the U.S. De-partment of Labor conducted approximately 75,000 on-site job analysis studies and supplemented them with information obtained through extensive contacts with pro-fessional and trade associations. The Revised Fourth Edition was released in 1991 and includes data collected throughout the 1980s, which was used to revise the skill requirements of occupations. It also includes new occupations. As a result, infor-mation on 1,692 of 12,742 occupations was changed (including some occupations that disappeared from the U.S. labor market), and 761 new occupations were added. These new DOT titles were mostly computer-related jobs. While the main use of DOT information has been for job matching, employment counseling, occupational and career guidance, and labor market information services, several economists have also used it, including Autor, Levy, and Murnane (2003), Wolff (2003), and Ingram and Neumann (2006).
Researchers have noted two main limitations of DOT.3 First, the definitions of
the skill requirements are not consistent across DOT editions, making it harder to combine information from different editions and to perform analyses over longer periods of time. We avoid this difficulty by using only the Fourth Edition of the dictionary and its revision. Second, the DOT requirements are likely to be measured with error and thus should be taken only as a proxy for the actual skill requirements of occupations rather than as exact measures. Section IV pays detailed attention to the possible consequences of measurement errors in the data to the findings of the paper, and we find that the skill price estimates are highly robust to the presence of data mismeasurements.
Finally, one might worry that gender stereotypes regarding the complexity of jobs traditionally held by men versus women could introduce gender bias in the DOT’s ratings of occupations. Indeed, Witt and Nahemy (1975) argue for the existence of a gender bias in the ratings of the Third Edition of DOT, published in 1966. How-ever, Miller et al. (1980) examine gender bias in the ratings of occupations in the
Bacolod and Blum 203
Fourth Edition of DOT, the one we use in the paper, and find no evidence of gender bias.
1. Selecting DOT Task Measures: Constructing Skill Measures
The 44 different measures of skills available in the Fourth Edition of DOT fall into seven clusters: work functions; required General Educational Development (GED); aptitudes needed; temperaments needed; interests; physical demands; and working conditions in the environment. We rescale these seven variables so that higher values denote higher requirements and describe them in Table A-1 of the online Appendix.4
It is not possible, of course, to use all the DOT variables simultaneously since multicollinearity makes precise estimation impossible. Instead, we use the textual definitions of the variables to identify four broad skill categories: cognitive skills, fine motor skills, people skills, and physical strength.5
We use seven DOT measures to capture the different aspects of cognitive skills. These measures capture the complexity of the job in relation to: data; GED in reasoning, mathematics, and language for the job; and aptitudes for intelligence, verbal, and numeric (see Table A-1 in the online Appendix). For instance, gedm
measures the mathematical development required for the job. At highgedmlevels, workers are required to know advanced calculus (for example, engineers and math professors), while at low levels they are required only to know how to perform arithmetic (for example, janitors and stevedores). The variable data measures the complexity of the job in relation to data. At high data levels, workers should be able to synthesize and analyze data (for example, editors and economists), while at low levels they are required only to be able to compare and copy data (for example, office messengers and clerks). Clearly, being able to solve sophisticated mathemat-ical problems and analyze data are two different aspects of cognition. To capture the multiple aspects of cognition in a parsimonious way, we construct a cognitive index through factor analysis. Panels A and B of Table A-4 in the online Appendix report results for our principal components analysis to generate a cognitive index (with mean 1 and standard deviation 0.1) using the 1977 DOT and the 1991 DOT. The first factor explains 99.3 percent (1977 DOT) and 100 percent (1991 DOT) of the variation in the seven cognitive variables, with each DOT variable having load-ings ranging from 0.83 to 0.95. A higher value on this cognitive index indicates that substantive complexity is involved in carrying out the job.
The first panel in Table 1 reports the top and bottom ten occupations according to the cognitive index. By and large, occupations at the bottom of the cognitive index distribution are dominated by operatives, nonprivate household service work-ers, and laborers. Laborers include stevedores and lumbermen, operatives include oilers, greasers, drivers, and welders, and nonhousehold service workers include waiters and beauticians. Meanwhile, the top of the cognitive index is primarily
com-4. The online Appendix is available at www. rotman.utoronto.ca/bblum/personal/front.htm.
204
The
Journal
of
Human
Resources
Table 1
Top and Bottom 10 Occupations in the Skill Distribution, DOT
Cognitive Skills Motor Skills
Bottom 10 Top 10 Bottom 10 Top 10
Laundry and dry cleaning op-eratives
Geologists and geophysicists Bill and account collectors Physicians and surgeons
Charwomen and cleaners Physicists Lawyers and judges Veterinarians
Oilers and greasers Chemists Clergymen Chiropractors
Telegraph messengers Mathematicians Credit men Artists and art teachers Longshoremen and stevedores College professors, natural
science
Social and welfare workers Machinists
Fruit, nut, and vegetable grad-ers and packgrad-ers
Physicians and surgeons Boarding and lodging house keepers
Draftsmen
Laborers Engineers Religious workers Technicians
Teamsters Architects Authors Dentists
Fishermen and oystermen Biological scientists Guards Toolmakers and setters
Bacolod
and
Blum
205
Strength People Skills
Bottom 10 Top 10 Bottom 10 Top 10
Natural scientists Plumbers and pipe fitters Toolmakers and setters Clergymen
Personnel workers Millwrights Meat cutters College professors
(psychol-ogy)
Music teachers Farm laborers Teamsters College professors (subject
not specified) College professors, social
sci-ences
Plasterers Bricklayers and masons Religious workers
Bill and account collectors Sailors and deck hands Pattern and model makers Lawyers and judges Accountants and auditors Railroad and car mechanics
and repairmen
Railroad and car mechanics and repairmen
College professors (biological sciences)
Geologists and geophysicists Mine operatives and laborers Roofers and slaters College professors (other so-cial sciences)
Chiropractors Farmers Millers College professors
(econom-ics)
Marshals and constables Charwomen and cleaners Cabinetmakers Social and welfare workers
Entertainers Structural metal workers Engravers K-12 Teachers
206 The Journal of Human Resources
prised of professional workers, including college professors, scientists, managers, officials, and proprietors.
Nine DOT variables capture the different dimensions of the fine motor skill re-quirements of an occupation: complexity of the job in relation to things; aptitudes for manual dexterity, finger dexterity, motor coordination, eye-hand-foot coordina-tion, spatial and form percepcoordina-tion, and color discrimination; and adaptability to sit-uations requiring attainment of standards. For instance, high complexity in relation tothingsindicates that workers are required to set up and adjust machinery and to work it precisely (for example, electricians and machinists). Lower values are as-signed to jobs where workers have little or no involvement in selecting appropriate tools or in attainment of standards (for example, accountants and clerks). The other variables measure more specific aptitudes, like finger dexterity and spatial and form perception. As with cognitive skills, we use factor analysis to construct a motor index (with mean 1 and standard deviation 0.1) to capture these different aspects in a parsimonious way. Panels C and D of Table A-4 in the online Appendix show that the first factor explains 84.5 percent (1977 DOT) and 95.4 percent (1991 DOT) of the variation on the nine motor variables. A higher value on the motor skills index indicates a job with greater manual/motor demands.
The second panel in Table 1 reports the top and bottom ten occupations according to the motor index. Occupations at the top of the motor skill index distribution are dominated by craftspeople, draftspeople, technicians (for example, medical and den-tal), and machinists, all occupations where individuals need high levels of motor coordination and finger dexterity. At the bottom of the motor distribution are law-yers, social workers, and clergy.
We use four DOT variables to capture different aspects of the people skills re-quired by occupations (see Table A-1 of the online Appendix). We discuss these variables in greater detail since they might be more controversial than the cognitive and motor measures discussed in the previous paragraphs. The variabledcpassesses if an occupation requires direction, control, and planning of an activity. Clearly,dcp
captures one element of people skills - the ability to manage. Similarly, the variable
influ measures whether an occupation requires exerting influence. It therefore cap-tures a different type of interpersonal skill that also somewhat relates to the ability to manage, although in this instance the “management” takes place outside of an authority relationship. To make things more concrete, it is useful to consider some specific occupations. Positions of authority such as financial managers and super-visors are required to engage in direction, control, and planning of activities (dcp⳱yes). However, financial managers and supervisors are not required to exert
influence over others (influ⳱no). In contrast, teachers and lawyers are required to
have influence over others (influ⳱yes), presumably over schoolchildren in the case
of teachers and a jury or judge in the case of lawyers. However, while teachers are also required to direct, control, and plan activities (dcp⳱yes), lawyers are not
(dcp⳱no).
phy-Bacolod and Blum 207
sicians and salespersons (depl⳱yes), while mathematicians, insurance underwriters,
and machine operators do not require this skill (depl⳱no).
The last DOT measure of people skills we use is the peoplevariable. Different from the previous three variables, the people variable attempts to rank the degree of interpersonal interaction required by an occupation (see Table A-1 of the online Appendix). The ranking starts with mentorship being assigned more interpersonal skills than negotiation and then continues moving down to receiving instructions. The scale and structure of the ranking is intended to reflect a progression from simple to complex relations with people, such that each successive rank includes those relations that are simpler and excludes those that are more complex (Miller et al. 1980). While we do not see the ranking as being beyond dispute—does mentorship really require more people skills than negotiation?—we do view the arrangement of the people functions as being hierarchical in a more general sense. For instance, it seems hard to dispute that “instructing” people (people⳱7) involves a broader set
of interactive skills than “taking instructions” (people⳱1).
We combine the information contained in the four measures of people skills de-scribed above using factor analysis to construct an index of the people skills required by each DOT occupation. Panels E and F of Table A-4 in the online Appendix show that the first factor explains 100 percent (1977 DOT and 1991 DOT) of the variation in the four variables of social interaction. This index is our preferred measure of people skills as it captures multiple aspects of social interactions.6
The bottom panel in Table 1 shows the top and bottom occupations in terms of people skills. By and large, occupations at the bottom of the people skills index are dominated by operatives and laborers, jobs in which social interaction is clearly minimal. Meanwhile, the top of the people skills index include teachers from kin-dergarten up to college level, religious and social workers, and lawyers.
The final skill measure we consider is the physical strength required to perform an occupation. Different from the previous three sets of skills, physical strength is well defined and one DOT variable (streng) measures it as “the degree of strength requirements of jobs as measured by involvement in standing, walking, sitting, lift-ing, and carrying.” The streng variable classifies jobs as sedentary, light, medium, heavy, and very heavy, and is what we use to measure whether an occupation requires physical strength. One difficulty with this variable is that it might have a nonmonotonic relationship with wages. Should occupations that are light in terms of their strength requirements command higher wages than ones classified as entary? Indeed, we find that on average workers are paid a premium to be in sed-entary occupations as well as in occupations that are heavy and very heavy. We deal with this issue by transforming thestrengvariable into a dummy variable that equals one if the occupation is considered heavy or very heavy and zero otherwise. Thus, we distinguish occupations that require above average physical strength from the others.
208 The Journal of Human Resources
The final panel in Table 1 shows occupations that require and do not require physical strength. Plumbers, farm laborers, and sailors are clearly occupations in which heavy to very heavy physical demands are required. On the other hand, sci-entists, personnel workers, and music teachers are occupations without heavy physi-cal demands.
B. Current Population Survey
Our wage and employment data come from the March CPS 1968–90 (CPS Utilities 2001). Although CPS is available prior to 1968 and after 1990, the census occupation and industry codes for years before 1968 are too coarse for our purposes and the last DOT was published in 1991. Our sample includes employed individuals aged 18–64 who were not living in group quarters, were not in school, were not working without pay, had a positive number of years of potential labor market experience, had nonmissing occupational responses, and had earned at least three full-time months of minimum wage or above during that year. We also impute earnings for workers top-coded by the census as 1.5 times the top-code value. All wages are deflated by the CPI for All Urban Consumers, with base year 1982–84. The results of the paper are not qualitatively sensitive to the imputation outlined and to the wage measure used (weekly versus annual). We report results using weekly earnings.
We match DOT job skills from the 1977 Fourth Edition to workers in the March CPS surveys from 1968 to 1977. For workers in the March CPS 1978–91, their DOT job skills come from the 1991 Revised Fourth Edition of DOT. As discussed above, both the 1977 and 1991 DOTs scored more than 12,000 occupations. How-ever, as with most surveys, CPS does not code to such a detailed occupational classification (only about 450). To map DOT codes to census occupation codes, we utilize a special version of the April 1971 CPS issued by the National Academy of Sciences (2001), in which a committee of experts assigned individual DOT occu-pation codes and measures to the 60,441 workers in the sample. We then compute the DOT skill requirements of each census occupation as the weighted mean of the skill requirement of the DOT occupations in that census occupation using CPS sam-pling weights by occupation, industry, and gender.
Finally, we create a uniform occupation coding scheme across the period 1968– 90 to merge the skill requirements of occupations to each job in the CPS. The 1 percent census samples (IPUMS) have such a scheme, where 1960, 1970, 1980, and 1990 census occupation and industry codes are mapped to 1950 definitions (variables
occ1950andind1950). We utilize this uniform occupation classification scheme to merge DOT measures to workers in CPS.7
C. Descriptive Analysis
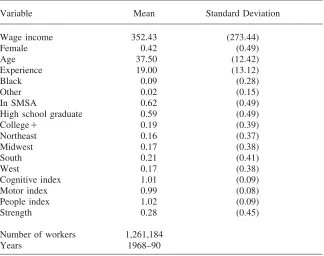
Using the matched data set, Tables 2, 3, and 4 describe the main characteristics of the data. Table 2 reports summary statistics of the variables used in the analysis. On
Bacolod and Blum 209
Table 2
Descriptive Statistics
Variable Mean Standard Deviation
Wage income 352.43 (273.44)
Female 0.42 (0.49)
Age 37.50 (12.42)
Experience 19.00 (13.12)
Black 0.09 (0.28)
Other 0.02 (0.15)
In SMSA 0.62 (0.49)
High school graduate 0.59 (0.49)
CollegeⳭ 0.19 (0.39)
Northeast 0.16 (0.37)
Midwest 0.17 (0.38)
South 0.21 (0.41)
West 0.17 (0.38)
Cognitive index 1.01 (0.09)
Motor index 0.99 (0.08)
People index 1.02 (0.09)
Strength 0.28 (0.45)
Number of workers 1,261,184
Years 1968–90
Data are from March CPS 1968–90 and DOT (1977, 1991).
average, there are 55,000 workers for each CPS year in our restricted sample as defined above, although the actual number of workers ranges from 43,490 (1975) to 67,882 (1981). On average, 42 percent of the workers in the sample are females, 9 percent are blacks, 62 percent are in statistical metropolitan areas (SMSA), 59 percent have at most a high school degree, and 19 percent have a college degree or more.
work-210
The
Journal
of
Human
Resources
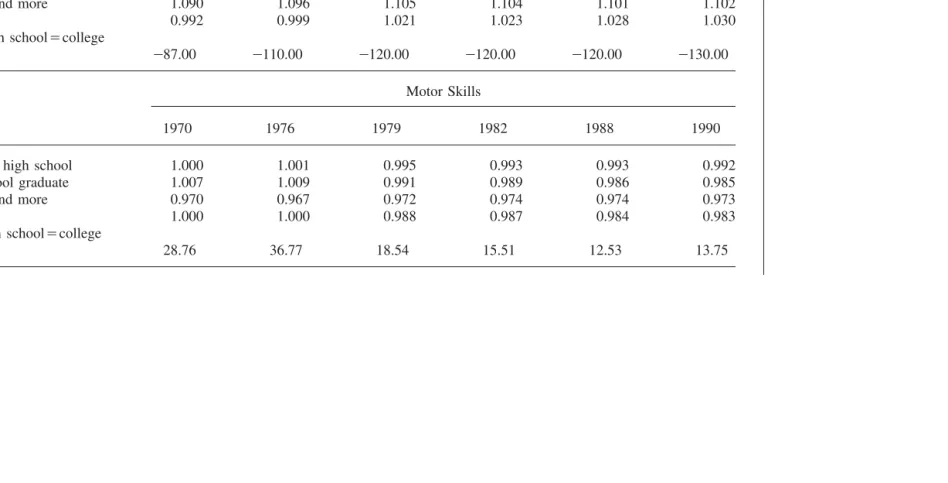
Table 3
Means of Skill Indices by Education Group
Cognitive Skills
1970 1976 1979 1982 1988 1990
Less than high school 0.943 0.940 0.965 0.964 0.966 0.965
High school graduate 0.998 0.993 1.013 1.014 1.015 1.015
College and more 1.090 1.096 1.105 1.104 1.101 1.102
Total 0.992 0.999 1.021 1.023 1.028 1.030
Test: High school⳱college
T-statistic ⳮ87.00 ⳮ110.00 ⳮ120.00 ⳮ120.00 ⳮ120.00 ⳮ130.00
Motor Skills
1970 1976 1979 1982 1988 1990
Less than high school 1.000 1.001 0.995 0.993 0.993 0.992
High school graduate 1.007 1.009 0.991 0.989 0.986 0.985
College and more 0.970 0.967 0.972 0.974 0.974 0.973
Total 1.000 1.000 0.988 0.987 0.984 0.983
Test: high school⳱college
Bacolod
and
Blum
211
Strength
1970 1976 1979 1982 1988 1990
Less than high school 0.459 0.400 0.463 0.464 0.466 0.458
High school graduate 0.269 0.236 0.294 0.289 0.289 0.292
College and more 0.084 0.071 0.158 0.155 0.164 0.155
Total 0.307 0.246 0.304 0.295 0.284 0.281
Test: high school⳱college
T-statistic 40.95 43.32 31.47 33.22 32.71 37.45
People Skills
1970 1976 1979 1982 1988 1990
Less than high school 0.962 0.960 0.978 0.978 0.982 0.981
High school graduate 1.000 0.998 1.013 1.014 1.018 1.018
College and more 1.100 1.109 1.102 1.100 1.098 1.098
Total 1.001 1.008 1.022 1.025 1.032 1.033
Test: high school⳱college
T-statistic ⳮ77.95 ⳮ91.05 ⳮ93.12 ⳮ96.67 ⳮ97.69 ⳮ100.00
212 The Journal of Human Resources
ers without a high school degree (for example, private household workers). In con-trast, physical strength is required in only 8 percent of the occupations of college graduates (for example, teachers are required to have physical strength), while it is required in 27 percent of high school graduates’ jobs (for example, operatives), followed by 46 percent of jobs occupied by workers without a high school degree (for example, laborers). It is also worth noting that differences in the various skill requirements across education groups are statistically significant and appear to be stable over time, even within education groups.
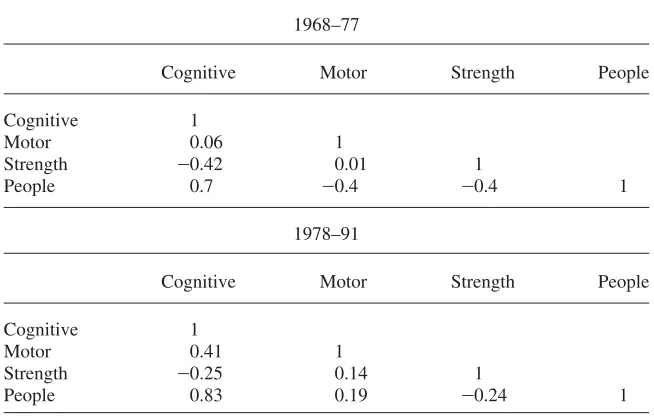
Table 4 displays the correlation among the skill requirements of occupations in the 1977 and 1991 DOTs. Occupations that require more cognitive skills tend also to require more people skills over the entire period, suggesting that cognitive and people skills complement each other. Occupations that require fewer people skills tend to require more motor skills and physical strength, and occupations that require more cognitive skills also require less physical strength. Another finding worth point-ing out in Table 4 is the increased correlation between cognitive and motor require-ments between the 1977 and 1991 DOTs. This cognitive-motor correlation might be due to technical changes and/or computerization in the workplace, particularly since many of the jobs with updated skill requirements are computer-related.
IV. The Returns to Different Skills in the U.S.
Economy
A. Specification
In this section, we estimate the wage returns to cognitive, motor, and people skills as well as physical strength in the U.S. labor market between 1968 and 1990. As discussed in Section II, we specify the empirical model as:
⬘ ⬘
lnw ⳱Z ␥ⳭX Ⳮε
(3) it it t it t it
wherewitis the weekly wage earnings of individualiat timet.Xithas the standard controls for worker characteristics: the worker’s age, age squared, cubic terms for potential work experience, SMSA status, region of residence, and dummies for hav-ing a college degree, havhav-ing a high school degree, gender, race, and marital status. Also, all the regressions include year fixed-effects.
The vectorZitcontains the DOT characteristics required to perform the occupation in which individuali is employed and proxies for the worker’s cognitive, people, and motor skills as well as physical strength.
Bacolod and Blum 213
Table 4
Pairwise Correlation Between Skill Requirements
1968–77
Cognitive Motor Strength People
Cognitive 1
Motor 0.06 1
Strength ⳮ0.42 0.01 1
People 0.7 ⳮ0.4 ⳮ0.4 1
1978–91
Cognitive Motor Strength People
Cognitive 1
Motor 0.41 1
Strength ⳮ0.25 0.14 1
People 0.83 0.19 ⳮ0.24 1
Data are from March CPS 1968–90 and DOT (1977, 1991).
B. Results
The first specification we estimate has cognitive, motor, and people skills as well as physical strength entering separately in the wage equation along with the standard controls. We use the logarithm of our measures of cognitive, motor, and people skills as the regressors so that the estimated parameters are unit-free and can be interpreted as wage elasticities. Our measure of physical strength enters in a linear way since it is a dummy variable.
Table 5 reports the wage returns to these four skills in the U.S. labor market during the 1968–90 period. We report the complete set of parameter estimates and regression statistics in Table A-2 of the online Appendix. The controls for worker characteristics have the expected pattern of sign and significance. Females earn lower wages, while married workers and white workers earn higher wages. Age has an increasing and concave effect on wages. This sign and significance pattern persists in the rest of the paper’s wage models, and thus we will not comment further on them.
214
The
Journal
of
Human
Resources
Table 5
Hedonic Price Elasticities of Skill
冢
ln(
w)
冣
ln
(
skill)
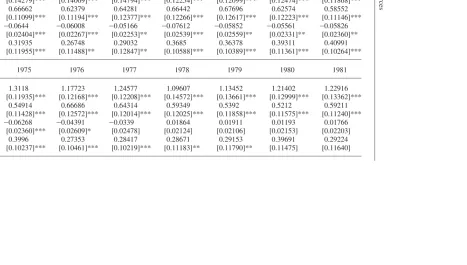
1968 1969 1970 1971 1972 1973 1974
Cognitive 1.04971 0.9963 1.12545 1.31306 1.3037 1.3243 1.27866
[0.14279]*** [0.14009]*** [0.14794]*** [0.12254]*** [0.12099]*** [0.12474]*** [0.11868]***
Motor 0.66662 0.62379 0.64281 0.66442 0.67696 0.62574 0.58552
[0.11099]*** [0.11194]*** [0.12377]*** [0.12266]*** [0.12617]*** [0.12223]*** [0.11146]*** Strength ⳮ0.0644 ⳮ0.06008 ⳮ0.05166 ⳮ0.07612 ⳮ0.05852 ⳮ0.05561 ⳮ0.05826
[0.02404]*** [0.02267]*** [0.02253]** [0.02539]*** [0.02559]** [0.02331]** [0.02360]**
People 0.31935 0.26748 0.29032 0.3685 0.36378 0.39311 0.40991
[0.11955]*** [0.11488]** [0.12847]** [0.10588]*** [0.10389]*** [0.11361]*** [0.10264]***
1975 1976 1977 1978 1979 1980 1981
Cognitive 1.3118 1.17723 1.24577 1.09607 1.13452 1.21402 1.22916
[0.11935]*** [0.12168]*** [0.12208]*** [0.14572]*** [0.13661]*** [0.12999]*** [0.13362]***
Motor 0.54914 0.66686 0.64314 0.59349 0.5392 0.5212 0.59211
[0.11428]*** [0.12572]*** [0.12014]*** [0.12025]*** [0.11858]*** [0.11575]*** [0.11240]***
Strength ⳮ0.06268 ⳮ0.04391 ⳮ0.0339 0.01864 0.01911 0.01193 0.01766
[0.02360]*** [0.02609]* [0.02478] [0.02124] [0.02106] [0.02153] [0.02203]
People 0.3996 0.27353 0.28417 0.28671 0.29153 0.39691 0.29224
Bacolod
and
Blum
215
1982 1983 1984 1985 1986
Cognitive 1.27187 1.27917 1.40325 1.44696 1.4223
[0.14436]*** [0.14355]*** [0.13238]*** [0.14805]*** [0.13852]***
Motor 0.62253 0.62674 0.53119 0.49433 0.49222
[0.12271]*** [0.12595]*** [0.11995]*** [0.12725]*** [0.12603]***
Strength 0.01965 0.02175 0.00461 ⳮ0.00032 ⳮ0.00779
[0.02390] [0.02497] [0.02244] [0.02192] [0.02269]
People 0.32094 0.30856 0.40892 0.46973 0.43344
[0.12415]*** [0.13747]** [0.12808]*** [0.13968]*** [0.14133]***
1987 1988 1989 1990
Cognitive 1.49852 1.56656 1.5988 1.61695
[0.13605]*** [0.14012]*** [0.14171]*** [0.14137]***
Motor 0.49747 0.47825 0.42578 0.41138
[0.13047]*** [0.13073]*** [0.12743]*** [0.12706]*** Strength ⳮ0.00535 ⳮ0.00826 ⳮ0.00183 ⳮ0.00153
[0.02175] [0.02164] [0.02214] [0.02168]
People 0.5293 0.52727 0.58707 0.60069
[0.14151]*** [0.14930]*** [0.14806]*** [0.14241]***
216 The Journal of Human Resources
occupation associated with a one standard deviation increase in cognitive skill re-quirements, such as going from having the cognitive skills required to be a carpenter or car mechanic to having the cognitive skills required to be a draftsperson or de-signer, was associated with a 10.5 percent increase in wages. By 1975, the same occupational change was associated with a 13.1 percent higher wage. Such a skill premium declined to 10.9 percent by 1978 and then steadily increased. By 1990, the same one standard deviation change in skill requirements was associated with a 16.2 percent increase in wages.
Motor skills were also positively and significantly valued throughout the period. As opposed to cognitive skills, motor skills became significantly less valuable over time, with the wage return to motor skills decreasing by more than 50 percent between 1968 and 1990. During the 1970s, the wage return to motor skills fluctuated without a clear trend. Since 1983, the return to these skills declined steadily, at an annual rate of 3 percent. In 1968, a change in occupation implying a one standard deviation increase in motor skill requirements, equivalent to going from having the motor skills of an economist or a psychologist to having the motor skills of a met-allurgical engineer, was associated with a 6.6 percent rise in wages. The value of motor skills fell in the 1980s, and by 1990 the same occupational change was as-sociated with only a 4.1 percent wage differential.
People skills were also positively and significantly valued in the U.S. labor market throughout the period. The wage return to people skills doubled between 1968 and 1990, the largest price increase of any of the four skills during the period. Like the return to motor skills, the return to people skills fluctuated without a trend until 1983 and then increased steadily until 1990. Between 1983 and 1990, the return to people skills increased at an annual rate of 4 percent. In 1968, a change in occupation that implied a one standard deviation increase in people skill requirements, equivalent to going from having the people skills of laborers, carpenters, or bookkeepers to having the people skills of sports officials, public administrators, or librarians, was associ-ated with a 3.2 percent rise in wages. The value of people skills increased in the 1980s, and by 1990 the same occupational change was associated with a 6.0 percent increase in wages.
Finally, the wage return to being in occupations that required physical strength was negative and small in the late 1960s and 1970s and zero by the 1980s.
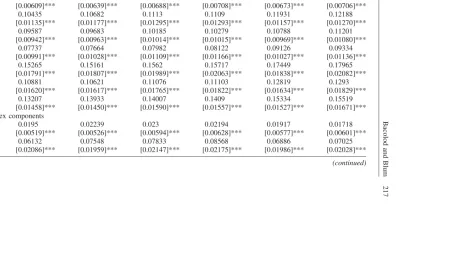
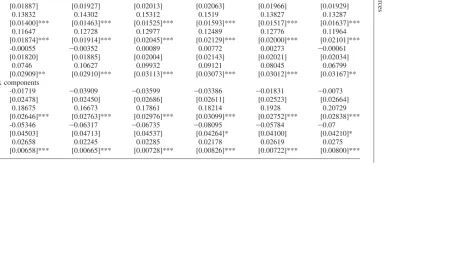
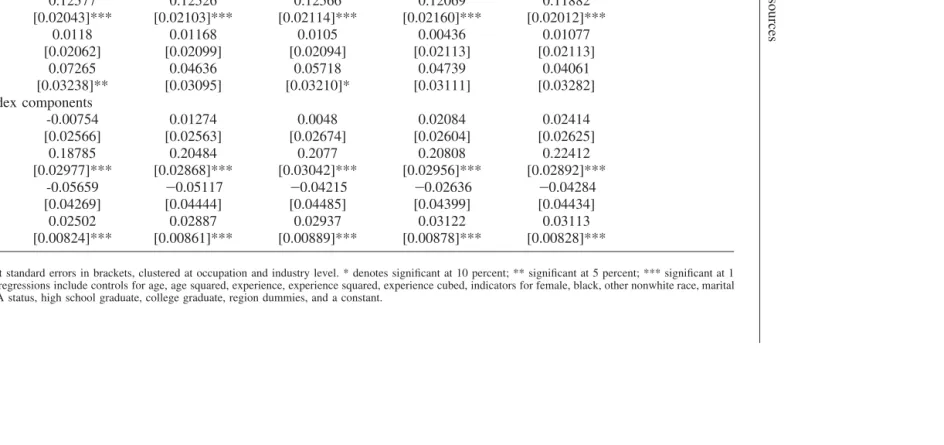
As a robustness check, Table 6 reports the wage returns to each of the DOT skill measures used to construct the cognitive, motor, and people indices.8Interestingly,
all the different aspects of cognition were valuable in the U.S. labor market and became more valuable in the 1980s. Five of the nine DOT measures used to construct the motor index were also significantly valued in the U.S. labor market, with all the measures either not changing in value or becoming less valuable in the 1980s. The four variables used to construct the people index also became more valuable in the 1980s, with two having statistically positive wage returns. This confirms that the patterns uncovered by our analysis using the skill indices are very much present in the underlying skill data.
Bacolod
and
Blum
217
Table 6
Robustness: Returns to Individual Skill
1980 1981 1982 1983 1984 1985
Cognitive index components
Data 0.05381 0.05371 0.05476 0.0558 0.06113 0.0658
[0.00609]*** [0.00639]*** [0.00688]*** [0.00708]*** [0.00673]*** [0.00706]***
gedr 0.10435 0.10682 0.1113 0.1109 0.11931 0.12188
[0.01135]*** [0.01177]*** [0.01295]*** [0.01293]*** [0.01157]*** [0.01270]***
gedm 0.09587 0.09683 0.10185 0.10279 0.10788 0.11201
[0.00942]*** [0.00963]*** [0.01014]*** [0.01015]*** [0.00969]*** [0.01080]***
gedl 0.07737 0.07664 0.07982 0.08122 0.09126 0.09334
[0.00991]*** [0.01028]*** [0.01109]*** [0.01166]*** [0.01027]*** [0.01136]***
aptg 0.15265 0.15161 0.1562 0.15717 0.17449 0.17965
[0.01791]*** [0.01807]*** [0.01989]*** [0.02063]*** [0.01838]*** [0.02082]***
aptv 0.10881 0.10621 0.11076 0.11103 0.12819 0.1293
[0.01620]*** [0.01617]*** [0.01765]*** [0.01822]*** [0.01634]*** [0.01829]***
aptn 0.13207 0.13933 0.14007 0.1409 0.15334 0.15519
[0.01458]*** [0.01450]*** [0.01590]*** [0.01557]*** [0.01527]*** [0.01671]*** Motor index components
Things 0.0195 0.02239 0.023 0.02194 0.01917 0.01718
[0.00519]*** [0.00526]*** [0.00594]*** [0.00628]*** [0.00577]*** [0.00601]***
aptf 0.06132 0.07548 0.07833 0.08568 0.06886 0.07025
[0.02086]*** [0.01959]*** [0.02147]*** [0.02175]*** [0.01986]*** [0.02028]***
218
The
Journal
of
Human
Resources
Table 6(continued)
aptk 0.01343 0.01764 0.02774 0.02524 0.00829 0.01121
[0.02340] [0.02256] [0.02363] [0.02472] [0.02444] [0.02517]
aptm -0.00829 ⳮ0.00597 ⳮ0.00215 0.01296 ⳮ0.01524 ⳮ0.02327
[0.02103] [0.01992] [0.02289] [0.02458] [0.02255] [0.02368]
apte 0.00974 0.00793 0.02022 0.0175 ⳮ0.00167 ⳮ0.00425
[0.01887] [0.01927] [0.02013] [0.02063] [0.01966] [0.01929]
apts 0.13832 0.14302 0.15312 0.1519 0.13827 0.13287
[0.01400]*** [0.01463]*** [0.01525]*** [0.01593]*** [0.01517]*** [0.01637]***
aptp 0.11647 0.12728 0.12977 0.12489 0.12776 0.11964
[0.01874]*** [0.01914]*** [0.02045]*** [0.02129]*** [0.02000]*** [0.02101]***
aptc -0.00055 ⳮ0.00352 0.00089 0.00772 0.00273 ⳮ0.00061
[0.01820] [0.01885] [0.02004] [0.02143] [0.02021] [0.02034]
sts 0.0746 0.10627 0.09932 0.09121 0.08045 0.06799
[0.02909]** [0.02910]*** [0.03113]*** [0.03073]*** [0.03012]*** [0.03167]** People index components
depl -0.01719 ⳮ0.03909 ⳮ0.03599 ⳮ0.03386 ⳮ0.01831 ⳮ0.0073
[0.02478] [0.02450] [0.02686] [0.02611] [0.02523] [0.02664]
dcp 0.18675 0.16673 0.17861 0.18214 0.1928 0.20729
[0.02646]*** [0.02763]*** [0.02976]*** [0.03099]*** [0.02752]*** [0.02838]*** influ -0.05346 ⳮ0.06317 ⳮ0.06735 ⳮ0.08095 ⳮ0.05784 ⳮ0.07
[0.04503] [0.04713] [0.04537] [0.04264]* [0.04100] [0.04210]*
peovar 0.02658 0.02245 0.02285 0.02178 0.02619 0.0275
Bacolod
and
Blum
219
1986 1987 1988 1989 1990
Cognitive index components
data 0.06366 0.06658 0.07123 0.07254 0.07447
[0.00670]*** [0.00659]*** [0.00673]*** [0.00693]*** [0.00659]***
gedr 0.11994 0.12678 0.13266 0.13582 0.1371
[0.01212]*** [0.01231]*** [0.01251]*** [0.01256]*** [0.01234]***
gedm 0.11247 0.11541 0.12033 0.1227 0.12202
[0.00988]*** [0.00980]*** [0.01009]*** [0.01039]*** [0.01066]***
gedl 0.09186 0.0967 0.10013 0.10394 0.10338
[0.01106]*** [0.01110]*** [0.01140]*** [0.01134]*** [0.01130]***
aptg 0.17493 0.18322 0.19177 0.19162 0.19725
[0.01983]*** [0.01967]*** [0.02048]*** [0.02050]*** [0.02037]***
aptv 0.1257 0.13553 0.14181 0.14096 0.14901
[0.01766]*** [0.01788]*** [0.01848]*** [0.01845]*** [0.01823]***
aptn 0.15548 0.16376 0.16983 0.17686 0.1739
[0.01576]*** [0.01517]*** [0.01556]*** [0.01635]*** [0.01655]*** Motor index components
Things 0.01613 0.01728 0.0178 0.01438 0.01322
[0.00597]*** [0.00597]*** [0.00617]*** [0.00585]** [0.00609]**
aptf 0.06911 0.07103 0.06813 0.06027 0.05555
[0.02098]*** [0.02211]*** [0.02187]*** [0.02109]*** [0.02091]***
aptk -0.00069 0.00213 ⳮ0.00609 ⳮ0.0131 ⳮ0.01382
[0.02527] [0.02498] [0.02581] [0.02497] [0.02509]
aptm -0.01968 ⳮ0.01413 ⳮ0.02647 ⳮ0.02953 ⳮ0.03597
[0.02410] [0.02514] [0.02488] [0.02370] [0.02497]
220
The
Journal
of
Human
Resources
Table 6(continued)
apte -0.01201 0.0004 ⳮ0.00957 ⳮ0.00542 ⳮ0.00675
[0.01956] [0.01986] [0.02061] [0.02132] [0.02058]
apts 0.13656 0.1402 0.1385 0.13873 0.13967
[0.01601]*** [0.01692]*** [0.01675]*** [0.01771]*** [0.01668]***
aptp 0.12577 0.12526 0.12566 0.12069 0.11882
[0.02043]*** [0.02103]*** [0.02114]*** [0.02160]*** [0.02012]***
aptc 0.0118 0.01168 0.0105 0.00436 0.01077
[0.02062] [0.02099] [0.02094] [0.02113] [0.02113]
sts 0.07265 0.04636 0.05718 0.04739 0.04061
[0.03238]** [0.03095] [0.03210]* [0.03111] [0.03282]
People index components
depl -0.00754 0.01274 0.0048 0.02084 0.02414
[0.02566] [0.02563] [0.02674] [0.02604] [0.02625]
dcp 0.18785 0.20484 0.2077 0.20808 0.22412
[0.02977]*** [0.02868]*** [0.03042]*** [0.02956]*** [0.02892]*** influ -0.05659 ⳮ0.05117 ⳮ0.04215 ⳮ0.02636 ⳮ0.04284
[0.04269] [0.04444] [0.04485] [0.04399] [0.04434]
peovar 0.02502 0.02887 0.02937 0.03122 0.03113
[0.00824]*** [0.00861]*** [0.00889]*** [0.00878]*** [0.00828]***
Bacolod and Blum 221
To summarize the results so far, cognitive, motor, and people skills were valued in the U.S. labor market in the 1970s and 1980s. However, while cognitive and people skills increased in value over time, motor skills became less valuable in the 1968–90 period.
The wage models with skills entering individually are both simple and transparent. However, they do not examine the possibility of complementarity among skills. For instance, the return to cognitive skills could differ in occupations that require many or few people skills (for example, a therapist compared to a meat cutter). Indeed, the skill correlations in Table 4 suggest that skills may interact in the performance of job-specific tasks. To allow for these complementarities among skills, we estimate our wage equation with interaction terms among DOT skill measures.9
Table 7 reports the wage returns of skills when we estimate Equation 1, with the skill vectorZitcontaining interactions among the four skills discussed above. Before discussing the results, it is worth noting that, in Table 7, the coefficient on the linear term of each skill is also the total wage return of this skill evaluated at the mean value of cognitive, motor, and people skills for occupations that do not require physical strength. This is the case because, by construction, the cognitive, motor, and people skill indices have mean 1 in the population. Therefore, at the population meanln
(
Z)
⳱0and the interaction terms drop out.it
Cognitive skills continued to be significantly valued in the U.S. labor market throughout the period. Once we allow for complementarities among skills, the wage return of cognitive skills more than doubled between 1968 and 1990. Half of the wage return of cognitive skills increase occurred in the first few years of the 1970s. In the remaining years of the 1970s, the return to cognitive skills stayed constant before steadily increasing throughout the 1980s.
The interaction terms highlight an interesting pattern of complementarities. Cog-nitive skills are more valuable in occupations that require less motor skills, no physi-cal strength, and more people skills. In addition, over time, cognitive skills have become more complementary to motor and especially people skills.
Motor skills also continue to have been significantly valued in the U.S. labor market once we allow for skill complementarities. In this case, the wage return to motor skills decreased by more than previously estimated. Between 1968 and 1990, the price of motor skills declined by about 60 percent. As before, virtually all of this decline occurred in the 1980s.
The interaction terms reveal that motor skills were complementary to physical strength in the 1970s but not in the 1980s. Meanwhile people skills become com-plementary to motor skills in the mid 1970s, and this complementarity increased over time.
The wage return to people skills varied significantly across the distribution of the other DOT skills. Evaluated at the mean values of cognitive and motor skills and for occupations that do not require physical strength, the wage return to people skills was negative or zero. This is what the coefficient on measures. However, the inter-action terms show that people skills complement all the other skills. For instance, for occupations that required physical strength (strength⳱1), the wage return to
222
The
Journal
of
Human
Resources
Table 7
Hedonic Price Elasticities of Skill
冢
ln(
w)
冣
from Model with Skill Interactionsln
(
skill)
1968 1969 1970 1971 1972 1973 1974
Cognitive 0.93179 0.97374 1.14518 1.47199 1.45422 1.5293 1.45867
[0.18228]*** [0.18816]*** [0.20934]*** [0.16568]*** [0.16939]*** [0.16512]*** [0.16436]***
Motor 0.65246 0.58269 0.51838 0.50008 0.45145 0.42106 0.4233
[0.20391]*** [0.20584]*** [0.22631]** [0.20799]** [0.21952]** [0.19547]** [0.18110]** Strength ⳮ0.03486 ⳮ0.02843 ⳮ0.01026 ⳮ0.03384 ⳮ0.01534 ⳮ0.01524 ⳮ0.0075
[0.04494] [0.03691] [0.03555] [0.04237] [0.03975] [0.03362] [0.03261] People ⳮ0.04429 ⳮ0.17996 ⳮ0.22691 ⳮ0.36819 ⳮ0.36461 ⳮ0.3182 ⳮ0.32809
[0.16031] [0.17247] [0.19438] [0.18396]** [0.18375]** [0.18279]* [0.17978]* Cognitive*motor ⳮ4.86366 ⳮ5.9211 ⳮ6.16883 ⳮ5.3797 ⳮ4.8355 ⳮ5.35698 ⳮ5.30307
[1.92244]** [1.96608]*** [2.13714]*** [1.99439]*** [2.07610]** [1.86413]*** [1.72551]*** Cognitive*strength ⳮ0.75834 ⳮ0.96068 ⳮ0.85884 ⳮ1.29236 ⳮ1.41318 ⳮ1.12457 ⳮ0.96439
[0.65364] [0.56091]* [0.54574] [0.56211]** [0.54537]*** [0.46361]** [0.47188]**
Cognitive*people 1.32466 0.96805 0.41758 2.7831 2.75077 2.15766 3.23161
[2.73956] [2.67707] [2.93988] [1.99100] [2.02332] [2.26544] [1.82505]*
Motor*strength 0.56078 0.67466 0.76291 1.01383 1.3172 0.97891 0.85064
[0.51633] [0.48082] [0.47442] [0.43925]** [0.45436]*** [0.40068]** [0.38971]**
Motor*people 0.75699 1.77303 1.58216 1.85456 1.75452 2.92427 2.97201
[1.72063] [1.74292] [1.93992] [1.47477] [1.48835] [1.55411]* [1.34257]**
Strength*people 0.30717 0.69067 0.55608 0.91927 1.14488 0.66541 0.74147
Bacolod
and
Blum
223
1975 1976 1977 1978 1979 1980 1981
Cognitive 1.50155 1.39247 1.5224 1.46363 1.56468 1.50482 1.60779
[0.16183]*** [0.17148]*** [0.16443]*** [0.19841]*** [0.17754]*** [0.18418]*** [0.18837]***
Motor 0.2642 0.42203 0.39239 0.60444 0.51506 0.55026 0.57325
[0.18405] [0.21085]** [0.19697]** [0.19889]*** [0.20261]** [0.18838]*** [0.19342]***
Strength ⳮ0.01454 ⳮ0.00364 0.02063 0.04036 0.04792 0.04954 0.05329
[0.03261] [0.03614] [0.03161] [0.02260]* [0.02270]** [0.02410]** [0.02351]** People ⳮ0.39454 ⳮ0.40406 ⳮ0.48106 ⳮ0.41375 ⳮ0.44587 ⳮ0.42819 ⳮ0.54428
[0.18348]** [0.19393]** [0.18105]*** [0.22014]* [0.21291]** [0.20584]** [0.20849]*** Cognitive*motor ⳮ3.67122 ⳮ3.50034 ⳮ5.2873 ⳮ4.10764 ⳮ3.86847 ⳮ3.79207 ⳮ3.75733
[1.75910]** [1.99920]* [1.88395]*** [1.65564]** [1.68299]** [1.57861]** [1.62718]** Cognitive*strength ⳮ0.89914 ⳮ0.81213 ⳮ0.77116 ⳮ0.94224 ⳮ0.93369 ⳮ0.14077 ⳮ0.37346
[0.45103]** [0.48584]* [0.44468]* [0.50799]* [0.44337]** [0.47962] [0.44720]
Cognitive*people 3.0501 3.84004 3.32002 4.80141 3.98398 5.62759 4.89358
[1.94566] [1.89329]** [1.74491]* [2.01270]** [2.04162]* [1.85725]*** [1.85427]***
Motor*strength 1.19251 1.05195 0.97774 0.45615 0.48239 ⳮ0.03429 0.16357
[0.38553]*** [0.43998]** [0.40427]** [0.43192] [0.41081] [0.43253] [0.41625]
Motor*people 2.04204 2.12905 2.84882 3.12256 2.76211 2.90183 2.42379
[1.47744] [1.44564] [1.35112]** [1.42794]** [1.47445]* [1.31154]** [1.34000]* Strength*people 0.61646 0.50172 0.57541 0.39399 0.36001 ⳮ0.17451 0.04399
[0.42784] [0.44313] [0.40910] [0.72407] [0.68753] [0.76430] [0.70526]
224
The
Journal
of
Human
Resources
Table 7(continued)
1982 1983 1984 1985 1986
Cognitive 1.69221 1.70187 1.79585 1.79933 1.78099
[0.19085]*** [0.19898]*** [0.18846]*** [0.20598]*** [0.19500]***
Motor 0.59206 0.51221 0.4246 0.46113 0.41178
[0.20371]*** [0.21073]** [0.20454]** [0.21591]** [0.21462]*
Strength 0.05376 0.06421 0.05079 0.04933 0.04271
[0.02538]** [0.02647]** [0.02351]** [0.02301]** [0.02373]* People ⳮ0.52513 ⳮ0.51532 ⳮ0.63134 ⳮ0.58133 ⳮ0.57977
[0.22558]** [0.22183]** [0.20534]*** [0.21224]*** [0.21765]*** Cognitive*motor ⳮ4.41484 ⳮ3.16705 ⳮ3.54199 ⳮ3.73309 ⳮ3.61892
[1.62185]*** [1.64545]* [1.48056]** [1.62859]** [1.56634]** Cognitive*Strength ⳮ0.77857 ⳮ0.11618 ⳮ0.35212 ⳮ0.16194 ⳮ0.04768
[0.47058]* [0.51977] [0.48303] [0.44961] [0.46243] Cognitive*People 4.42031 4.26206 5.22458 4.85633 3.87616
[2.04899]** [2.19477]* [1.84391]*** [2.02275]** [2.11852]* Motor*strength 0.22283 ⳮ0.18945 0.10002 ⳮ0.1614 ⳮ0.17062
[0.42657] [0.49946] [0.45740] [0.44253] [0.45352]
Motor*people 3.54783 3.07203 2.89202 2.67433 2.67491
[1.39001]** [1.46221]** [1.34119]** [1.41574]* [1.44014]* Strength*people 0.39643 ⳮ0.29934 0.19096 0.02384 ⳮ0.10462
Bacolod
and
Blum
225
1987 1988 1989 1990
Cognitive 1.81464 1.92295 1.89812 1.97939
[0.18202]*** [0.19912]*** [0.19818]*** [0.19921]***
Motor 0.3539 0.42424 0.38155 0.26317
[0.18920]* [0.20847]** [0.19860]* [0.20014]
Strength 0.05226 0.04772 0.05735 0.06607
[0.02328]** [0.02271]** [0.02346]** [0.02290]*** People ⳮ0.45139 ⳮ0.54865 ⳮ0.52618 ⳮ0.5014
[0.21491]** [0.22467]** [0.22963]** [0.23124]** Cognitive*motor ⳮ2.44065 ⳮ4.16616 ⳮ3.28613 ⳮ3.31446
[1.47672]* [1.52589]*** [1.48597]** [1.49963]** Cognitive*strength 0.00858 ⳮ0.03472 ⳮ0.12798 0.04491
[0.48404] [0.48634] [0.53279] [0.51712] Cognitive*people 3.42452 3.23149 3.34902 3.10818
[2.12615] [2.13560] [2.17964] [2.08164] Motor*strength ⳮ0.14126 ⳮ0.23283 ⳮ0.04651 ⳮ0.07293
[0.43399] [0.45671] [0.48536] [0.48973]
Motor*people 2.95463 3.09731 1.70023 3.11546
[1.50318]** [1.61544]* [1.60208] [1.59463]* Strength*people ⳮ0.05743 ⳮ0.06568 0.18031 ⳮ0.12444
[0.70634] [0.69921] [0.74965] [0.81099]
226 The Journal of Human Resources
people skills became positive, even at the mean values of cognitive and motor skills. The same is true for occupations requiring above average cognitive and/or motor skills. For these occupations, people skills were positively and significantly valued. These findings show that people skills were not valued by themselves in the U.S. labor market but that they raised the returns to cognitive and motor skills and even physical strength (in some years of the sample period). Moreover, the complemen-tarity of people skills with cognitive and motor skills strongly increased over time, which is why people skills became more valuable during the 1968–90 period.
Finally, the wage return to being in occupations that require above average physi-cal strength was zero in the 1970s and positive but quite small in the 1980s. As discussed above, physical strength was complementary to motor skills in the 1970s but not in the 1980s and tended to be more valuable with people skills and less valuable with cognitive skills.
To summarize, the 1970s and 1980s witnessed a large increase in the wage returns to cognitive and people skills, with the distinction that people skills became more valuable by being complementary to other skills. There was also a large decline in the wage return to motor skills during these decades. Physical strength became some-what more valuable in the 1980s but not significantly so.
C. Robustness: Mismeasured Skills, Unobserved Characteristics, and Workers Selection
We turn now to the robustness of the estimates obtained in the previous section. There are a number of possible reasons why our data on workers’ skills might be measured with error. For instance, the skill requirements of occupations may vary within the three-digit occupational categories we use. If such variation is systemat-ically correlated with the measured DOT requirements, our parameter estimates will be biased. Also, the DOT codebook characterizes occupation skill requirements as minimums. It is possible, therefore, that workers have skills that exceed the DOT requirements for their jobs. In this case, we would underestimate worker skills. Irrespective of the source of mismeasurement, if errors are unrelated to the measured skill requirements of occupations, no bias would be introduced into the estimation, although the estimation would become less precise. Also, if workers are not com-pensated for skills in excess of the occupation’s requirements, no bias would be introduced. Our estimates would be biased if any excess skills are both rewarded and also somehow correlated with the measured skill requirements. It is worth noting that if the skill space is compact and all skills have a positive hedonic price, then there would be no possibility of workers having more skills than the occupation requirements. This compactness assumption is obviously never met exactly but may be close to correct given the large number of occupations we have in the data.
Bacolod and Blum 227
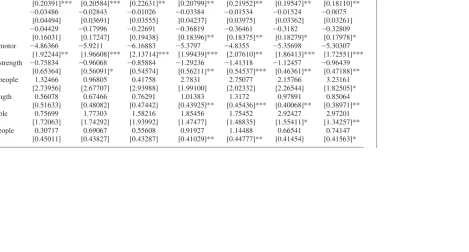
Table A-3 in the online Appendix provides summary statistics of the NLSY79 sample. We estimate the wage returns to cognitive, motor, and people skills as well as physical strength for the period 1978–90 (survey years 1979–91). In the first specification, we stack all years and control for individual skills (for example, AFQT score) and family background but do not utilize the data’s panel structure. In the second specification, we control for individual fixed-effects. The fixed-effects spec-ification controls for any observed or unobserved individual characteristic that affects a worker’s wage as long as this characteristics is time invariant.
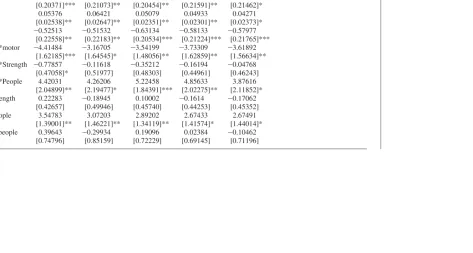
Table 8 shows the estimated wage returns of skills in the NLSY79 sample. The first columns have the estimates controlling for individual skills and family back-ground. The second set of columns has the estimates of the model with individual fixed-effects. In both specifications, we interact skill requirements with a linear trend to capture the evolution of skill returns over time. We also estimate a specification where skill requirements are interacted with year dummies, and the same qualitative results hold.
Both specifications confirm that the price of cognitive and people skills increased while the price of motor skills declined between 1979 and 1991. As expected, the specification with individual fixed-effects shows less pronounced changes in the wage returns to skills. The specifications with all the variables and their interactions show the same pattern of results as before, except that the significance levels are lower. This should be expected given the smaller sample size and the stronger de-mands that the individual fixed effects specification imposes on the data.
In summary, to the extent that data mismeasurements and/or unobserved skills are uncorrelated with the measured skills, our skill price estimates are unbiased. If they are correlated with the measured skills but are time-invariant, we can control for them using the panel structure of NLSY79. When we do so, we confirm the main patterns found in the CPS data.
It is possible, however, that the unobserved characteristics of workers are changing over time in ways that are systematically related to their cognitive, motor, and people skills as well as their physical strength. The most likely reason why this could happen is that the underlying quality of workers in the labor force can change in ways that cannot be captured with our data. This is particularly important for women, a group that has seen a large increase in its labor force participation rates. Thus, our wage return estimates might be spuriously picking up changes in the unobserved quality of workers in the labor force.10
We check for this possibility by controlling for the labor force participation de-cision of women using a Heckman selection model. To estimate this model, we use the number of children under the age of six and marital status as exclusion restric-tions, which Mulligan and Rubinstein (2004, 2005) discuss in detail.
Table A-5 in the online Appendix shows the estimated wage returns to skills in this case. These do not differ qualitatively from the estimates without controlling for selection in terms of significances and magnitudes and, more importantly for our
228
The
Journal
of
Human
[image:32.612.138.661.208.499.2]Resources
Table 8
Hedonic Price Elasticities of Skill
冢
ln(
w)
冣
With Individual Fixed Effects, NLSY79ln
(
skill)
Stacked OLS
Cognitive Motor Strength People All
Cognitive 0.13372 0.94471
[0.19038] [0.28642]***
Motor 1.15862 0.50542
[0.20719]*** [0.25427]**
Strength 0.10838 0.04676
[0.03795]*** [0.03158]
People ⳮ1.06844 ⳮ1.36013
[0.29412]*** [0.57010]**
Cognitive*motor ⳮ6.00201
[2.59904]**
Cognitive*strength ⳮ0.19515
[0.66623]
Cognitive*people 5.07183
[3.25023]
Motor*strength 0.00853
[0.43875]
Motor*people 7.87063
[3.73302]**
Strength*people ⳮ0.13928
Bacolod
and
Blum
229
Trend ⳮ0.00357 0.00245 0.00942 ⳮ0.00103 ⳮ0.00399
[0.00239] [0.00259] [0.00307]*** [0.00243] [0.00350]
Trend interacted with
Cognitive 0.13045 0.13104
[0.01584]*** [0.03388]***
Motor ⳮ0.07177 ⳮ0.01205
[0.02078]*** [0.03041]
Strength ⳮ0.01396 0.00045
[0.00438]*** [0.00413]
People 0.14412 ⳮ0.00154
[0.02190]*** [0.05607]
Cognitive*motor ⳮ0.1711
[0.24200]
Cognitive*strength ⳮ0.10146
[0.06771]
Cognitive*people 0.01997
[0.31414]
Motor*strength 0.02441
[0.04022]
Motor*people ⳮ0.10083
[0.28611]
Strength*people 0.09562
[0.05996]
Constant 0.02857 ⳮ0.07345 ⳮ0.03941 ⳮ0.0761 0.01717
[0.09729] [0.10434] [0.14907] [0.10097] [0.10453]
Observations 89,071 89,071 90,617 89,071 89,071
Number of persons 10,959 10,959 10,959 10,959 10,959
R-squared 0.22 0.21 0.21 0.21 0.24
230
The
Journal
of
Human
[image:34.612.137.688.131.508.2]Resources
Table 8(continued)
Fixed Effects
Cognitive Motor Strength People All
Cognitive
Motor
Strength
People
Cognitive*motor
Cognitive*strength
Cognitive*people
Motor*strength
Motor*people
Strength*people
Trend 0.17888 0.16794 0.20412 0.18136 0.15898
Bacolod
and
Blum
231
Trend interacted with
Cognitive 0.09931 0.14968
[0.01056]*** [0.02158]***
Motor ⳮ0.02785 ⳮ0.01634
[0.01052]*** [0.02103]
Strength ⳮ0.00551 0.00584
[0.00181]*** [0.00223]***
People 0.08077 ⳮ0.01333
[0.01189]*** [0.03320]
Cognitive*motor ⳮ0.06271
[0.17808]
Cognit