T H E J O U R N A L O F H U M A N R E S O U R C E S • 47 • 4
Evidence from the Vietnam Generation
Ofer Malamud
Abigail Wozniak
A B S T R A C T
We examine the causal effect of education on migration using variation in college attainment due to draft-avoidance behavior during the Vietnam War. We use national and state-level induction risk to identify both college attainment and veteran status for men observed in the 1980 Census. 2SLS estimates imply that additional years of college significantly increased the likelihood that affected men resided outside their birth states later in life. Most of our estimates suggest a causal impact of higher education on mi-gration that is larger in magnitude but not significantly different from the OLS estimates.
I. Introduction
Data from the 1940–2000 U.S. Censuses show that the long-distance migration rates of college graduates are roughly twice those of high school gradu-ates.1Strikingly, these migration rates by education group have been largely stable over these six decades, despite large increases in postsecondary educational
attain-1. This is true for both out-of-birth state residence and migration across state/county lines in the past five years in the Census. For early evidence on educational migration differentials, see Ladinsky (1967) and Greenwood (1975). Wozniak (2010) and Greenwood (1997) provide more recent evidence. Ferrie (2005) provides evidence on migration rates over the past 150 years, but education is only recorded in the Census beginning in 1940.
Ofer Malamud is an assistant professor at the Harris School of Public Policy at University of Chicago and NBER. Abigail Wozniak is an assistant professor of economics at the University of Notre Dame, NBER and IZA. The authors would like to thank Dan Black, Caroline Hoxby, Lawrence Katz, Thomas Lemieux, Lars Lefgren, and Laddie Sula for helpful conversations and comments. Comments from semi-nar participants at the NBER Education Program Meeting, the Midwest Economics Association Meet-ings, Society of Labor Economists MeetMeet-ings, University of Notre Dame, University of Illinois-Urbana Champaign, Dartmouth College, University of Illinois-Chicago, Indiana University-Purdue University In-dianapolis, Rutgers University, Princeton University, and the University of Maryland improved the paper. The data used in this article can be obtained beginning May 2013 after publication through April 2016 from Abigail Wozniak (a_wozniak@nd.edu).
[Submitted August 2011; accepted December 2011]
ment. While this suggests that higher education may have a causal impact on mi-gration, we cannot rule out other explanations for this pattern, such as falling trans-portation and communication costs, without a credibly identified empirical analysis.2 However, in contrast to the extensive evidence on the causal impact of education on wages (Card 1999), little is known about the role of education as a causal de-terminant of migration. Geographic mobility may afford individuals with a greater range of choices over jobs and locations and also may reflect an ability to respond appropriately to spatial disequilibria across labor markets. As such, migration con-stitutes an important return to schooling that is distinct from increased wages. In this paper, we use exogenous variation in college going to provide the first credible analysis of the causal relationship between education and migration.
We exploit variation in college attainment induced by draft-avoidance behavior among men affected by the Vietnam conflict to isolate the causal effect of education on migration. This approach is inspired by Card and Lemieux (2000, 2001a), who document excess educational attainment among cohorts who enter college as a means of deferring conscription into the Armed Services during the Vietnam conflict. While Card and Lemieux focus on differences in the risk of induction into the military across birth cohorts, we further exploit state level variation in induction riskwithin cohorts. The existence of state level variation allows us to decompose national in-duction risk into its constituent parts: inin-duction risk faced by a young man’s own state cohort and induction risk faced by young men of that cohort in the rest of the country. We use this new source of variation to consistently estimate our parameter of interest in the presence of two endogenous variables—education and veteran status. This approach is an advance over studies that identify college going using only year-to-year variation in induction risk (De Walque 2007; Grimard and Parent 2007; MacInnis 2006). We also draw on six-month rather than yearly records of induction rates, which provides for greater temporal variation in induction risk. Fi-nally, the decomposition of induction risk into its national and state components is a novel use of two instruments to address the endogeneity of both education and military status that is common in studies using changes in military policies as in-strumental variables (Angrist and Krueger 1992; Bound and Turner 2002; Stanley 2003).3
Using microdata from the 5 percent sample of the 1980 U.S. Census of Population, we provide ordinary least squares (OLS) and two-stage least squares (2SLS) esti-mates of the effect of college education on migration. In cross-sectional OLS re-gressions, we observe that an additional year of postsecondary schooling is associ-ated with an increase in the probability of residing outside one’s birth state of 1.8 to 3.4 percentage points, or approximately 5–10 percent of the mean of this variable. When we instrument for college education with cohort-level induction risk, the causal effect of an additional year of postsecondary schooling on migration is gen-erally larger, but estimates range from 2.7 percentage points to 9.0 percentage points. These results imply that the entire disparity in migration rates between those with
2. Hoxby (2009) describes how falling transportation and communication costs have affected the migration patterns of college students.
and those without a college degree—a gap of roughly 20 percentage points—is due to the causal impact of obtaining a college education. Moreover, the large reduced-form estimates for the effect of induction risk on out-of-state migration suggest that the Vietnam War led to substantial migration across the national labor market.
We conclude with an examination of the mechanisms that might explain our find-ings. We are able to rule out two potential mechanisms. First, the college migration premium is not driven by moving away to college. We show instead that the pro-pensity to migrate is similar across individuals with different ex ante propensities to attend college out of state, based on historical patterns in college going. Using a similar strategy, we also show that the college migration premium is not due to exposure to a geographically diverse set of peers in college. These results suggest that a useful avenue for future research is to explore the ways in which other mech-anisms might contribute to the migration impact of a college education.
Our paper contributes to a long-standing literature on the determinants of migra-tion and to the more recent literature examining the causal impact of educamigra-tion on nonpecuniary outcomes. By testing for a causal relationship between a college edu-cation and migration, we document the interaction between these two key dimensions of human capital.4 This has important implications for individual welfare. Geo-graphic mobility, like health, expands the set of choices available to individuals and therefore provides individuals with options that can increase utility. For example, by allowing individuals to move to avoid negative economic shocks, migration can have a direct impact on individual earnings and potentially mitigate these shocks on those individuals who remain (Wozniak 2010; Bound and Holzer 2000).
In a related fashion, the focus on migration also serves to expand the notion of human capital acquired through schooling to include a broader set of skills and attributes. From an economic perspective, migration can be viewed as an individual response to labor market disequilibria (Bowles 1970). Documenting a causal link between education and migration would therefore suggest that education confers— in addition to other skills—the ability to deal with disequilibria. Indeed, there was a period in which leading labor economists considered the question of whether edu-cation confers the ability to respond to economic disequilibria, but this line of anal-ysis withered without resolution.5Examining the nature of the relationship between education and migration may provide new insight into this important question.
II. The Vietnam Draft
Between 1964 and 1973, almost two million men were drafted through the Selective Service System to serve in the Vietnam conflict. The Selective Service System, which comprised over 4,000 local draft boards across the nation at
that time, was responsible for registering recruits and classifying them for either deferment or selection. All men over the age of 18 were required to report to their local draft board for classification. Those who were classified as ”available for ser-vice” and passed the preinduction examinations were liable for induction.6 Local draft boards were also able to issue deferments for various reasons, such as school attendance or the presence of dependent children. Prior to the introduction of the draft lottery in 1969, the process of determining which men were drafted was set according to the following priorities: highest priority for “delinquents”—those who failed to register or failed to report for the preinduction physical; second priority for volunteers; and third priority for nonvolunteers aged between 19 and 25. It is worth noting that not everyone who was called before a draft board was inducted into the military, and not everyone who was inducted actually served in Vietnam.
College enrollment was a well known and virtually foolproof way to defer and avoid conscription. Before 1967, deferment for the purposes of four-year college enrollment was almost guaranteed in practice through the individual decisions of local draft boards.7The Military Service Act of 1967 made this official by stating that college students in good standing could defer induction until receipt of an un-dergraduate degree or age 24, whichever occurred first. Indeed, over 1.7 million college deferments were granted in 1967 alone.8Although men who received college deferments were technically eligible for induction until age 35, very few men be-tween the ages of 26 and 35 were ever drafted. Card and Lemieux (2000) estimate that, among men born between 1945 and 1947, those with a college degree were only one-third as likely to serve in Vietnam as compared to those without a college degree. Thus, there was a very large incentive for men to enroll in college to avoid the draft during these years.
The introduction of the draft lottery in 1969 led to a substantial change in the induction process. The first lottery, held on December 1, 1969, determined priority for induction in 1970 according to random sequence numbers (RSNs) assigned to the day and month of men born between 1944 and 1950. Additional draft lotteries took place in 1970, 1971, and 1972 which were applicable to men born in 1951, 1952, and 1953, respectively. College deferments continued to be issued until Sep-tember 1971, and men who were already enrolled were allowed to retain their de-ferment until the end of the school year. For our purposes, the relevant fact is that the real and perceived risk of induction during this period was much lower than in the draft board era. Men were at risk of induction under the lottery for only a single year, and the overall rate of inductions was substantially lower (as documented
6. Men who were drafted were generally assigned to serve in the Army for up to three years, although they could potentially choose their branch of service by volunteering and thereby also qualify for a shorter period service.
7. Tatum and Tuchinsky,Guide to the Draft, Ch. 3. By contrast, enrollment in a two-year college was not considered grounds for automatic deferment. Students at two-year programs were only eligible for occu-pational deferments under the same rules as those already employed. See Rothenberg (1968).
below).9Importantly, in contrast to the draft board era, most men could accurately gauge their own risk of induction once their lottery number was assigned.
A. Variation in Inductions over Time
The number of inductions varied considerably over the course of the Vietnam War. From 1960 to 1963, inductions were fairly low at approximately 8,000 men per month. However, following the Gulf of Tonkin incident on August 2, 1964, Congress authorized an expanded role for the U.S. military in Vietnam. Inductions more than doubled from 1964 to 1965 and again from 1965 to 1966. By the spring of 1968, in the midst of raging student protests, the rate of inductions reached a peak of almost 42,000 a month. During the period that the draft lottery was in place, the rate of inductions fell rapidly from about 20,000 per month in late 1969 to 2,000 per month in late 1971. In February of 1973, the draft was suspended and no more inductions took place.
Responsibility for devising and meeting the national target number of conscrip-tions rested with the federal Department of Defense (DoD). To achieve this target, the DoD issued monthly “draft calls” that divided the national number into quotas assigned to state draft boards, which did the active work of ordering men to be inducted. The monthly state quotas sum to the national draft call each month.10The sum of monthly state and national draft quotas over consecutive six-month periods were reported in the Semiannual Reports of the Director of the Selective Service System to Congress. We use this information to construct a measure of induction risk based on semi-annual induction rates in our empirical analysis.
B. Variation in Risk of Induction across States
Institutional factors also caused induction risk to vary across states within a cohort. State level variation in induction risk arose for several reasons. First, there was a great deal of variation in operating procedures across local draft boards that, in turn, led to local variation in induction risk. Davis and Dolbeare (1968) identify three sources of variation in local board risk, “. . . [1] variation based on differences in socioeconomic characteristics of jurisdictions; [2] variation among states based on differences in policy interpretations provided to local boards and exaggerated by success in achieving standardization around such particular practices; and [3] vari-ation produced by idiosyncratic discretionary decision-making by local boards” (p. 18). They later write, “The conclusion seems inescapable: local board autonomy implies both within state and between state variability, even among socioeconomi-cally similar board jurisdictions,” (Davis and Dolbeare 1968, p. 84). Similar idio-syncrasies were enumerated in the 1967 report of the National Advisory Commission
9. Note that the lottery also altered the risk of induction within a cohort: Men who received high (low) RSNs faced relatively low (high) risk of induction. The net effect of these changes is theoretically ambig-uous but likely to be small.
on Selective Service.11 Finally, Shapiro and Striker (1970, Ch. 20) write that “a registrant’s chances of being inducted vary with his board’s deferment policy.”
A second source of variation in induction risk across states and over time was the severe communication delays between the federal, state, and local officials in charge of the draft. These delays meant that local draft boards knew the current number of registrants available in their jurisdiction whereas the DoD assigned quotas using registrant numbers that were several months old. Thus, induction risk for an eligible man at a point in time was not only a function of the number of men in his state currently eligible for the draft but also of the number available several months ago. The current pool could be much larger than the past pool if, for example, a large number of local men graduated high school thus becoming draft-eligible or much smaller if a large number married or aged out of the draft pool in the intervening months. In practice, boards were encouraged to have just enough eligible registrants to match the number of inductees they would be asked to produce in response to the next call. Under this pressure, communication lags led to a cobweb-type feedback loop as boards struggled to achieve the successful “standardization” identified in the second item of the Davis and Dolbeare list (See Shapiro and Striker 1970, Ch. 20).
III. Identification Strategy
We identify the causal effect of education on migration using vari-ation in college going caused by draft-avoidance behavior in response to the risk of being drafted during the Vietnam conflict. An artifact of our identification strategy is that the likelihood an individual is a veteran also varies across cohorts in our sample. Insofar as veteran status is a plausible determinant of migration (Pingle 2007), it is important to control for this variable in our empirical estimation. To complicate matters, veteran status is also plausibly endogenous, since unobserved individual characteristics might drive both the decision to become a veteran and the decision to migrate.12 Our equation of interest therefore includes both college at-tainment and veteran status as endogenous variables. Accordingly, our identification strategy uses two instruments to isolate exogenous variation in both endogenous variables.
Despite the complication of an additional endogenous variable, we prefer our approach to other instrumental variables for postsecondary education that have been used in the recent literature. Two prominent examples include new college openings
11. Echoing Davis and Dolbeare’s item [2], the commission noted, “Much of the System’s uneven per-formance relates to the lack of standardization in the guidance the local boards receive.” The commission also noted a high level of inconsistencies in performance within and across boards. For example, they found that among the individual records they reviewed, 27 percent of those reclassified to I-A (eligible for service) were so classified prior to the conclusion of their existing deferment (National Advisory Com-mission on the Selective Service 1967, Ch. 3).
(Currie and Moretti 2003) and the introduction of state-level merit aid programs such as the Georgia Hope Scholarship (Dynarski 2008). However, these alternative instruments increase access to college by lowering the relative price of nearby or in-state colleges, and may therefore also affect the likelihood of migrating out-of-state through the decision to attend a local or in-out-of-state college. An important feature of our instrumental variable strategy is that it identifies the effect of higher education on migration in the absence of such relative price changes, and is therefore more appropriate for answering our question of interest.
A. The National and State-Level Cohort Risk Instruments
We extend an instrumental variables strategy inspired by Card and Lemieux (2000, 2001), henceforth CL. They show that Vietnam era induction risk varied significantly across birth year cohorts due to differences in military manpower requirements and cohort size, and find that young men responded to an increased risk of induction by attending and completing college at higher rates than predraft cohorts.13In particular, CL use total national inductions as the numerator in the following annual measure of induction risk for a birth cohort:
(
∑
a= 19to22Ica)
/4 CL induction risk =(1) c
Nc
where Iis the number of inductees from a birth year cohort, N is the number of men in that cohort, cindexes birth cohorts, and a indexes age since a cohort was most at risk to be drafted between the ages of 19 and 22. We have experimented with alternatives to the CL induction risk measure, such as using induction risk at age 19 only or incorporating population size of other cohorts. We prefer the CL measure, however, since it both incorporates additional risk faced beyond age 19 and normalizes that risk for an individual’s own cohort size.
Like CL, we assume that draft avoidance was proportional to the risk of induction. However, in order to account for the mechanical relationship between inductions and veteran status, we exploit state-level variation within the cohort-level variation identified by CL. The existence of state- and cohort-level variation allows us to break national induction risk into its constituent parts. We thereby obtain two sepa-rate instruments that can be used to identify both college attainment and veteran status. Moreover, we use semiannual data on inductions by state to construct a measure of induction risk based on six-month birth cohorts, which provides addi-tional temporal variation (as in Siminski and Ville 2011). Thus, young men faced state cohort risk that is analogous to the CL measure, where s indexes state of residence:
(
∑
a= 19to22Isca)
/4 staterisk =(2) sc
Nsc
This measure of induction risk is our first instrument. We then use our state-level data onIandNto construct a second instrument in the following manner:
(
∑
a= 19to22∑
s′⬆sIs′ca)
/4 nationalrisk =(3) sc
∑
Ns′c s′⬆s
This measure defines national cohort risk for a man living in statesand born in the six-month birth cohort c as the number of inductees from all other states, s′, and six-month birth cohort c, divided by the total number of such men. This is highly correlated with CL’s measure but varies across birth state and birth cohort. Note that the inclusion of the national and state cohort risk measures is analogous to the inclusion of both state and national unemployment rates as explanatory variables (as in Ziliak, Wilson, and Stone 1999).
To construct the measures in Equations 2 and 3, we obtained data on the number of inductees from each state for each six-month period spanning 1961 to 1972 from reports of the Selective Service.14 We estimate state cohort size using enrollment numbers spanning 1959 to 1970, the academic years in which our cohorts of interest were in 11th grade.15 Thus state- and cohort-level induction risk for a young man born in Alabama in the first half of 1950 equals the number of inductees from Alabama in the first half of 1969 (the year he turned 19) divided by half the number of students enrolled in 11th grade in Alabama in 1967.16National level risk for the same young man equals the number of men inducted nationally in the first half of 1969, divided by the size of his six-month birth cohort, after subtracting own state inductions from the numerator and own state cohort size from the denominator. Like CL, we construct an average induction risk for the years a man was 19 to 22, since induction risk was nontrivial for men ages 20 to 22.
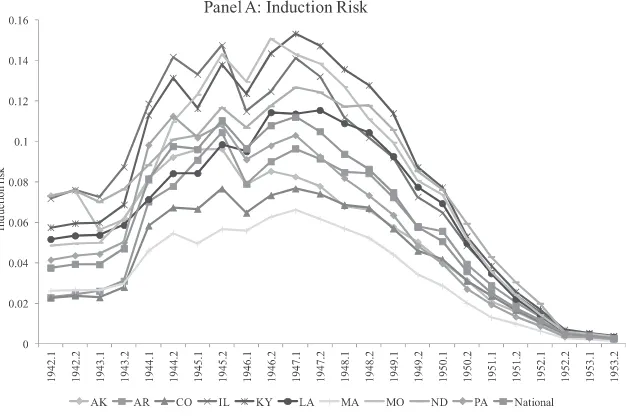
Figure 1 graphs the variation in state-level induction risk for a selection of states over our period of interest. Panel A shows raw induction risk as defined in Equation 2 while Panel B shows residual induction risk after controlling for a cohort trend, state-of-birth fixed effects, and national risk. Insofar as we include these controls in our main empirical specifications, the patterns in Panel B approximate our identi-fying variation. Note that there is indeed variation across states in the induction risk that is not explained by fixed state characteristics alone. Moreover, residual induction risk in a state appears to fluctuate smoothly over time. This is not surprising given that our measure of induction risk is based on the average risk faced by men between the ages of 19 and 22. By averaging the risk of induction over several years, we
14. Semiannual induction data are not available from 1961 to 1966 so we divide yearly inductions by two for the six-month intervals in this period.
15. For 1959 and 1960, we only have information on total high school enrollment so we divide this figure by four to approximate 11th grade enrollment. We divide yearly enrollments by two for all six-month intervals. We also check our estimates using enrollment in 10th grade.
Figure 1
Induction Risk for Selected States
mechanically introduce some degree of serial correlation and use lower frequency variation to identify the impacts of draft avoidance behavior.17
The observed variation in induction risk is consistent with the known sources of cross-state variation in induction risk. While Davis and Dolbeare identify idiosyn-cratic variation in draft board decision-making (the third item in their list), the other sources of state and local variation in risk would tend to generate smooth fluctuations in relative state risk. For example, if the demographics of a local board jurisdiction are changing smoothly such that more men are aging into the draft pool, but the local board is slow to adjust the number of deferments it granted, risk will slowly decline in this jurisdiction over time. In any case, these smooth fluctuations do not pose a threat to our identification strategy as long as our instruments meet the stan-dard instrumental variables (IV) assumptions. Furthermore, any serial correlation in our instrumental variables can be handled through appropriate standard error ad-justments along the lines discussed in Bertrand, Duflo, and Mullainathan (2004) and Angrist and Pischke (2009, Ch. 8).
B. Validity of Our Instruments
We present our first-stage estimates in the results section, but given the novelty of our IV strategy, the exclusion restriction and the monotonicity condition bear some discussion. The exclusion restriction requires that the components of induction risk have no influence on migration choices except through the channels of college at-tainment and veteran status. Our instruments could fail to meet this restriction if young men attempted to exploit local variation in induction risk by moving between localities. In fact, draft board policies prohibited this type of “local board shopping.” Rothenberg (1968) notes that it is a myth that “you [can] change draft boards the way you change your patronage of a supermarket or a bank.” A young man was required to register with his local board at age 18, and this remained his local board for his entire period of draft eligibility. In the event that he did move away, his original local board always maintained final decision making authority over his draft eligibility although some particulars of draft processing may have been handled by a board closer to his new residence.18 It was also unlikely that young men had accurate information about their particular board’s deferment policies. Indeed, a lack of transparency regarding board operating procedures was a main criticism of the Selective Service during this period (National Advisory Committee on the Selective Service 1967, Ch. 3).
Monotonicity requires that there be no “defiers” in the population—that is, indi-viduals who would have gone to college or become veterans in the absence of the
17. Note that the rationale for this average measure is derived from the fact that men faced induction risk over several years (rather than the presence of adjustment lags as in Baker, Benjamin, and Stanger [1999]). Appendix Figure A1, which plots induction risk based on inductions at age 19 only, displays substantially less serial correlation.
draft but who did not because of the draft (Angrist and Imbens 1994; Angrist et al. 1996). It is difficult to test for such a subpopulation directly, and most IV applica-tions simply assume there are no defiers. We are, however, somewhat concerned that blacks may have been crowded out of college slots by large numbers of whites attempting to avoid conscription, a violation of monotonicity. In light of this, we verified that our results are not sensitive to this assumption by estimating our main models separately for blacks and whites (results available upon request).
C. Interpretation in the Presence of Indirect Effects of Veteran Status and Education
It is possible that our two endogenous variables influence one another, in addition to the outcome variable of interest, and this possibility complicates the interpretation of our results.19This possibility is probably strongest for an indirect effect of veteran status on migration through education. Beyond a direct effect through the experience of training for combat in another state or actually going to war in Vietnam, there may be an indirect effect of veteran status on migration through education because the GI Bill subsidized education for most veterans. Recent work by Angrist and Chen (2011) indicates that veterans were more likely to attend college than nonvet-erans, primarily as a result of the educational benefits conferred to them by the GI Bill. Given this additional pathway, we cannot separately identify the direct and indirect effects of veteran status on migration.
It might seem that there is also an indirect effect of education on mobility via veteran status. After all, the key to our identification strategy is that college students could delay and eventually avoid conscription by staying in school. However, in-duction rates at thebirth state and birth cohort level were unlikely to be affected by draft-avoidance behavior. This is because local draft boards were required to fulfill specific manpower requirements from the Department of Defense. If a certain individual avoided the draft, someone else from his state-cohort would need to be drafted instead. Indeed, Flynn (1993, Ch. 7) notes that even with deferments, the Johnson administration—which was by far the largest user of conscripted service-men—never faced significant manpower constraints on its Vietnam plans.20 More-over, there is no evidence that supply constraints among the noncollege-enrolled population ever resulted in local boards overturning the draft exemption for this group. This historical evidence suggests that, to a first approximation, veteran status at the state-year cohort level was unaffected by college-going decisions. We therefore assume that education does not affect migration through veteran status at the level of our identifying variation. Since our empirical analysis employs specifications in which the data has been aggregated to the state-cohort, this allows us to interpret
19. In the language of the literature on indirect effects, these are called mediating variables. For detailed exposition, see Robins and Greenland (1992), Pearl (2005), and Rosenbaum (1984).
our coefficients on education in the second stage equations as the direct effect of education on migration.
A final consideration in interpreting our results is the possibility for heterogeneous treatment effects. Specifically, some marginal college students will have been “sent directly” to college because of the desire to avoid induction risk, and others will have been “sent indirectly” to college because the instruments affected their veteran status which gave them access to the GI Bill and, in turn, college. The estimates in Equation 1 are therefore free from omitted variables bias, but our coefficient on education will reflect the average treatment effect of college going for both the “draft dodging” and the GI Bill-funded college students. To the extent that the treatment effect varies across these different types of induced college going, our estimates reflect the average of two different local average treatment (LATE) effects.
IV. Data and Empirical Specifications
A. Data
Our data on the “Vietnam generation” come from the IPUMS microdata 5 percent sample of the 1980 Census (Ruggles et al. 2004). CL focused their analysis on men born between 1935 and 1955. Due to data limitations on state-level induction rates and enrollment, we restrict our sample to men born between 1942 and 1953. How-ever, these cohorts experienced the largest rise and fall in induction risk, so we do not lose much time-series variation relative to CL by excluding the earlier and later cohorts. MacInnis (2006), who also focused on men born between 1942 and 1953, argues that a shorter span of cohorts is also less likely to introduce cohort bias.
We restrict our analysis to men. CL use women as a comparison group by assum-ing that female college attainment is an appropriate counterfactual for male college attainment in the absence of the Vietnam War. However, there are reasons to believe that female college attendance may have been affected by male college going during the Vietnam years, with large inflows of men into college either crowding out women who would otherwise have attended or encouraging more women to attend to take advantage of marriage market prospects.21Regardless of whether or not women offer an appropriate counterfactual for men in the context of college going, the presence of spousal links between men and women in their geographic location decisions suggests that they may not be a useful counterfactual in the context of migration. For these reasons, we prefer to control directly for secular trends in male college going and use our birth state and birth cohort variation to identify changes in male college going driven by induction risk.
Our main measure of migration is a dummy variable indicating whether or not an individual resides outside his birth state when we observe him in the 1980 Census (during his late twenties or early thirties). This measure captures long-distance
gration that generally involves a change in local labor markets.22Hence, such moves are more likely to capture the relationship between education and the ability to make changes in the face of disequilibria. We can also show that educational differences in one-year and five-year migration rates are similar to those in the out-of-birth state measure.23We prefer the lifetime rates since they more closely approximate the stock of migration choices. Finally, although parental migration patterns contribute to the lifetime migration measure, the migration differential between children of more and less educated parents is small compared to differentials observed across education groups later in life (Wozniak 2010).
Our primary measure of educational attainment is years of postsecondary school-ing, which we term “years of college.”24We also present alternative specifications using binary measures such as attending or completing college. Since these measures typically suffer from different types of potential biases, it is useful to examine ro-bustness to these alternative measures of educational attainment.25Our measure of veteran status is based on the veteran indicator available in the 1980 Census.
We also consider two additional variables that are intended to capture labor market conditions facing a cohort at the time of the college enrollment decision: (a) the employment to population (epop) ratio in the individual’s state of birth in the year his cohort turned 19, and (b) the log of the number of respondents from a birth state and birth year cohort in the 1960 Census. Together, these approximate the changes in labor demand and labor supply, which may have occurred alongside changes in state-level induction risk.26 For example, Molloy and Wozniak (2011) show that internal migration rates, including inter-state migration rates, are procyclical. De-scriptive statistics are shown in Table 1, which summarizes the variables used in our analysis for the sample of men born between 1942 and 1953.
B. Empirical Specification
We estimate all of our regressions at the birth state by birth cohort level because our source of exogenous variation occurs at this level. Consequently, our main econometric model is as follows:
m mig =λ′X +βvet +γeduc +τtrend +δ +ε
(1) sc sc sc sc c s sc
22. See Molloy, Smith, and Wozniak (2011) for a discussion of the measurement error involved in assum-ing a move across state lines involves a move between local labor markets.
23. We tabulated one-year and five-year migration rates for 20-to-45 year-olds in our four education groups from the 1981 Current Population Survey and the 1980 Census, respectively.
24. Using years of schooling (at any level) as an outcome yields broadly similar results. But, as we demonstrate in a subsequent section, the impact of our instruments is focused on educational attainment at the postsecondary level.
25. College completion has been shown to be the most accurately measured higher education outcome and to contain little measurement error overall (Black et al. 2003). On the other hand, years of postsec-ondary schooling is unlikely to be plagued by error that is negatively correlated with the recorded value, as is the case with the dummy variable schooling measures (Kane, Rouse, and Staiger 1999; Black et al., 2000).
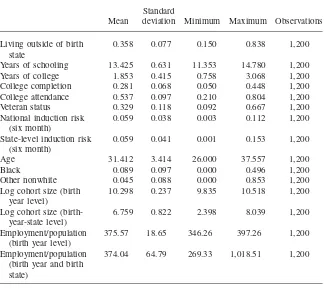
Table 1
Years of schooling 13.425 0.631 11.353 14.780 1,200
Years of college 1.853 0.415 0.758 3.068 1,200
College completion 0.281 0.068 0.050 0.448 1,200
College attendance 0.537 0.097 0.210 0.804 1,200
Veteran status 0.329 0.118 0.092 0.667 1,200
National induction risk
Other nonwhite 0.045 0.088 0.000 0.853 1,200
Log cohort size (birth
Notes: Data are from the 5 percent sample of the 1980 U.S. Census, available from IPUMS. All specifi-cations are restricted to men born between 1942 and 1953. Uncollapsed sample size is 793,704. Cohort size is derived from the 1960 Census. Mobility is equal to 1 if respondent resides outside his state of birth at the time of the Census, and 0 otherwise. The employment-population ratio is defined for the year in which individuals are 19 years of age. Log cohort size is defined as the logarithm of the number of respondents to the 1960 Census in the corresponding year of birth.
where sindexes state of birth and c indexes six-month birth cohorts, migsc is the fraction of men residing outside their state of birth,vetscis the fraction of veterans, andeducsc is average years of postsecondary (college) schooling completed. In ad-dition,trendcis a linear trend in birth cohort,Xscis our set of demographic controls (which includes fraction of blacks and Hispanics), and δs represents a full set of state-of-birth dummies. Allowing for state-of-birth fixed effects removes variation arising from states with persistently higher or lower than average induction rates, which may be associated with other state characteristics (for example, industrial composition) that are correlated with migration rates.
at the time of the college enrollment decision, employment to population ratio and log cohort size. The second adds nine linear birth region trends to the estimating equations. These trends further account for changes in college-going or migration that may have been correlated with changes in state level induction risk. For spec-ifications using only national induction risk as a single instrument, we use national aggregates for cohort size and the employment rate.
Our endogenous variables,educscandvetsc, are predicted from first-stage equations that include the remaining right-hand side covariates in Equation 1 plus staterisksc andnationalriskscas defined in Equations 2 and 3, respectively. Estimation is done via standard linear 2SLS, weighted by the number of observations in each state-cohort cell.27Standard errors are clustered by birth state and by birth cohorts fol-lowing the multilevel clustering procedure in Cameron, Gelbach, and Miller (2006). For the purposes of comparison with the previous literature, we also present results from specifications in which we predict for education using onlynationalrisksc(and where we cluster at the birth cohort level).
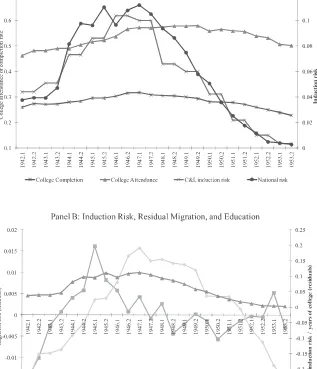
Figure 2 plots the means of selected variables separately for each birth cohort. The pattern of induction risk across cohorts is evident in Panel A, which also shows the high correlation between our measure of national risk in Equation 3 and CL’s measure in Equation 1. The increase in college going is also visible in Panel A, particularly for cohorts born between 1944 and 1950, during the main rise and fall in induction risk. Panel B plots our measures of education and migration (adjusted for a basic set of controls) alongside our national risk measure. This is essentially a graph of our reduced form results, and it indicates that migration and educational attainment increase along with national induction risk across cohorts.
The inclusion of controls in our 2SLS regressions removes a large amount of variation from our instruments. To assess the remaining variation, we regressed both risk measures, Equations 2 and 3, separately on the sets of controls just described. TheR-squared from all six versions of this exercise—two outcome variables times three sets of controls, used in Tables 3 through 6 below—ranged between 0.25 and 0.42. This means that we are using approximately two thirds of the variation in the risk measures to identify our endogenous variables.28
V. Results
A. First-Stage and Reduced Form Results
Table 2 presents first stage estimates from Equation 1 as well as the two augmented specifications. In Panel A, national and state-level cohort risk are entered separately as the only variables identifying years of schooling. This is similar to the approach
27. See Wooldridge (2002) pp. 622–624 concerning 2SLS versus an approach with a probit first stage when the endogenous variable is a dummy variable. In some cases, the probit approach is more efficient but may tend to produce larger point estimates. Given our concerns about possible upward bias, we implement 2SLS estimation.
Figure 2
Induction Risk and Outcome Variables
Malamud
and
W
ozniak
929
Panel A: National and state-level induction risk, enteredseparately
Years of college Years of college
Dependent variable (1) (2) (3) (4) (5) (6)
National induction risk 3.689*** 3.269*** 3.237***
[0.335] [0.257] [0.256]
State-level induction risk 3.284*** 2.946*** 2.942***
[0.297] [0.273] [0.265]
Trend X X X X X X
Demographic controls X X X X X X
Cohort size X X X X
Employment rate X X X X
Birth region trends X X
F−test on IV 121.1 162.2 159.9 122.5 116.4 122.8
The
Journal
of
Human
Resources
Table 2(continued)
Panel B: National and state-level induction risk, enteredtogether
Years of College Veteran Status
Dependent variable (1) (2) (3) (4) (5) (6)
National induction risk 5.127*** 5.164*** 4.537*** 1.327*** 1.296*** 1.357***
[0.794] [0.498] [0.536] [0.207] [0.172] [0.140]
State-level induction risk −1.440** −1.804*** −1.240*** 0.743*** 0.629*** 0.581***
[0.704] [0.420] [0.446] [0.156] [0.119] [0.082]
Trend X X X X X X
Demographic controls X X X X X X
Cohort size X X X X
Employment rate X X X X
Birth region trends X X
A-P F for multivariate endogenous variables
13.5 41.7 21.4 92.6 193.8 260.5
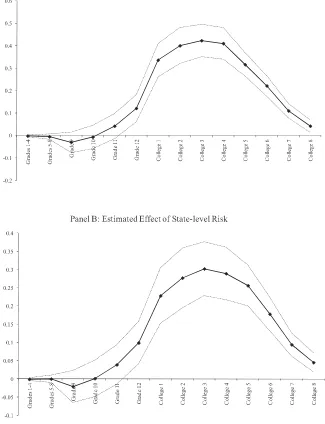
taken in previous studies in which education is assumed to be the only endogenous variable. Columns 1 through 3 of Panel A show that a ten percentage point increase in national cohort risk (roughly the entire range of this variable) increased the av-erage years of college in our sample by 0.32 to 0.37 years with the impact declining somewhat as we add additional controls to the basic specification in Column 1. In other words, cohorts with higher national risk also attain more years of postsecond-ary schooling. This is consistent with Figure 1 and the results in CL (2000, 2001). Although our specification differs from that of CL, the magnitude of our coefficients is similar. The F-statistics suggest that this first stage has substantial power.29We repeat the first stage estimation using only state cohort risk as the identifying variable in Columns 4 through 6 of Panel A. When national cohort risk is excluded, state cohort risk positively predicts schooling for men in our sample, although the point estimates are slightly smaller than those generated by national risk. Figure 3 plots the coefficients and standard errors from separate regressions of educational attain-ment at each grade level and higher (inclusive), and confirms that higher national and state-level induction risk increased male educational attainment at all postsec-ondary levels.
Panel B shows first stage equations from our preferred approach of identifying both years of college and veteran status in Equation 1. For transparency, we estimate two separate first stage equations—predicting years of college and veteran status separately—although 2SLS estimates these equations jointly. Consistent with the manner in which 2SLS identifies endogenous variables, both equations include na-tional andstate cohort risk as identifying variables. Columns 1 through 3 of Panel B show that, as in Panel A, increased national induction risk is strongly associated with increases in years of college. TheF-tests reported in the final row of the table are calculated according to the (corrected) Angrist and Pischke (2009) procedure and indicate that our instruments have sufficient power. The point estimates are larger than when using national risk alone, indicating increases of 0.45 to 0.52 years of college over the range of induction risk in our sample. On the other hand, years of college are negatively related to state cohort risk when national induction risk is included. This is in sharp contrast to the relationship between years of college and state risk in Panel A, which suggests that increases in schooling attainment are largely driven by variation in national risk.
It is not clear a priori what relationship we should expect between state risk and years of college in the Panel B specifications. If young men were aware of their state risk, we might expect a positive relationship between state risk and years of college as men “dodged in to college” more in riskier state-years. Our review of the historical literature suggests that this was not the case, and the results support this. On the other hand, if young men were unaware of their state level risk, we would expect no relationship. Indeed, while national cohort risk was relatively easy to judge as national draft calls were widely reported, deviations of state cohort risk from national risk were probably unknown ex ante. The presence of a negative relationship
Figure 3
Relationship between Completed Education and Induction Risk
may be an artifact of the high correlation (collinearity) between national and state level risk. The coefficient pattern across Panels A and B—in which state level risk positively predicts education when national risk is excluded and the point estimates on national risk increase when state risk is included—is consistent with collinearity (Verbeek 2000; Wooldridge 2002). While collinearity does not introduce systematic bias since the predicted values of the endogenous variables in the first stage are correct in expectation, it may contribute to imprecision in our second stage estimates. Columns 4 through 6 address the second endogenous variable in Equation 1. These show that national and state cohort risk both covary positively with veteran status. This is reassuring since higher rates of induction risk at both the state and national level should push more young men into this group. We interpret the fact that the coefficient on national risk exceeds that of state risk in the veteran equation to mean that the time series variation in induction risk generated by the massive fluctuation in aggregate military manpower demands is responsible for more of the variation in veteran status than are the differences in induction risk across states.
Table 3 presents reduced form estimates of the impact of induction risk on our measure of migration.30The results are striking. The estimates show that increases in national cohort risk are associated with a large increase in the likelihood than an individual is residing outside his birth state. Men from the highest risk cohort are 8–13 percentage points more likely to reside outside their states of birth than men in the lowest risk cohort. This difference is the equivalent of roughly one-fourth to one-third of the mean of this variable in Table 1. When state cohort risk is included, the impacts of national risk on migration are even larger and state cohort risk has generally weak negative impacts on migration.
B. OLS and 2SLS Effects of College Education on Migration
Table 4 presents our main results. It reports both OLS and 2SLS estimates of Equa-tion 1. For the purposes of comparison, Panel A reports our results using only national risk as a single instrument for years of college (without controls for veteran status since it is likely to be endogenous). Our preferred estimates are in Panel B, where we instrument for both years of college and veteran status using our two risk measures. We report our OLS estimates in Columns 1 through 3 of both panels. An additional year of postsecondary schooling is associated with about a two percentage point increase in the likelihood that a man resides outside of his birth state in our most parsimonious specifications. Including additional controls yields a coefficient of approximately three percentage points, or roughly 10 percent of the mean of our dependent variable. Interestingly, veteran status is not associated with increased mi-gration in these OLS specifications.
Columns 4 through 6 of Panel A show results from 2SLS estimation using only national risk to instrument for years of college and omitting veteran status from the equation. The impact of schooling on migration is both economically and statistically significant, ranging from 2.7 percentage points in our most parsimonious specifica-tion to more than four percentage points in our augmented specificaspecifica-tions.
The
Journal
of
Human
Resources
Table 3
Reduced-Form Estimates of Induction Risk on Migration
Dependent variable: living outside state of birth (mean = 0.358)
(1) (2) (3) (4) (5) (6)
National induction risk 0.100*** 0.132*** 0.132*** 0.272** 0.270** 0.281**
[0.033] [0.027] [0.028] [0.131] [0.126] [0.121]
State-level induction risk −0.173 −0.153 −0.166
[0.116] [0.113] [0.110]
Trend X X X X X X
Demographic controls X X X X X X
Cohort size X X X X
Employment rate X X X X
Birth region trends X X
R2 0.92 0.92 0.92 (a) (a) (a)
Notes: Robust standard errors in brackets, clustered by six-month birth-year interval in Columns 1–3 and by birth state and six-month birth interval (two-way, multilevel) in Columns 4–6. ***, **, and * indicate statistical significance at the 1, 5, and 10 percent level, respectively. Data are from the 5 percent sample of the 1980 U.S. Census, available from IPUMS. All specifications are restricted to men born between 1942 and 1953. Number of observations is 1200 in each regression. Trend is a linear trend in age. Demographic controls include race (white, black, other) and birth state fixed effects. Cohort size is derived from the 1960 Census and defined at the birth year-level in Columns 1, 2, and 3 and birth year and birth state in Columns 4, 5, and 6. Employment rate is the employment-to-population ratio, also defined at the birth-year
level in Columns 1, 2, and 3 and birth year-state in Columns 4, 5, and 6. (a) To facilitate multilevel clustering, estimates in Panel B obtained fromivreg2package, which
Malamud
and
W
ozniak
935
Dependent variable: living outside state of birth (mean = 0.358)
Panel A: IV with national-level induction risk
OLS 2SLS
(1) (2) (3) (4) (5) (6)
Years of college 0.018*** 0.031*** 0.034*** 0.027*** 0.040*** 0.041***
[0.005] [0.005] [0.005] [0.009] [0.008] [0.008]
Trend X X X X X X
Demographic controls X X X X X X
Cohort size X X X X
Employment rate X X X X
Birth region trends X X
R2 0.92 0.92 0.92
The
Journal
of
Human
Resources
Table 4(continued)
Panel B: IV with national and state-level induction risk
OLS 2SLS
(1) (2) (3) (4) (5) (6)
Years of college 0.021** 0.029*** 0.029*** 0.076* 0.066* 0.090**
[0.008] [0.009] [0.008] [0.046] [0.038] [0.045]
Veteran status −0.01 0.00 −0.001 −0.087 −0.054 −0.094
[0.015] [0.011] [0.012] [0.073] [0.059] [0.072]
Trend X X X X X X
Demographic controls X X X X X X
Cohort size X X X X
Employment rate X X X X
Birth region trends X X
R2 (a) (a) (a)
Notes: Robust standard errors in brackets, clustered by six-month birth intervals in Panel A and by birth state and six-month birth interval (two-way, multilevel) in Panel B. ***, **, and * indicate statistical significance at the 1, 5, and 10 percent level, respectively. Data are from the 5 percent sample of the 1980 U.S. Census, available from IPUMS. All specifications are restricted to men born between 1942 and 1953. Number of observations is 1,200 in each regression. Trend is a linear trend in age. Demographic controls include race (white, black, other) and birth state fixed effects. Cohort size is derived from the 1960 Census and defined at the birth year-level in Columns 1, 2, and 3 and birth year and birth state in Columns 4, 5, and 6. Employment rate is the employment-to-population ratio, also defined at the birth-year level in Columns 1, 2, and 3 and birth year-state in Columns 4, 5, and 6. Columns 4, 5, and 6 of Panel A use national-level induction risk to instrument for years of schooling. Columns 4, 5, and 6 of Panel B use national and state-level induction risk at six-month intervals to instrument for schooling and veteran status. (a) To facilitate multilevel
Columns 4 through 6 of Panel B show our preferred estimates from 2SLS esti-mation of Equation 1, which use both national and state-level induction risk to instrument for years of college and veteran status. These causal estimates of years of college on migration are larger than the single IV estimates of Panel A, although they also cover a fairly large range. The smallest estimate implies that an additional year of schooling raises the probability of an out-of-state residence by 6.6 percentage points while the largest implies an increase of 9.0 percentage points. The 2SLS estimates in Panel B also have large standard errors, yet all are significant at ventional levels. The estimates across all three 2SLS specifications in Panel B con-sistently imply a large causal role for years of college in determining migration. Instrumenting for veteran status indicates no significant impact on subsequent mi-gration, which matches the OLS estimates on this variable.
The OLS coefficients on years of college typically lie within the 95 percent con-fidence interval around our 2SLS estimates because the latter are estimated with large standard errors. We compare our estimates more formally using a Durbin-Wu-Hausman test for endogeneity and find that we cannot reject the null hypothesis that the OLS and IV estimates are the same for any of the specifications in Panel B of Table 4.31 Nevertheless, the magnitudes of our IV estimates are consistently larger than those of OLS. Two standard explanations immediately come to mind. First, measurement error might bias OLS estimates downward so eliminating this bias can lead to larger IV estimates. This bias might be more likely in our sample if older respondents are more likely to misreport educational attainment in retrospective sur-veys. Second, heterogeneity in the response to treatment may lead to local average treatment effects on the marginal college graduate (identified in our 2SLS estimates) that differ from the average effect (identified in OLS). We find some evidence for the possibility of heterogeneous effects in the National Longitudinal Survey of Youth. In that data, we observe higher returns to college completion among groups who were more likely to be marginal college students during the Vietnam era.32
It is also possible that the historical setting of our instrument leads to larger treatment effects than would be found in a different context. One might worry that induction risk increased the likelihood of attending an out-of-state college because marginal college students had to search more widely to find a college that would accept them. If so, and if moving away to college is an important mechanism through which college has a causal effect on migration, this may have led to larger estimated effects of college on migration in our setting. In fact, the Department of Education’s Residence and Migration Surveys of 1963, 1968, 1975 show that students attended out-of-state colleges at similar rates during periods of higher and lower induction risk.
C. Specification Checks
We conducted a number of tests to examine the robustness of the results in Table 4. First, we repeated the Table 4 analysis using alternative measures of educational 31. TheF-statistic of this test for the 2SLS specifications in Panel A of Table 4 are 0.04, 0, and 0.09 respectively (p-values of 0.844, 0.952, and 0.768). TheF-statistic of this test for the 2SLS specifications in Panel B of Table 4 are 0.10, 0.16, and 0.97 respectively (p-values 0.746, 0.686, 0.324).
attainment: dummy variables for college attendance (measured as 13 or more years of schooling) and for college completion (16 or more years of schooling). The results are reported in Appendix Table A1.33Both college attendance and college comple-tion are associated with significantly higher probabilities of out-of-state residence among the men in our sample. Our IV estimates of the causal impact of college completion are statistically indistinguishable from the impact of college attendance, although the magnitudes are larger for college completion. Additionally, dropping national induction risk and replacing the trend with birth year dummies in the Table 4 specifications—which forces our identifying variation to come solely from cross-state differences in induction rates—does not qualitatively alter our conclusions, nor does using overall national cohort risk as defined in Equation 1 as one of our in-struments.
Table 5 reports the results of two placebo-type analyses intended to verify that the causal relationship we identify is in fact driven by the response of young men in our affected cohorts to the induction risk they faced. First, we reestimate our reduced form specifications for men in our sample of cohorts using data from the 1960 Census. At this point in their lives, these men had not yet been subject to the incentives of enrolling in college to avoid the Vietnam draft. If the cohorts who would eventually face the greatest induction risk were somehow also more likely to have migrated by our measure beforethe draft, this might indicate that our causal estimates in Table 4 are spurious. It would suggest that high-risk cohorts were some-how different from low-risk cohorts in a way that might lead them to have both higher educational attainment and migration rates.
The results from this exercise are in Panel A of Table 5. The specifications in Columns 2 and 3 using only national induction risk to instrument for education indicate that men who face higher national risk in the future were also more likely to have moved out of their birth states prior to 1960. This suggests estimates using national risk alone to identify years of schooling in our augmented specifications should be interpreted with caution. However, we find no significant relationship between the induction risk a man will face in the future and his out-of-state residence in 1960 for specifications that use both national and state-level induction risk. The magnitudes of these reduced-form estimates are also substantially smaller than those from Table 3. Hence, we take these results as supporting our preferred identification strategy of instrumenting for both education and veteran status.
In Panel B, we estimate our 2SLS models on a set of placebo cohorts. Unfortu-nately, there is no ideal placebo group on which to run such a test. We use men born between 1930 and 1941—the 12 cohorts preceding those in our sample—who were too old to be affected by induction orders during the Vietnam conflict although by virtue of their age these men were not subject to the same nondraft-related cohort factors experienced by the men in our main sample. The estimates in Panel B are very noisy due to a weak first stage in this sample, and they show no significant relationship between education and migration when we use our Vietnam induction
Malamud
and
W
ozniak
939
Dependent variable: living outside state of birth
Panel A: Reduced-Form Estimates of Induction Risk on Childhood Migration (1960 Census)
(1) (2) (3) (4) (5) (6)
National induction risk 0.041 0.088*** 0.086*** 0.055 0.075 0.018
[0.032] [0.026] [0.026] [0.109] [0.106] [0.102]
State-level induction risk −0.014 −0.006 0.046
[0.110] [0.121] [0.113]
Trend X X X X X X
Demographic controls X X X X X X
Cohort size X X X X
Employment rate X X X X
Birth region trends X X
R2 0.02 0.02 0.02 0.02 0.02 0.02
Mean of dependent variable 0.163 0.163 0.163 0.163 0.163 0.163
The
Journal
of
Human
Resources
Table 5(continued)
Panel B: IV Estimates for Schooling on Migration for cohorts born 1930–41(1980 Census)
2SLS with national risk 2SLS with national and state-level risk
(1) (2) (3) (4) (5) (6)
Years of schooling 0.047 −0.568 0.187*** 0.823 −0.144 −0.15
[0.212] [5.556] [0.029] [101.358] [0.236] [0.457]
Veteran Status −8.441 −0.055 −0.086
[969.336] [0.236] [0.225]
Trend X X X X X X
Demographic controls X X X X X X
Cohort size X X X X
Employment rate X X X X
Birth region trends X X
Mean of dependent variable 0.396 0.396 0.396 0.396 0.396 0.396
risk measures to identify years of college. This is consistent with our claim that these instruments affect educational attainment only for our main sample of cohorts and that it is the education of these cohorts that leads to increased migration.
VI. Mechanisms Behind the Causal Relationship
Our results suggest a large causal role for higher education in mi-gration. It is then natural to ask what the mechanism is through which college has these effects. We hypothesize that the causal effect may arise through either direct or indirect channels. On the one hand, higher education maydirectlyconfer skills or provide information that improves one’s ability to make a long-distance move. For example, individuals may develop general cognitive skills that facilitate the accumulation of information about alternative employment possibilities in other places. Individuals may also gain specific information about new opportunities for migration either through attending college away from home or by interacting with peers who come from other places. In addition, the process of moving to college may foster greater skills for migration, especially when associated with a move across state lines. A college education may also lower the psychic costs associated with migration by fostering openness to new experiences and increasing exposure to a diverse peers which may lessen the difficulties of adjusting to a new place.
On the other hand, higher education may indirectly affect the likelihood of un-dertaking a long-distance move. Research shows that increased schooling is causally related to higher wages (Card, 2001). If moving involves a fixed monetary cost, higher incomes may increase migration. Across the United States, the market for college graduates is often considered more geographically integrated than the market for lower-educated workers. If the skills associated with a college education are marketable in many regions, this may make it easier to consider moving out of state (Bound et al. 2004). Finally, education may alter other noneconomic characteristics, such as marriage, that can affect the likelihood of migration (Lefgren and McIntyre 2006).
Using data on the population enrolled in college from the 1960 Census, we pro-vide epro-vidence on two of the direct mechanisms mentioned above: exposure to a geographically diverse set of peers and a move out of state to attend college. Spe-cifically, we use data on individuals who report attending college in the 1960 Census to create two separate rankings of states: the “out of state” ranking and the “geo-graphic diversity” ranking.34The first ranks states according to the shares of their college-attending natives getting their degrees out of state, with quartile 1 having the lowest shares of its natives attending college out of state and quartile 4 the highest. If the experience of moving to go to college is an important channel behind the causal impacts we estimate, we might expect the college migration premium to be larger for natives of the highest quartile states. The “geographic diversity” ranking
divide states into quartiles according to the geographic diversity of their college populations measured using a Herfindahl index.35 If exposure to a geographically diverse set of fellow students increases awareness of other labor markets or improves one’s network in distant locations, we might expect the college migration premium to be larger for natives in states with more geographically diverse colleges. The states in each set of quartiles are listed in Table 6.
We use our sample of Vietnam era men from the 1980 Census to estimate versions of our main 2SLS specification in which years of postsecondary schooling is inter-acted with quartile indicators for each of the two state rankings. Because this spec-ification contains five endogenous variables—the four interactions with schooling plus veteran status—we instrument using interactions of the four quartiles with na-tional risk plus (noninteracted) state risk.36The results, including OLS estimates, are shown in Table 6.
We find that for natives of states in the bottom quartile of out-of-state college going, the OLS migration premium to an extra year of postsecondary schooling in our sample, of 0.028, is significantly lower than that for natives in the higher three quartiles, who get returns of 0.040 to 0.047. As was the case with the 2SLS estimates of the migration premium in earlier tables, the IV estimates in the second column of Table 6 have large standard errors. These prevent us from saying definitively whether or not the causal effect of higher education on migration is larger for natives of one quartile than another, although the point estimates in the IV column are similar in magnitude across quartiles, suggesting little difference in the causal impact of college attendance on migration across quartiles of the out-of-state ranking.37In the case of the geographic diversity of one’s college peers, the OLS estimates show no consistent difference in the schooling migration premium across natives from states in the four quartiles of this distribution. Again, the 2SLS estimates are noisy, but they do not suggest that the causal impact of higher education on subsequent migration is higher for natives of states in which the college system enrolls a more geographically diverse set of students.
VII. Conclusion
This paper examines the causal impact of a college education on the likelihood of making a lasting, long-distance move out of one’s birth state by early-to mid-adulthood. We exploit changes in national and state- level risk of induction into the Armed Forces during the Vietnam conflict as a source of exogenous variation
35. We also estimated specifications that included interactions of percent out-of-state with the state Her-findahl measures. These gave qualitatively similar results.
36. We find qualitatively similar results when we estimate these effects using interactions of the four quartiles with national risk as well as interactions of the four quartiles with state-level risk (an overidentified specification).
Table 6
Potential Mechanisms
Dependent variable: living outside state of birth
Out-of-State College
Years of schooling*Quartile 1 0.028*** 0.031 0.045*** 0.107*
(0.005) (0.065) (0.003) (0.059)
Years of schooling*Quartile 2 0.044*** 0.073 0.040*** 0.088**
(0.002) (0.054) (0.003) (0.044)
Years of schooling*Quartile 3 0.044*** 0.078 0.037*** 0.145**
(0.002) (0.066) (0.003) (0.060)
Years of schooling*Quartile 4 0.047*** 0.061 0.040*** 0.097**
(0.003) (0.060) (0.005) (0.049)
Veteran Status 0.057*** −0.042 0.056*** −0.123
(0.005) (0.097) (0.005) (0.078)
Trend X X X X
Demographic controls X X X X
Cohort size X X X X
Employment rate X X X X
Birth region trends X X X X
Geographic diversity controls X X
Out-of-state college controls X X
R2 0.06 0.06
in the years of postsecondary schooling. Using a 5 percent sample from the 1980 Census, we show that this variation increased migration rates substantially among affected cohorts. It also significantly increased the probability that a young man completed some postsecondary education. When we use induction risk to identify the causal effect of higher education on subsequent migration, we find that a college education significantly increases the probability of a long-distance move. Specifi-cally, our 2SLS estimates indicate that an additional year of college increases the probability of living outside one’s birth state by 0.03 to 0.09 percentage points, which is a broad range representing 10 to 25 percent of the average probability of 0.36 in this variable for men in our sample. Though these estimates are not signifi-cantly different from our OLS estimates, they suggest that selection is unlikely to explain the large increases in migration rates associated with a college education.
What mechanisms might explain the relationship between college and migration? Our preliminary investigation of this question appears to rule out a large role for two major features of the college experience: the probability of attending college at a distance from home and the geographic diversity of one’s peer students. Instead, other mechanisms may be more important in explaining why college education has the observed effect on mobility. These include either direct mechanisms, such as general cognitive skills acquired while in college, or indirect channels, such as entry into a more geographically integrated labor market for college-acquired skills and degrees. While these conclusions are tentative, we nevertheless believe they are a helpful step in understanding the nature of the relationship between higher education and migration. Future research should investigate the contributions of various mech-anisms to the greater mobility observed among the college educated.
These findings also have important implications for the broader literature on re-turns to education. Viewing migration as an individual response to labor market disequilibria, the causal link between education and migration suggests that educa-tion may confer, in addieduca-tion to other skills, the ability to deal with disequilibrium. As shown by Wozniak (2010) and Bound and Holzer (2000), migration can have a direct impact on individual earnings by allowing individuals to migrate in response to negative economic shocks, and that highly educated workers are more likely to make such moves. Indeed, we also observe these patterns for our sample of men from the Vietnam generation.38 Consequently, our evidence does suggest that mi-gration is an important return to a college education.
Appendix Figure A1
The
Journal
of
Human
Resources
Appendix Table A1
OLS and 2SLS Estimates for the Impact of College Attendance and Completion on Migration
Dependent variable: living outside state of birth (mean = 0.358)
Panel A: College Attendance
OLS 2SLS with National Risk
2SLS with National and State-Level Risk
(1) (2) (3) (4) (5) (6) (7) (8) (9)
Attendance 0.060** 0.140*** 0.144*** 0.125*** 0.200*** 0.201*** 0.417 0.357* 0.544*
[0.023] [0.021] [0.024] [0.048] [0.044] [0.044] [0.255] [0.206] [0.280]
Trend X X X X X X X X X
Demographic controls
X X X X X X X X X
Cohort size X X X X X X
Employment rate X X X X X X
Birth region trends X X X