J.Food Pharm.Sci. 2 (2014): 27-31
Avalaible online at www. jfoodpharmsci.com
Research Article
Differentiation of Lard from Other Edible Fats by Gas
Chromatography-Flame Ionisation Detector (GC-FID) and Chemometrics
Omar Dahimi
1, Mohd. Sukri Hassan
1, Alina Abdul Rahim
1*, Sabo Mohammed Abdulkarim
2, and
Siti Mashitoh A.
11Institute of Halal Research and Management (IHRAM), Universiti Sains Islam Malaysia, 71800, Nilai, Negeri Sembilan,
Malaysia
2Faculty of Food Science and Technology, Universiti Putra Malaysia, 43400 Serdang, Selangor, Malaysia.
ARTICLE INFO ABSTRACT
Received 05 December 2012 Revised form 27 December 2012 Accepted 02 January 2013 Available online 12 May 2013
1. Introduction
Edible fats and oils are complex mixtures containing a wide range of compounds. They are principally composed of free fatty acids (FFAs), diacylglycerols (DGs), triacylglycerols (TAGs), phospholipids, and other minor components. (Janssen et al., 2003). ). Since a long time, the trade of fats and oils has been facing a serious adulteration problem, which is usually motivated in a bid for maximizing profit by replacing an expensive ingredient with cheaper ones (Cserháti, et al., 2005); and
versatile in providing the functional properties of the product. Lard in its original or its industrially modified fats might be mixed with other animals or vegetable oils to produce shortenings, margarines and other food oils and its detection as an adulterant in food systems is a major concern for many countries due to religious prohibitions and health reasons (Marikkar et al., 2005). Therefore, the detection of lard in foods is a major concern for many countries due to religious prohibitions and health reasons. The presence of lard in food is a serious issue for some religions like Islam and Judaism The presence of lard or its derivatives in any food products is a serious religious issue among Muslim and Judaism. Thus, the objective of this study was to investigate the use of gas chromatography with flame ionisation detector (GC-FID) coupled with chemometrics techniques such as Principle Components Analysis (PCA) and K-mean cluster analysis to differentiate lard adulteration at very low concentrations in beef and chicken fats. The measurements were made from the pure lard, beef tallow, pure chicken fat; and beef tallow (BT), chicken fat (CF) adulterated with different concentrations of lard (0.5%-10% in BT and CF). The data were first scaled into standardisation before PCA is performed to each of the scaled data using Unscrambler software. The Scores plots and loadings plots of each scaled data were compared and studied. The results showed that lard contains higher fatty acid (FA) of C18: 2cis and low C16:0 FA, but oppositely for beef tallow and chicken fat. The amount of C4:0, C14:0, and C18:0 FAs are approximately similar for all fats. Others FAs are small in amount and nearly similar for both. Additionally, PCA was able to significantly identify lard, beef fat, chicken fat and the mixtures of lard and beef tallow, lard and chicken fat, even at lower concentration level (0.5 % lard-99.5% beef tallow / chicken fat (w/w). K-mean cluster only able to classify the pure lard (LD), pure chicken fat (CF) and pure beef tallow (BT)
Keywords: adulteration, lard, beef tallow, chicken fat, GC-FID, chemometrics
where consuming any foods containing porcine and its derivatives is forbidden even at trace level Regenstein et al. (2003). However, detection of lard when it exists as a minor component in other oils and fats, is difficult. Hence, there is a great need for robust and trustworthy techniques for lard differentiation and detection for the practice of Halal authentication analysis by the relevant Halal authorities. The use of gas chromatography coupled with chemometrics may provide a solution to this low concentration detection problem.
Haswell (1992) has defined chemometrics as the combination of mathematical, statistical, and other logic-based methods for managing and interpreting efficiently the chemically-derived data. Principal components analysis (PCA) is an unsupervised pattern recognition technique used in multivariate analysis (Yaakob B. Che Man et al, 2011). It projects the original data to reduced dimensions in matrices called scores and loadings. Shin et al. (2010) has reported that PCA is a method of identifying patterns in data and expressing the data in such a way as to emphasize their similarities and differences. The authors also reported that PCA can designate interactions between groups of variables in a data set and show relationships that might exist between objects. PCA has been successfully used to define relationships that exist in fatty acid classification studies of food lipids, due to the capability to manage and interpret large data sets (Kadegowda et al, 2008; Matos et al, 2007). K-mean cluster analysis (CA) is calculated based on Euclidean distance from the object of each cluster to its centre by which pre-determined the number of cluster is K (Jianyong Chen and Changsheng Zhang, 2011). The object belongs to its cluster when the distance is near to the centre compared with others centers. CA has an advantage over PCA where CA information is more objective and provides numerical results. In addition, CA is able to reduce dimensionality, while retaining the required information (Che Man et al, 2011).
Thus, the objective of this study was to investigate the use of gas chromatography-flame ionization detector coupled with chemometrics techniques, as a means for distinguishing lard adulteration in very low concentrations from other animal fats such as beef tallow and chicken fats.
2. Materials and Methods 2.1. Materials
Adipose tissues of pig (lard), chicken and beef were obtained from different local supermarkets. The analytical solvents used for fats extraction and GC analysis were: methanol 99.9 % (analytical, GC grade); acetone 99.9% (analytical, GC grade); n-hexane 99.0% (analytical, GC grade), chloroform 99.8% (analytical grade) and sodium methoxide 1% solution. All mentioned solvents were from Sigma- Aldrich, UAS.
2.2. Standards
The 37 Component FAME Mix from Supelco, Sigma– Aldrich, USA was used to identify the fatty acid composition of the pure and adulterated samples.
2.3. Samples preparation
The fats were extracted according to the Bligh-Dyer method (1959). Accurately, 300 to 400 mg of sample was weighed; then, 4 ml methanol, 2 ml chloroform and 0.4 ml water were added; homogenized and vortexed for 30 sec. After that, 2 ml of chloroform and 2 ml of water were added; vortexed for 30 sec and centrifuged at 3300 × g for 15 min, at 5° to 25°C. Using a Pasteur pipette the upper layer (methanol/water) was then removed, and the lower layer (methanol/chloroform) was transferred into a clear tube. Finally, the solvents were removed using a rotary evaporator under reduced pressure, at 40°C.
The extracted animal fat, lard, beef fat (BF), chicken fat (CF) and a series of 14 samples containing (0.5 - 10 % w/w) of lard in BF, and CF where analyzed. Samples containing lard were assigned as adulterated; while pure beef fat, pure chicken fat and pure lard were marked conversion of the oil to fatty acid methyl esters (FAME) according to the method of Cocks and Van Rede (1966) with a slight modification. FAME was prepared by adding 950 µl of n-hexane into 50 mg of fat, followed by 50 µl of sodium methoxide. The mixtures were vortex for 5 sec and allowed to settle for 30–60 min. The top layer (1 µl) was injected into a gas chromatograph (Agilent 7890 ) equipped with a flame-ionization detector and a polar capillary column (HP88-Agilent Technologies, USA), 100 m, 0.25mm, and 0.25 µm film, internal diameter and film thickness, respectively, to obtain individual peaks of FAME. The temperature of the column was 90 ºC, programmed to increase to 220 ºC at 15 ºC /min (for 5 min), 2 ºC /min and 15 ºC /min (for 1 min). The temperature of the injector and detector was maintained at 240 ºC. The run time was 40min. The FAME peaks were identified by comparing their retention time with certified reference standards of FAME (Supelco, Sigma–Aldrich, USA). Percentage relative of fatty acid was calculate based on the peak area of a fatty acid species to the total peak area of all the fatty acids in the oil samples.
2.5. Chemometrics Software
The percentage of FAME of all samples was transformed to a multivariates data set. Then, the data was standardized using Microsoft Excel software 2007. Principal component analysis (PCA) and K-mean cluster were performed by using an Unscrambler software (X10).
3. Results and Discussion
3.1. Fatty Acid Methyl Esters (FAME)
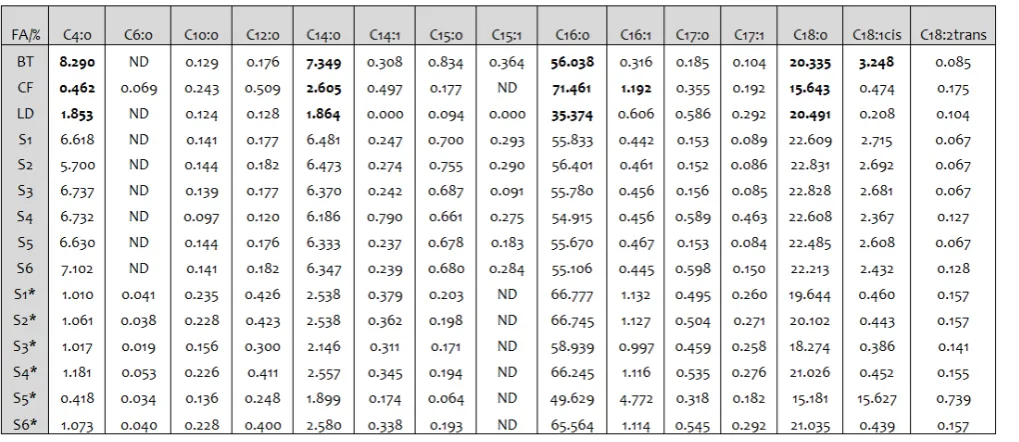
Table 1 shows the fatty acid compositions of lipid extracts from beef, lard and their mixtures. Butyric acid (C4:0) ranged from 8.29% to 1.85%; Capric acid (C10:0) 0.129% to 0.12%; Lauric acid (C12:0), 0.175% to 0.12%; Myristic acid (C14:0), 7.34% to 1.86%; (C14:1), 0% to 0.30%; Pentadecanoic (C15:0), 0.09% to 0.83%; Palmitic acid (C16:0), 35.37% to 56.03%; Palmitoleic Acid (C16:1), 0.31% to 0.60%; Margaric acid (C17:0), 0.18% to 0.58%; Stearic acid (C18:0), 20.33% to 20.49% ; Oleic acid (C18:1cis), 0.20% to 3.24%; Linoleic Acid (C18:2trans),
0.10% to 0.08%; Linoleic acid (C18:2cis), 0.64% to 31.9%; linoleic acid (C18:2, n6), 2.85% to 33.92%; Alpha-linolenic acid (C18:3n3), 0.24% to 1.46%; Arachidic acid (C20:0), 0.87% to 2.18%; Eicosenoic acid (C20:1n9), 0.82% to 1.46%; Dihomo-gamma-linolenic acid (C20:3n6), 0% to 0.17%; Erucic acid (C22:1n9), 0% to 0.39%; Nervonic acid (C24:1), 0% to 0.15%; Docosahexaenoic acid (C22:6), 0% to 0.25%; Arachidonic acid (C20:4n6), 0% to 0.23%; Eicosadienoic acid (C20:2), 0.1% to 1.48%. These results correspond with those from other studies (Enser et al., 1996).
3.2. Principal component analysis (PCA)
In this study, the multivariates data matrix of 30 FAME (i.e., the 30 FAME in BF, LA, and CF as well as their mixtures) was subjected to PCA in order to reduce the number of descriptors associated with the data set without losing the information of the original data. Scores and loadings matrices were generated using 7 principal components (PCs). An eigenvalue of about 98% was achieved using seven PCs where PC1 accounted for 1% of the variation, while PC2 described 97% of the
variation; therefore, the remaining five ≤ % total did
not explain significant variability in the data.
Figure 1 demonstrates the scores plot of PCA of 30 fatty acids methyl esters (FAME) representing the projection of samples defined by the first (PC1) and second (PC2) components. It explains the variation characteristics of the FAME’s in the samples; there are some fatty acids are significantly different which medium chain and polyunsaturated fatty acids. These fatty acids are distributed in the upper left region in the figure for example C15:1, oleic acid (C18:1cis), and linoleic acid (C18:2cis) specifically in lard. This may be due to the unchanging of this fatty acids inside pig stomach; oppositely to the ruminants with several stomachs have microbes that change fatty acids structure into saturated
fats. Therefore, they can pass into the blood stream in the small intestine, and from there into tissues (Teye et al., 2006a; Teye, Wood, Whittington, Stewart, & Sheard, 2006b). In addition, the Figure 1 shows that there are some saturated fatty acids with significant presence and they located in the lower left region in the figure, for instance: butyric acid (C4:0), myristic acid (C14:0), and stearic acid (C18:0). Furthermore, Figure 1 illustrates that palmitic acid (C16:0) which is sited on the right region and far from others acids. This means that it is significantly higher from other fatty acids and this especially in BT; and that may be due to the microbial biohydrogenation of fatty acids inside the ruminants stomach; where the fatty acids are changed from poly and mono-unsaturated to saturated fatty acids ( J. D. Wood et al.,2008).
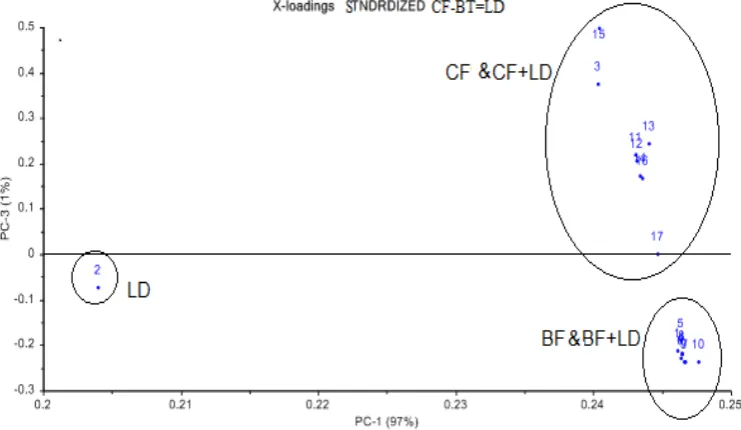
Figure 2 shows the loading plot for the different concentrations of the samples (BT+ L, and CF+L) as well as the pure samples BT, CF and LA. The PCA loading plot describes the different distribution of variables (concentrations) in two main groups. The first group (1, 4, 5, 6, 7, 8, 9, and 10) which refers to BT and BT+LD; and it was located under the X-axis. The second group (3, 11, 12, 13, 14, 15, 16, and 17) refers to CF and CF+LD; and it is located up of X-axis. However, for the sample 2, which
26
refers to lard sample, is very isolated from the other two groups. This grouping of samples is maybe because of the differentiation in their physic - chemical
characteristics. Therefore, Figure 2 helps to differentiate BT and CF from LA, and it aids to distinguish very low adulterated concentration (0.5%) of lard in BT and CF.
Fig 1. The scores plot for the first two principal components (PC) for 30 FAME from the samples studied
Fig 2. Principal component analysis (PCA) loadings plot of PC1 versus PC2 showing the pure and the adulterated samples, where: 1 refers to beef tallow ( BT); 2 lard (LD); 3 chicken fat (CF); 4 BT+0.5 % LD; 5 BT+1 %LD; 6 BT+2 %LD; 7 BT+3 %LD; 8 BT+4 %LD; 9 BT+5 %LD; 10 BT+10 %LD; 11 CF+0.5 %LD; 12 CF+1 %LD; 13 CF+2 %LD; 14 CF+3%LD; 15 CF+4%LD; 16 CF+ 5% LD and 17 CF+ 10 % LD.
3.3. Cluster analysis
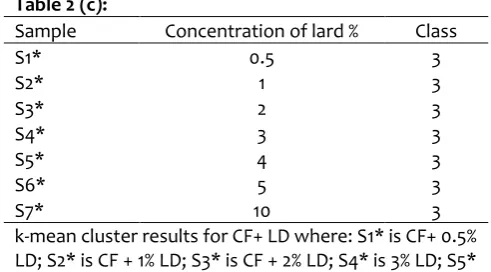
The original data set (Table 2), X (17, 30) consisted of 30 variables measured in 17 samples (3 samples are pure animal fats: BT, LD and CF and other 14 are BT+LD, CF+LD respectively), where each entry matrix was an average value of three replications. The data was standardized prior to the analysis, and then they were subjected to cluster analysis (CA). The K-mean cluster analysis results are given in (Table 2 (a), (b) and (c)) that grouped all samples into three different classes class 1
Table 2 (a):
Sample Concentration of lard % Class
LD 100 1
BT 0 2
CF 0 3
k-mean cluster results for the pure samples BT is pure beef tallow; CF is pure chicken fat and LD is pure lard
Table 2 (b):
Sample Concentration of lard % Class
S1 0.5 2
Sample Concentration of lard % Class
S1* 0.5 3
k-mean cluster results for CF+ LD where: S1* is CF+ 0.5% LD; S2* is CF + 1% LD; S3* is CF + 2% LD; S4* is 3% LD; S5* is CF + 4 % LD; S6* is CF + 5% LD and S7* is CF + 10% LD
4. Conclusion
GC-FID combined with the chemometric technique such as PCA and K-mean cluster can be employed to differentiate lard from beef tallow and chicken fat. PCA has showed the ability of detection of lard within the mixtures of beef tallow- lard and chicken fat-lard as low as 0.5 % of lard. Meanwhile, K-mean cluster was only able to differentiate between pure beef tallow, pure chicken fat and pure lard. In future continuation from this study will look into more replications to elaborate more information about k-mean cluster analysis in intention of detection of lard in food matrix in very small possible Lard From Other Edible Fats and Oils by Means of Fourier Transform Infrared Spectroscopy and Chemometrics. J. Am Oil. Chem. Soc. 2011, 88, 187–192.
Cock S.I. and V. Van Rede. Laboratory Handbook for oil and fat analysis. Academic Press, Inc Ltd.London and New York. 1966.
Cserháti, T., Forgács, E., Deyl, Z., & Miksik, I. Chromatography in authenticity and trace ability tests of vegetable oils and dairy products: A review Biomed. Chromatogr. 2005, 19, 183–190.
Enser, M., Hallett, K., Hewitt, B., Fursey, G. A. J., & Wood, J. D. Fatty acid content and composition of English beef, lamb and pork at retail. Meat Sci. 1996, 42, 443–456.
Eui-Cheol Shin, Brian D. Craft, Ronald B. Pegg, R. Dixon Phillips, Ronald R. Eitenmiller. Chemometric approach to fatty acid profiles in Runner-type peanut cultivars by principal component analysis (PCA). Food. Chem. 2010, 119, 1262– 1270.
Hans-Gerd Janssen, Wibo Boers, Herrald Steenbergen, Roos Horsten, Eckhard Floter. Comprehensive two-dimensional liquid chromatography × gas chromatography: evaluation of the applicability for the analysis of edible oils and fats. J. Chromatogr. A. 2003, 988, 117–132.
Haswell, S. J. Introduction to chemometrics. In Practical guide to chemometrics. New York: Marcel Dekker Inc, USA, 1992, pp. 1–3.
Jianyong Chen and Changsheng Zhang , Efficient Clustering Method Based on Rough Set and Genetic Algorithm, component and multivariate analysis of milk long-chain fatty acid composition during dietinduced milk fat depression. J. Dairy Sci. 2008, 91, 749–759.
Marikkar, J.M.N., Ghazali, H.M., Che Man, Y.B., Peiris,T.S.G. and Lai, O.M. Distinguishing lard from other animal fats in admixtures of some vegetable oils using liquid chromatographic data coupled with multivariate data analysis. Food. Chem. 2005, 91, 5–14.
Matos, L. C., Cunha, S. C., Amaral, J. S., Pereira, J. A., Andrade, P. B., Seabra, R. M. Chemometric characterization of three varietal olive oils (Cvs. Cobrancosa, Madural and Verdeal Transmontana) extracted from olives with different maturation indices. Food. Chem. 2007, 102, 406– 414.
Regenstein, J. M., Chaudry, M. M. and Regenstein, C. E. The kosher and halal food laws. Comprehensive Reviews in Food Science and Food Safety 2. 2003, 111–127.
Teye, G. A., Sheard, P. R., Whittington, F. M., Nute, G. R.,
Stewart, A.,& Wood, J. D. )nfluence of dietary oils and protein level on pork quality. . Effects on muscle fatty
acid composition, carcass, meat and eating quality. Meat Sci. 2006a, 73, 157–165.
Teye, G. A., Wood, J. D., Whittington, F. M., Stewart, A., &
Sheard, P. R. . )nfluence of dietary oils and protein level on pork quality. . Effects on properties of fat and
processing characteristics of bacon and frankfurter-style sausages. Meat Sci. 2006b, 73, 166–177.