J.Food Pharm.Sci. 2 (2014): 23-26
Avalaible online at www. jfoodpharmsci.com
Full Article
Analytical Method Validation of Selected Organochlorine Pesticides in
Fortified Rice Using Gas Chromatography with Electron Capture Detector
Mutia Kusuma Wardani
1,2, Bambang Sutriyanto
1,3, Endang Lukitaningsih
2,3, and Abdul Rohman
1,2,3*1Integrated Research and Testing Laboratory, Gadjah Mada University, Yogyakarta, 55281, Indonesia.
2Department of Pharmaceutical Chemistry, Faculty of Pharmacy, Gadjah Mada University, Yogyakarta, 55281, Indonesia. 3Research Center of Halal Products, Gadjah Mada University, Yogyakarta, 55281, Indonesia.
ARTICLE INFO
ABSTRACT
Received 02 December 2012 Revised 03 February 2013 Accepted 03 February 2013 Available online 12 May 2013
1. Introduction
Currently, Indonesian is one of the countries consuming rice as its food staple. Rice is one of the important human diets as carbohydrate source obtained from the paddy (Oryza sativa L). In order to increase the productivity of paddy, the farmers used pesticides. Pesticides are chemical compounds, which are frequently used in modern agriculture practices to keep the crops from different pests and diseases (Guler et al., 2010).
The use of pesticides is important in modern agriculture in order to eliminate the disease as well as to enhance the productivity of paddy (Juraske et al., 2009); however, the application of pesticides in paddy can lead to some drawbacks in the form of pesticide residues remaining in paddy and of course in rice. This can cause the human health risks who consumed rice (Nia et al., 2009), consequently rice containing pesticide residue
can be potential problem (Radwan and Salama, 2006). Therefore, pesticides should be controlled at optimum level due to their relative toxicity to the human health and the environment (Jiang et al., 2009).
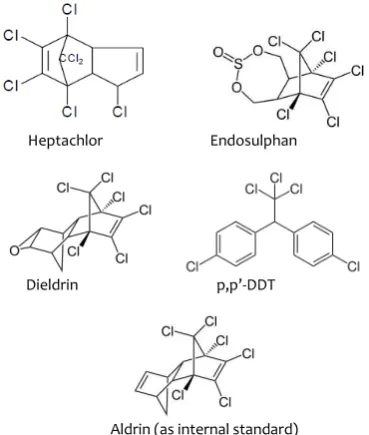
In this study, we selected four organochlorine pesticides namely heptachlor, endosulfan, dieldrin, dan p,p’-DDT. The chemical structures of these pesticides were shown in Figure 1. Heptachlor is chlorinated dicyclopentadiene pesticide (Fig. 1) which is persistent in environment and can accumulate in food chain. Since ’s, this pesticide has been banned to be used in agriculture, however, heptachlor is still detected in some food commodities (Kielhorn et al., 2006). Endosulfan is used as an insecticide and acaricide. This compound has a highly controversial agrichemical due to its acute toxicity, potential for bioaccumulation, and its role as an endocrine disruptor (Latif et al., 2011). Furthermore, in some countries, dieldrin and p,p’-DDT are restricted to be used in agriculture field (Ritter et al., 1995).
Gas chromatography with electron capture detector (GC-ECD) has been validated for simultaneous determination of selected organochlorine pesticides namely heptachlor, endosulfan, dieldrin, dan p,p’- dichlorodiphenyltrichloroethane (p,p’-DDT) using aldrin as standard internal. Some parameters for analytical method validation were evaluated, i.e. linearity, precision, sensitivity expressed with limit of detection and limit of quantification, and recovery. GC-ECD was linear for determination of these pesticides with r values . . The values of LOD obtained were 2.50, 2.97, 1.61, and 2.54 ng/mL for heptachlor,
endosulphan, dieldrin, and p,p’-DDT, respectively. Furthermore, the relative standard
deviation (RSD) values obtained for the assessment of analytical precision were lower than those required by Horwitz. Finally, the used GC-ECD method was accurate for determination of these organochlorine psticides in fortified rice samples which were indicated by the acceptable recovery percentages.
Keywords: validation, organochlorine pesticides, gas chromatography, electron capture
detector, rice
*Corresponding author:
Heptachlor Endosulphan
Dieldrin p,p’-DDT
Aldrin (as internal standard)
Fig 1. The chemical structures of studied organochlorine pesticides
Several analytical methods have been published for determination of organochlorine pesticides in numerous food matrixes such as high performance liquid chromatography (Trajkovska et al., 2003; Vega-Moreno
et al., 2008), liquid chromatography tandem with mass
spectrometer known as LC-MS (Paííga et al., 2009), gas chromatography-mass spectrometry (Latif et al., 2011, Yang et al., 2011), gas chromatography using nitrogen-phosphorus detector (Athanasopoulos and Pappas, 2000; Albero et al., 2003; Lambropoulou and Albanis, 2002), flame photometric detector (Zabik et al. 2000; Simplicio and Boas, 1999), and electron capture detector (Abou-Arab, 1999; Cai et al., 2005). To our knowledge, there is no available reports related the use of GC in combination with electron capture detector for quantitative analysis of selected organochlorine pesticides. Therefore, in this study, we validated GC-ECD for such analysis and applied the validated method for quantitative analysis of selected organochlorine pesticides in fortified rice samples.
2. Materials and Methods
The organochlorine pesticides of heptachlor, endosulfan, dieldrin, and p,p’-DDT as well as internal standard of aldrin were bought from Aldrich, USA; activated carbon, toluene, 2-propanol and sodium sulphate anhydrate were purchased from E. Merck (Darmstat Germany). Celite 545 was obtained from Gasukuro Kogyo, Japan. The rice was obtained from local market in Yogyakarta, Indonesia.
2.2. Sample preparation
An approximately of 10,0 g rice sample was accurately weighed using analytical balance with sensitivity of 0.1 mg in Erlenmeyer. The sample was added with aldrin as internal standard, 20 mL toluene and 10 mL 2-propanol. The mixture was vigorously blended with ultra turrax for 5 min. The mixture obtained was allowed for 5 min to precipitate and subsequently filtered. The filtrate was extracted using 2 x 50 mL
Na2SO4 2 % b/v in water. The aqueous phase was removed and organic phase (toluene) was taken for clean up procedure.
2.2. Clean up
An approximately of 10.0 mL toluene phase was taken and introduced to closed-reaction. After that, 1 gram of adsorbent (celite 545 and active carbon (1:3, w/w)) was added into reaction tube. The mixture was vigorously shaken for 1 min and faltered using Whatman paper No. 1. The supernatant was directly injected (1 µL) to gas chromatograph.
2.3. GC condition
The GC condition was adopted from the previously reported by Anugrahwati (2010) using the same instrument, as below:
Column : Rtx-1301 (fused silica capillary
column) from Restex, Bellafante,
USA (30 m x 0.25 i.d; film thickness 0,25 µm). the column was maintained isothermally at 2300C
Carrier gas : Helium (1.7 mL/min) Make up gas : N2/ air
Detector : Electron capture detector (3000C) Injector temperature : 2700C
Injection volume : 1 µl
Detector : ECD (Electron Capture Detector) at 300 oC
2.4. Analytical method validation
Several analytical figure of merits was evaluated for determining validation criteria, namely linearity, precision, sensitivity expressed as limit of detection and limit of quantification, and accuracy (ICH, 1994).
3. Results and Discussion
Several pesticides have specific properties, namely low-polarity, stable toward thermal, and volatile compounds. Consequently, they can be analyzed using gas chromatography (GC). Moreover, the availability of selective and sensitive detectors has made GC the preferred method for quantitative analysis of pesticides. Electron capture detector (ECD) is the common detectors usually employed for the determination of organochlorine (halogen-containing) pesticides, caused by very good response for organocholrine pesticides (Tadeo et al., 2004). Under the optimized condition, the chromatogram obtained for four pesticide standards is shown in Figure 2. All organocholrine pesticides
(heptachlor, endosulphan, dieldrin, and p,p’-DDT) along
with internal standar of aldrin are well separated with good resolution.
In order to validate GC-ECD for simultaneous analysis of these pesticides, some analytical figure of merits namely linearity, precision, sensitivity, and accuracy were determined.
Figure 2. Chromatogram of standard pesticides. Heptaclor (0,02 ng/µL), tr = 3.886 min; aldrin (0,1 ng/µL); tr = 4.387 menit; endosulphan (1.0 ng/µL), tr = 6.243 min; dieldrin (0.02 ng/µL), tr = 7.180 min; and p,p’-DDT (0.10 ng/µL) tr = 10.399 min. Injection volume was set at 1.0 µL.
3.1. Linearity
A linear regression analysis was carried out by plotting the chromatographic response (chromatogram area) for each organochlorine pesticides (y-axis) versus the final concentrations of pesticides (x-axis). A set of 10 organoclorine standard solutions in toluene ranging in concentration from 0.005 to 0.08 ppm (heptachlor), 0.25 – 4.00 ppm (endosulphan), 0.005 – 0.08 (dieldrin), and 0.025 – .4 (p,p’-DDT) were analyzed in triplicate, and the chromatographic data were used to assess linearity. Regression analysis yielded a coefficient of correlation (r) of 0.9989. The r values together the regression equation obtained during the linearity assessment were compiled in Table 1. According to Eurachem (1998), the analytical response was linear over certain concentration ranges if r obtained is higher than 0.995. Therefore, it an be stated that the used method was linear for analysis of selected organochlorine pesticides at specified linear ranges.
Table 1. The regression equation for the relationship between chromatogram area (y-axis) and concentration of pesticides, in ppm (x-axis)
Pecticides Linear regression equation
Coefficient of correlation (r) Heptaklor y = 7.3825 x + 0.0499 0,9989 Endosulfan y = 1.4642 x + 1.5833 0,9923 Dieldrin y = 7.2959 x + 0.0298 0,9995 p,p’-DDT y = 3.6035 x + 0.0559 0,9981
3.2. Sensitivity
Sensitivity of GC with electron capture detector was evaluated by calculating the values of limit of detection (LOD) and limit of quantitation (LOQ). In order to calculate the values of LOD and LOQ, the peak area of ten blank rice samples were measured. LOD and LOQ were calculated as 3.3SD/b and 10SD/b respectively, where SD is the standard deviation of GC chromatogram area and b is the slope of calibration curve. When sample blank cannot produce any response, ten independent samples of rice was fortified at the lowest acceptable concentration of each pesticide (Gonzales and Herrador, 2007).The values of LOD obtained were 2.50, 2.97, 1.61, and 2.54 ng/mL for heptachlor, endosulphan, dieldrin, and p,p’-DDT, respectively; meanwhile the LOQ values
obtained are 8.30 (heptachlor), 9.89 (endosulphan), 5.30 (dieldrin) and 8.46 (p,p-DDT).
3.3. Precision
Precision of analytical method is generally evaluated by calculating relative standard deviation (RSD) or coefficient of variation (CV) of a set of data. Precision of GC method was checked to assess the reproducibility of instrument response to target of analyte. In order to assess the analytical method precision, measurements were done under conditions of repeatability. Repeatability was evaluated by measuring 10 blank rice samples spiked with 0.02 ppm (heptachlor), 1.0 ppm (endosulphan), 0.02 (dieldrin), and 0.01 ppm (p,p-DDT) under similar conditions (day, analyst, instrument, sample) (ICH, 1994). The RSD values obtained was 4.55, 4.69, 7.85, and 10.90 % for heptachlor, endosulphan, dieldrin, and p,p-DDT, respectively. According to Horwitz, as cited from Gonzalez and Herrador (2007), the maximum RSD value acceptable for the analyte level of 1 ppm is 16 % (Table 2). Therefore, it can be stated that the developed method exhibited a good precision.
Table 2. The criteria of acceptable RSD values as a function of analyte levels according to Horwitz (Gonzalez and Herrador, 2007)
Level of analyte Maximum RSD values
100 % 2.0
10 % 2.8
1 % 4.0
0,01 % 5.7
100 ppm 8.0
10 ppm 11.3
1 ppm 16.0
100 ppb 22.6
10 ppb 32.0
1 ppb 45.3
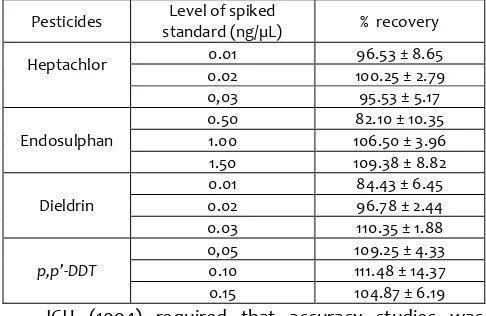
3.3 Accuracy
In this study, the accuracy of analytical method was assessed using standard addition method by calculating the recovery values for each pesticide. These studies were carried out to confirm the lack of analyte losses during sample preparation and matrix interferences during the measurement step (Eurachem, 1998).
Table 3. The recovery percentage of pesticide in fortified rice
Pesticides standard (ng/µL) Level of spiked % recovery
Heptachlor 0.01 96.53 ± 8.65
0.02 100.25 ± 2.79 0,03 95.53 ± 5.17
Endosulphan
0.50 82.10 ± 10.35 1.00 106.50 ± 3.96 1.50 109.38 ± 8.82
Dieldrin
0.01 84.43 ± 6.45
0.02 96.78 ± 2.44
0.03 110.35 ± 1.88
p,p’-DDT
standards, namely 80 %, 100 %, and 120 % from target of analytes. All analytical steps were performed in three replicates. The recovery percentage values for accuracy studies were shown in Table 3. According to Codex Alimientarius commission (2003), for the level of analyte of> ppm to . ppm, the recovery values should be in the range of 60 – 120 %. Therefore, the developed method was accurate for quantification of these pesticides in fortified rice.
4. Conclusion
Gas chromatography with electron capture detection has been successfully developed and validated for simultaneous analysis of four organochlorine pesticides namely heptachlor, endosulphan, dieldrin and p,p-DDT in fortified rice samples. Evaluation of analytical method parameters including linearity, sensitivity, precision and accuracy showed acceptable results. The developed method can also be used for separation and quantitative analysis of rice samples available in market.
5. Acknowledgement
The authors thank to Research and Testing Laboratory, Gadjah Mada University (LPPT-UGM) for financial support and facilities provided in conducting this study. The validation of analytical method is one of LPPT-UGM’s programs as accredited laboratory by ISO 17025-2005.
References
Abou-Arab, A. A. K. Behavior of pesticides in tomatoes during commercial and home preparation. Food Chem.1999, 65, 509 – 514.
Albero, B.; Sánchez-Brunete, C.; Tadeo, J. L. Determination of Organophosphorus Pesticides in Fruit Juices by Matrix Solid-Phase Dispersion and Gas Chromatography. J. Agric. Food Chem. 2003, 51, 6915 – 6921.
Anugrahwati, M. Validasi Metode Analisis Multiresidu Pestisida Organoklorin dalam Salak Menggunakan Kromatografi Gas Deetektor Penangkap Elektron, Skripsi, Universitas Gadjah Mada, Yogyakarta, 2010.
Athanasopoulos, P.E.; Pappas, C. Effect of fruit acidity and storage conditions on the rate of degradation of azinphos methyl on apples and lemons. Food Chem. 2000, 69, 69-72.
Cai, L. S.; Xing, J.; Dong, L.; Wu, C. Y. Application of polyphenylmethylsiloxane coated fiber for solid-phase microextraction combined with microwave-assisted extraction for the determination of organochlorine pesticides in Chinese teas. J.Chromatogr A. 2003, 1015, 11-21.
Che Man, Y. B.; Mirghani, M. E. S. Detection of lard mixed with body fats of chicken, lamb, and cow by fourier transform infrared spectroscopy. J. Am. Oil Chem. Soc.2001, 78, 753–
761.
Eurachem. The fitness for purpose of analytical method: A laboratory guide to method validation and related topics, 1998. Accessed from: http://www.eurachem.org/ guides/pdf/valid.pdf. 18/04/2011.
Gonzalez, A.G.; Herrador, M.A. A Practical Guide to Analytical Method Validation, Including Measurement Uncertainty and Accuracy Profiles. Trends Anal. Chem. 2007, 26(3), 227-238.
Guler, G.O.; Cakmak, Y.S.; Dagli, Z.; Aktumsek, A.; Ozparlak, H.; Organochlorine pesticide residues in wheat from Konya region, Turkey. Food Chem. Toxicol. 2010, 48, 1218–1221. International Conference on Harmonisation (ICH), Validation of
Analytical Procedures: Text and Methodology, 1994. Accessed from: http://www.ich.org/fileadmin/Public_Web _Site/ICH_Products/Guidelines/Quality/Q2_R1/Step4/Q2_R 1_Guideline.pdf., 19/04/2011.
Jiang, Y.F.; Wang, X.T.; Jia, Y.; Wang, F.; Wu, M.H.; Sheng, G.Y.; Fu, J.M. Occurrence, distribution and possible sources of organochlorine pesticides in agricultural oil of Shanghai,
China. J. Hazard. Mater. 2009, 170, 989–997.
Juraske, R.; Christopher, L.M.; Franziska, S.; Hellwega, S. Life cycle human toxicity assessment of pesticides: comparing fruit and vegetable diets in Switzerland and the United Microextraction Applied to the Analysis of Organophosphorus Insecticides in Strawberry and Cherry Juices. J. Agric. Food Chem.2002, 50, 3359 – 3365. Latif, Y.; Sherazi, S.T.H.; Bhanger, M.I. Assessment of pesticide
residues in commonly used vegetables in Hyderabad, Pakistan. Ecotoxicol. Environ. Saf. 2011, 74(8):2299-303 Nia, Y.; Xiao, W.; Kokot, S. Application of chemometrics
methods for the simultaneous kinetic spectrophotometric determination of aminocarb and carbaryl in vegetable and water samples. J. Hazard. Mater. 2009, 168, 1239–1245.
Paííga, P.; Morais, S.; Correia, M.; Alves, A.; Delerue-Matos, C. Screening of Carbamates and Ureas in Fresh and Processed Tomato Samples using Microwave-Assisted Extraction and Liquid Chromatography. Anal. Lett.2009, 42(2), 265-283.
Radwan, M.A.; Salama, A.K. Market basket survey for some heavy metals in Egyptian fruits and vegetables. Food Chem. Toxicol. 2006, 44, 1273–1278.
Ritter, L.; Solomon, K.R.; Forget, J.; Stemeroff, M.; and O’Leary,
C. Persistent organic pollutants, Assesment report, International Programme on Chemical safety (IPCS), Canada, 1995.
Simplicio, A. L.; Boas, L. V. Validation of a solid-phase microextraction method for the determination of organophosphorus pesticides in fruits and fruit juice J. ChromatogrA. 1999, 833, 35 – 42.
Tadeo, J.L.; Sáánchez-Brunete, C.; Albero, B.; Gonzáález, L. Analysis of Pesticide Residues in Juice and Beverages,
Crit. Rev. Anal. Chem. 2004, 34, 165-175.
Trajkovska, V.; Petrovska-Jovanovi, S.; Cvetkovski, M. Solid-Phase Extraction and HPLC/DAD for the Determination of Some Pesticides in Wine. Anal. Lett. 2003, 36(10), 2291-2302.
Vega-Moreno, D.; Sosa Ferrera, Z.; Rodrííguez, J.J.S. Analysis of Organochlorine Pesticides in Mollusc Samples by HPLC after Microwave Assisted Micellar Extraction Coupled with Solid Phase Extraction. J. Liq. Chromatogr. Rel.Tech. 2008, 31(6) 865-877.
Yang, X.; Wang, J.; Xu, D.C.; Qiu, J.W.; Ma, Y.; Cu, J. Simultaneous Determination of 69 Pesticide Residues in Coffee by Gas Chromatography–Mass Spectrometry.
Food Anal. Methods. 2011, 4, 186–195.