Full Terms & Conditions of access and use can be found at
http://www.tandfonline.com/action/journalInformation?journalCode=cbie20
Bulletin of Indonesian Economic Studies
ISSN: 0007-4918 (Print) 1472-7234 (Online) Journal homepage: http://www.tandfonline.com/loi/cbie20
Labour Market Adjustment to Indonesia's
Economic Crisis: Context, Trends and Implications
Chris Manning
To cite this article:
Chris Manning (2000) Labour Market Adjustment to Indonesia's Economic
Crisis: Context, Trends and Implications, Bulletin of Indonesian Economic Studies, 36:1,
105-136, DOI: 10.1080/00074910012331337803
To link to this article:
http://dx.doi.org/10.1080/00074910012331337803
Published online: 21 Aug 2006.
Submit your article to this journal
Article views: 225
View related articles
LABOUR MARKET ADJUSTMENT TO
INDONESIA’S ECONOMIC CRISIS:
CONTEXT, TRENDS AND IMPLICATIONS
Chris Manning*
Australian National University
This paper focuses on labour market adjustment during the economic crisis of 1997–98. It shows how labour processes help explain better outcomes for the poor than were initially predicted. The Indonesian experience is viewed in a framework that contrasts two extreme models: a Keynesian world of rigid real wages, and a neoclassical situation of flexible adjustment to economic shocks. It was found that the Indonesian case is more consistent with the neoclassical than the Keynesian model, despite the tendency for greater government intervention in labour markets before the crisis. The paper also finds that the large change in relative prices from the exchange rate depreciation had a smaller effect than expected on employment structure. These conclusions are discussed in the context of major changes in labour markets prior to the economic crisis.
INTRODUCTION
The social effects of the economic crisis have been a subject of considerable controversy. Early predictions suggested a catastrophic impact on the lives of ordinary Indonesians. Various estimates predicted that perhaps as many as 10–14 million people (out of a workforce of 90 million) would find themselves without jobs in 1998, and that poverty would spread to close to half the population (ILO 1998). Subsequent survey results have suggested a less serious effect. According to the most recent (July 1999) official estimates based on a subsample of the National Socio-economic Survey (Susenas), poverty incidence was 24% nationwide in December 1998; unemployment appeared to have risen only slightly (Booth 2000). While this estimate of poverty still signalled a 50% increase in the proportion of the population below the poverty line, it was far below early estimates of the impact of the crisis on the poor.1
In part, resolution of the ongoing debate about the impact of the crisis on poverty hinges on an understanding of how labour markets adapted to the sharp decline in national output.2 I focus on this largely neglected
aspect of the adjustment process in this paper. The paper also deals with the impact on employment structure of the large depreciation in the rupiah from August 1997. Here, the focus is on the extent to which the major change in relative prices resulted in movement of workers out of non-tradeables and into tradeable goods activities.
It is argued that outcomes depended partly on the evolution of labour market structures before the crisis. Thus, I devote some space in the paper to examining the impact of Indonesia’s growing economy on wages, and on the deployment of labour between traditional and modern sectors, during the Soeharto era. I conclude that labour markets remained highly flexible despite the rapid economic transformation. I suggest that this flexibility is a key explanation for why unemployment and the incidence of poverty did not rise more than they did during the crisis.
ANALYTICAL FRAMEWORK
One can represent potential labour market response to a sharp contraction in labour demand by suggesting two extreme cases. In one, the ‘Keynesian’ model, inflexible wages and employment structures lead to high levels of unemployment. Households whose economically active members lose their jobs bear the brunt of the adjustment. At the other extreme, in a neoclassical world, workers accept a sharp reduction in real wages, assist firms to get back on their feet and are highly mobile between sectors and regions. Some find alternative sources of work, albeit at lower levels of income, by crowding into informal sector activities. In the latter model, the effects of the crisis are borne by a much larger proportion of the population, but fewer people suffer a dramatic decline in living standards.
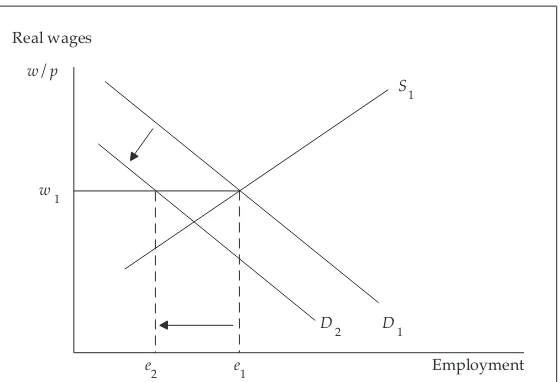
These effects are demonstrated in figures 1 and 2. Figure 1 illustrates the Keynesian case of inflexible wages and an absence of alternative employment opportunities. Real wages remain fixed at w1 despite the sharp cut-back in labour demand from D1 to D2 in the modern sector. Employment falls to e2 and unemployment rises to e1e2. Since there are limited opportunities for work in informal activities, very few of the
e2 w1
D
2 D1
S1
e1
Real wages
Employment
w/p
unemployed can be expected to find new jobs until modern sector output and employment expand.
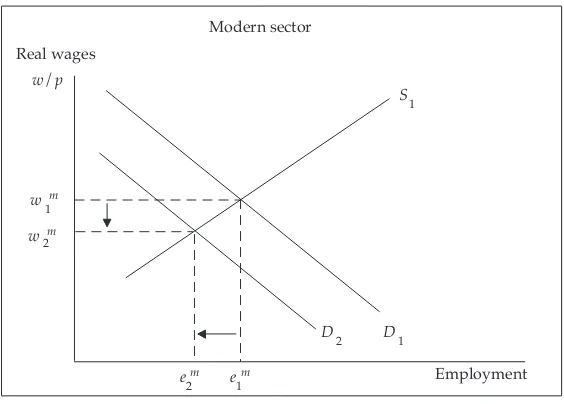
Figure 2 shows the process of adjustment in the neoclassical case, under conditions of dualistic labour markets. Modern sector wages adjust from w1m to w
2
m; employment contracts less than in the Keynesian case,
although it falls to e2m. But, in contrast to the Keynesian model, most of
the displaced workers are absorbed in informal sector activities, shown by the shift out of the labour supply curve from S1 to S2. Employment
sector, and there is little increase (or, in the extreme case, no increase) in overall unemployment.
The extent to which the Keynesian or the neoclassical response will predominate depends on two major sets of factors: the flexibility of real wages, and the availability of alternative employment opportunities for those who lose their jobs or join unemployment queues. A stylised version of ‘East Asian’ labour market adjustments to economic shocks in the early stages of development provides an example of the neoclassical adjustment process (Fields 1994; World Bank 1995a). Wages were closely tied to productivity and adjusted in response to fluctuations in labour demand. Piece-rate systems of pay, annual bonuses linked to firm performance, and flexible employment systems (which depended partly on contract and casual labour) supported quick adjustments of wage costs to macroeconomic adjustment in the modern sector. Opportunities for work in small-scale enterprises and the informal sector enabled workers to gain alternative jobs, albeit at lower levels of remuneration, as suggested in figure 2.
In contrast, another stylised portrayal, this time of the ‘Latin American’ case of labour market adaptation during structural adjustment, is closer to the predictions of the Keynesian model.3 A range of factors contributed
to substantial increases in unemployment during crisis and adjustment periods: relatively inflexible wages in the modern sector (because of minimum wage laws, wage indexation and strong labour unions), combined with some elements in the modern sector of the social security and unemployment benefits characteristic of advanced countries.
Modern sector
e 2
m w1m
D2 D1 S1
w2m
e 1
m
Real wages
Employment
w/p
Traditional sector
e2t Employment
w 1
t S2
D 1 S
1
w 2
t
e1t
Real wages
w/p
Chris
M
anning
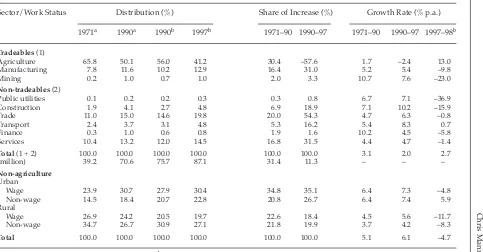
Sector/Work Status Distribution (%) Share of Increase (%) Growth Rate (% p.a.)
1971a 1990a 1990b 1997b 1971–90 1990–97 1971–90 1990–97 1997–98b
Tradeables (1)
Agriculture 65.8 50.1 56.0 41.2 30.4 –57.6 1.7 –2.4 13.0
Manufacturing 7.8 11.6 10.2 12.9 16.4 31.0 5.2 5.4 –9.8
Mining 0.2 1.0 0.7 1.0 2.0 3.3 10.7 7.6 –23.0
Non-tradeables (2)
Public utilities 0.1 0.2 0.2 0.3 0.3 0.8 6.7 7.1 –36.9
Construction 1.9 4.1 2.7 4.8 6.9 18.9 7.1 10.2 –15.9
Trade 11.0 15.0 14.6 19.8 20.0 54.3 4.7 6.3 –0.8
Transport 2.4 3.7 3.1 4.8 5.3 16.2 5.4 8.3 0.7
Finance 0.3 1.0 0.6 0.8 1.9 1.6 10.2 4.5 –5.8
Services 10.4 13.2 12.0 14.5 16.8 31.5 4.4 4.7 –1.4
Total (1 + 2) 100.0 100.0 100.0 100.0 100.0 100.0 3.1 2.0 2.7
(million) 39.2 70.6 75.7 87.1 31.4 11.3 – – –
Non-agriculture Urban
Wage 23.9 30.7 27.9 30.4 34.8 35.1 6.4 7.3 –4.8
Non-wage 14.5 18.4 20.7 22.8 20.8 26.7 6.4 7.4 5.9
Rural
Wage 26.9 24.2 20.5 19.7 22.6 18.4 4.5 5.6 –11.7
Non-wage 34.7 26.7 30.9 27.1 21.8 19.9 3.7 4.2 –8.3
Total 100.0 100.0 100.0 100.0 100.0 100.0 5.1 6.1 –4.7
aData from the 1971 and 1990 Population Censuses.bData from the 1990 and 1997 Sakernas.
declines in real wages and crowding into the urban informal sector, or into agriculture. Thus during adjustment episodes in Latin America in the 1980s, workers were generally unable to press for nominal wage rate adjustments to compensate for high rates of inflation, and hence real wages fell sharply in most countries.
Using this simple framework for analysing labour market adjustment, we examine processes of labour market change in Indonesia during the Soeharto era, before turning to the impact of the crisis. The discussion suggests that Indonesian labour market structures and policies were far more consistent with the neoclassical than the Keynesian model. However, there were signs of greater regulation and rigidity along Keynesian lines in the years immediately preceding the crisis.
LABOUR MARKET STRUCTURE AND CHANGE BEFORE
THE CRISIS
Labour market adjustment processes, set within an environment of highly elastic labour supply to the modern sector, provide a context for helping us to understand labour’s adaptation to the dramatic effects of the recession of 1997–98. We look first at how employment and wages changed in the years before the crisis, and especially during the decade of deregulation from the mid 1980s.4
The discussion starts with a brief look at developments in the 20-year period before deregulation. During this time, a combination of government support for agriculture, infrastructure and human resource development, and a protected manufacturing environment were the driving forces behind growth. This was supported by the good fortune offered by a boom in oil prices and government revenue in the 1970s.
• From the early 1970s through to 1990, agriculture absorbed the major share (over one-quarter) of all jobs (table 1). Labour continued to crowd into agriculture, even in densely populated Java, in part fuelled by quite high rates of population and labour force growth.5
Thus labour productivity remained low in this sector relative to other sectors, even though agricultural growth was not unimpressive by international standards.
transport and services—absorbed the bulk of new labour force entrants and workers from the large agricultural sector. This experience contrasts with that of, for example, Korea and Taiwan, where close to half of all jobs were created in labour-intensive manufacturing in the early stages of accelerated economic growth (Fields 1994).
• Although rural poverty declined substantially, real wages increased only slowly in traditional sectors, owing to a continuing elastic supply of unskilled labour. While real wages and labour incomes rose in non-agricultural sectors (especially during the oil boom period), poverty declined mainly as a consequence of industry shifts to higher-wage sectors, and more diversified sources of household income away from agriculture. Again the contrast with the NIEs is marked. In these countries, sustained rises in real wage rates among unskilled workers were a major factor contributing to rapid per capita income growth (Fields 1994).
• Labour markets were in general highly flexible in response to fluctuations in output. Aside from the ubiquitous informal sector, this has been attributed to a weak trade union movement, military intervention in labour disputes on the side of employers, and little government commitment to implementation of quite extensive labour protection legislation, even in the modern sector (Nayyar 1995; Hadiz 1997; Manning 1998). In addition, high levels of labour mobility, underpinned by improvements in communications, supported the labour supply response to changes in labour demand.6
Labour markets changed during the decade of deregulation (1986– 96) in several important ways.
• The agricultural sector was no longer providing a net increase in jobs
the export-oriented boom of the late 1980s and early 1990s. Incentives were increased for exporters, mainly through market-oriented reforms, but many parts of the economy remained highly regulated, and the process of economic reform slowed from around 1993.
• Real wages rose moderately, including among casual labourers in the large rice sector, which had experienced stagnant income
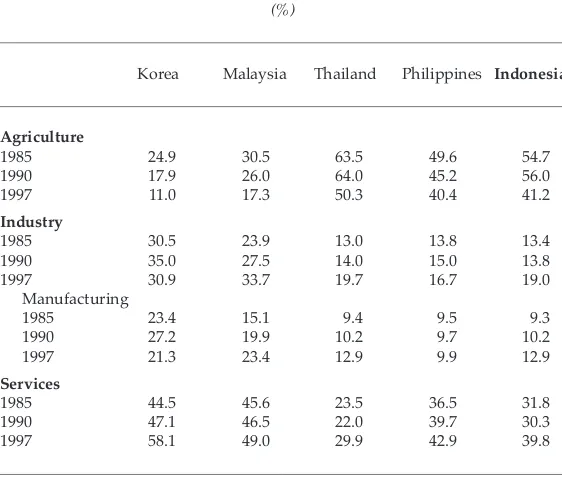
TABLE 2 Distribution of Employment by Major Sector, Selected East Asian Countries, 1985–97a
(%)
Korea Malaysia Thailand Philippines Indonesia
Agriculture
1985 24.9 30.5 63.5 49.6 54.7
1990 17.9 26.0 64.0 45.2 56.0
1997 11.0 17.3 50.3 40.4 41.2
Industry
1985 30.5 23.9 13.0 13.8 13.4
1990 35.0 27.5 14.0 15.0 13.8
1997 30.9 33.7 19.7 16.7 19.0
Manufacturing
1985 23.4 15.1 9.4 9.5 9.3
1990 27.2 19.9 10.2 9.7 10.2
1997 21.3 23.4 12.9 9.9 12.9
Services
1985 44.5 45.6 23.5 36.5 31.8
1990 47.1 46.5 22.0 39.7 30.3
1997 58.1 49.0 29.9 42.9 39.8
aData refer to population aged 15 and over in Korea and the Philippines; 15–64 years in Malaysia; 13 years and over in 1990 and 1997, 11 years and over in 1985 in Thailand; and 10 years and over in Indonesia. The data are based on annual or quarterly labour force surveys (August round in Thailand, October/4th round in the Philippines). Data for 1985 for Indonesia are taken from the National Intercensal Survey.
growth during the previous decade (Manning 1999a). Real wages rose rapidly in all non-agricultural sectors, by approximately 5–6% p.a. in agricultural manufacturing and services over the period 1990–97.7 On the eve of the crisis, labour markets had begun
to tighten. Indonesia no longer had the luxury of an elastic supply of unskilled labour to support a highly labour-intensive pattern of export-oriented growth.
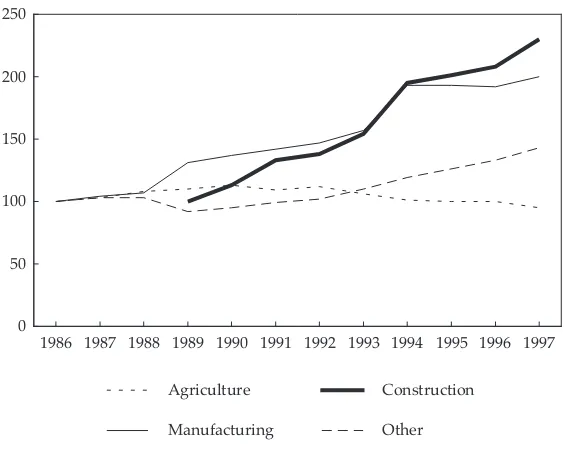
• Labour regulation spread in the modern sector in the 1990s. Minimum wages and social security for workers became an important plank of government policy. Labour protection was extended, at least in the modern sector. This was partly in response to labour unrest, and to middle-class and international criticism of labour controls and low wages in the new export-oriented industries (Manning 1998: ch. 8). Minimum wages rose by close to 100% in real terms over a five-year period, and social security was extended through the Law on Worker Social Security passed in 1992.8 Minimum 1986 1987 1988 1989 1990 1991 1992 1993 1994 1995 1996 1997 0
50 100 150 200 250
Agriculture
Manufacturing
Construction
Other FIGURE 3 Index of Employment by Major Sector, 1986–97
wage policy had introduced an element of rigidity into adjustments of output in the modern sector. Nevertheless, many small and medium enterprises remained largely unprotected, and casual employment contracts predominated in agriculture and construction.
In sum, the defining characteristic of labour market change before the economic crisis was the acceleration of employment away from low-productivity, largely agricultural, rural jobs. In this and other respects, Indonesia shared many of the labour force characteristics of middle and lower-income countries such as Thailand and the Philippines.
However, Indonesia’s employment structure differed in three important ways from those of more industrialised and higher-income countries in the region such as Taiwan, Korea or Malaysia (table 2). First, the share of employment in agriculture was 2–3 times higher than in the more industrialised East Asian countries. Second, the manufacturing sector, which accounted for around 13% of all jobs in 1997 (but one-third
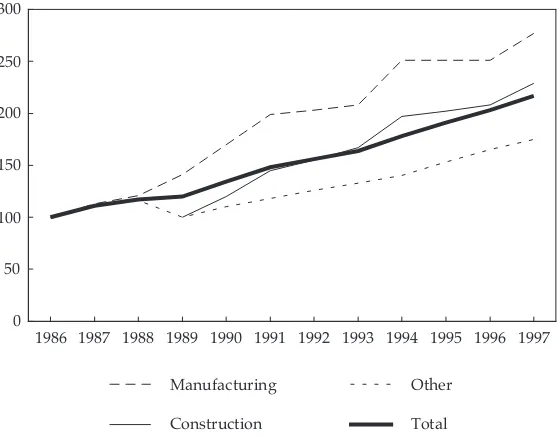
1986 1987 1988 1989 1990 1991 1992 1993 1994 1995 1996 1997 0
50 100 150 200 250 300
Manufacturing
Construction
Other
Total
FIGURE 4 Index of Employment Growth in Urban Areas by Sector, 1986–97
1986 1987 1988 1989 1990 1991 1992 1993 1994 1995 1996 1997 0
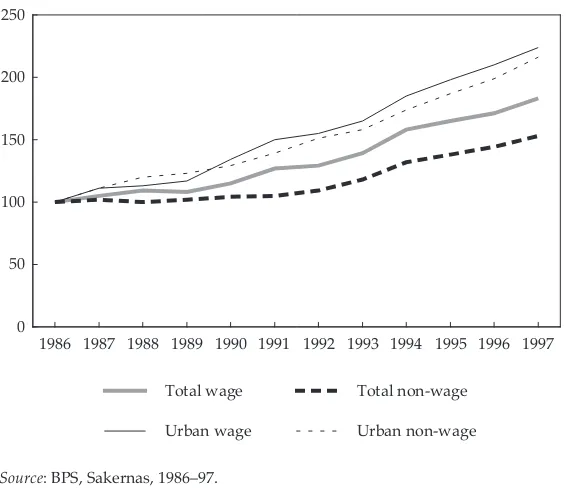
50 100 150 200 250
Total wage
Urban wage
Total non-wage
Urban non-wage
FIGURE 5 Index of Wage and Non-wage Employment by Sector, 1986–97
Source: BPS, Sakernas, 1986–97.
of GDP), still had a quite small share of total employment. Finally, wage employment accounted for only around 30% of all jobs, and half of all jobs outside agriculture, compared with closer to two-thirds of all employment in the NIEs (Manning 1999b).
IMPACT OF THE CRISIS
The context of economic crisis in Indonesia was the extraordinary, and largely unexpected, turnaround in economic performance starting in the last quarter of 1997, and extending through most of 1998 to produce a year-on-year fall in GDP of 14%.9 The well-documented sequence of major
shocks to output and incomes included the following.10
• A contraction in imports in response to the huge devaluation beginning with the float of the rupiah in August 1997. The shock was so large that it also negatively affected export-oriented manufacturing (much of it dependent on imported raw materials and associated credit arrangements), despite favourable movements in the exchange rate.
• The ‘credit crunch’ of late 1997 and a blow-out in the debt situation across the modern sector, bringing production to a halt in much of the modern sector.
• The subsequent period of loose monetary policy in 1998, fuelling much higher rates of inflation than Indonesia had experienced for nearly 30 years.
• The political and social chaos of May 1998, which brought imports and most modern-sector economic activity to a virtual halt, and severely disrupted domestic trade and transport for a period of several months. The economy did not begin to recover until the last quarter of 1998.
In Indonesia (and several other East Asian countries), relative prices changed dramatically between tradeable (exportable and importable) and non-tradeable activities, owing to the huge depreciation of the exchange rate. However, the Indonesian crisis differed in several important respects from similar crises in other countries: for example, the ‘tequila’ crisis in Mexico in 1994–95 and the earlier debt crisis in Latin America in the early 1980s. The ‘appropriate’ response to macroeconomic crisis in the typical Latin American case was a large devaluation accompanied by sharp cut-backs in government spending and money supply, resulting in a contraction of domestic economic activity (Williamson 1990). The key goal of structural adjustment was to shift resources into tradeable goods sectors, often a necessary correction to long periods of exchange rate overvaluation.
hence there was not a simple ‘IMF package’ remedy). The initial contagion exposed structural weaknesses, and financial markets (increasingly dominated by short-term capital flows) reacted swiftly and devastatingly. The shock was exacerbated by policy uncertainty, as the ageing president attempted to balance national economic interests with those of his family and to manage (for the first time quite unsuccessfully) an increasingly volatile political situation (Mietzner 1998).
Thus, although the crisis brought about a huge change in the relative prices of tradeable and non-tradeable goods, it had a rather different impact on production—and, as we shall see, on employment and wages— than in the more familiar case of structural adjustment in Latin America. Although the dimension of these changes is now well known, I will summarise the main effects that are relevant to the labour market story.
Tradeable Activities
In tradeable goods industries, three different effects were apparent. • Many export-oriented manufacturing activities, especially those
dependent on imports, did not benefit from the huge shift in relative prices. They were badly hit by the financial crisis and lack of international confidence in the rupiah, and by the political turmoil, as manifested in initial falls in output and subsequent slow growth through to mid 1999 (Pardede 1999).
• Import substitution producers that were not heavily indebted or import-dependent received a substantial boost. Many were typically small-scale traditional enterprises.
• Some agricultural producers with elastic short-run supply schedules responded positively to the crisis. This was most marked in the export-oriented cash crop sector. However, a positive response was also evident in the food crop sector, despite disruption to trade and transport during the worst months of the crisis in 1998.
Within the tradeable goods sector, manufacturing output fell by close to 13% after slowing considerably in 1997. Agricultural growth was positive but well below the trend in previous years (of just under 3% real growth in the first half of the 1990s). The volume of agricultural exports increased significantly but was supported by only a small rise in the volume of total non-agricultural exports.11 At the same time, the high
sauce), powdered milk, most medicines and basic plastic products— soared.
Finally, it is important to recognise that Indonesia faced two other sets of problems that affected output of tradeable goods, apart from private debt and the banking crisis. The first was structural. China in particular had made major inroads into the export markets of developing countries following the devaluation of its currency in 1994. This contributed to a fall in export growth in Indonesia in the mid 1990s, although not to the same extent as in Thailand and Korea (World Bank 1998). Second, agricultural production was adversely affected in 1997 by the El Niño drought, exacerbating the rise in food prices.
Non-tradeable Activities
In non-tradeable sectors, two main patterns were important.
• Specific non-tradeable service industries, primarily construction and real estate, were seriously disrupted in major cities by the dual impact of the debt crisis and credit crunch in the modern private sector.
• Owing to across-the-board disruption of production and investment during much of 1998, there was not the shift in resources out of non-tradeables and into tradeable goods industries (especially into manufacturing exports) that would normally be expected to accompany a large depreciation. The construction sector contracted most severely—by an astonishing 37% in 1998—bringing activity in the building and real estate sectors to a virtual halt in all major cities, and especially Jakarta. The value of output from the banking and finance, trade and transport sectors also declined steeply. Fortunately, growth rates in other services (including the public sector) fell only slightly and this helped cushion the effect of the substantial fall in output of other sectors.
THE CRISIS AND LABOUR MARKET ADJUSTMENT
Chris
M
anning
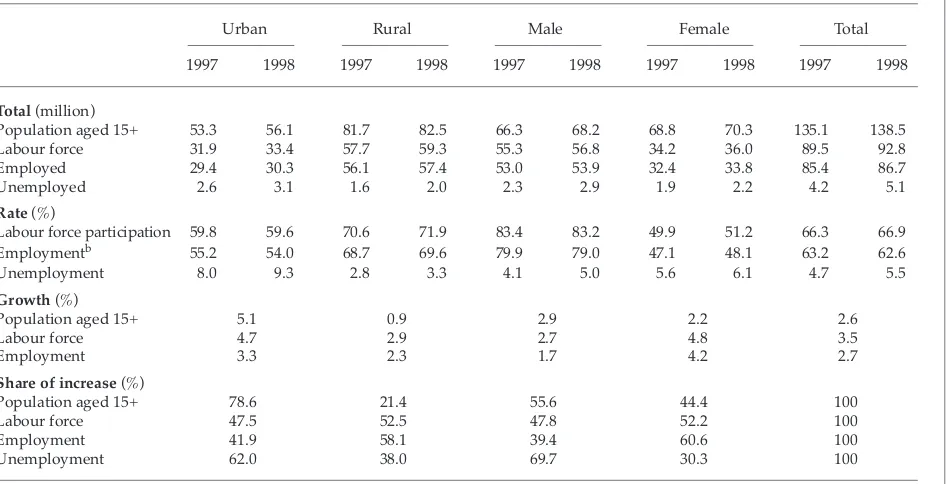
Urban Rural Male Female Total
1997 1998 1997 1998 1997 1998 1997 1998 1997 1998
Total (million)
Population aged 15+ 53.3 56.1 81.7 82.5 66.3 68.2 68.8 70.3 135.1 138.5 Labour force 31.9 33.4 57.7 59.3 55.3 56.8 34.2 36.0 89.5 92.8
Employed 29.4 30.3 56.1 57.4 53.0 53.9 32.4 33.8 85.4 86.7
Unemployed 2.6 3.1 1.6 2.0 2.3 2.9 1.9 2.2 4.2 5.1
Rate (%)
Labour force participation 59.8 59.6 70.6 71.9 83.4 83.2 49.9 51.2 66.3 66.9 Employmentb 55.2 54.0 68.7 69.6 79.9 79.0 47.1 48.1 63.2 62.6
Unemployment 8.0 9.3 2.8 3.3 4.1 5.0 5.6 6.1 4.7 5.5
Growth (%)
Population aged 15+ 5.1 0.9 2.9 2.2 2.6
Labour force 4.7 2.9 2.7 4.8 3.5
Employment 3.3 2.3 1.7 4.2 2.7
Share of increase (%)
Population aged 15+ 78.6 21.4 55.6 44.4 100
Labour force 47.5 52.5 47.8 52.2 100
Employment 41.9 58.1 39.4 60.6 100
Unemployment 62.0 38.0 69.7 30.3 100
analysis of employment change focuses on the findings of the Sakernas of August 1997, on the eve of the crisis, and that of August 1998.12
Labour Force Participation, Employment and Unemployment
Adjustments in labour supply were one important aspect of the response to the crisis. Total labour force participation increased slightly in 1998, suggesting that there was no net withdrawal from the workforce related to the contraction in demand for labour (table 3). Indeed, one response to the crisis was greater female involvement in the workforce, to supplement (or supply) the family income. Table 3 indicates a quite sharp rise in female participation rates in 1998, which occurred especially in rural areas. The increases were most apparent among older women living in rural areas.13
As we shall see below, many more women reported working in agriculture than in the previous year.
More surprisingly, employment growth rates appear to have risen, despite the displacement of large numbers of workers beginning in the last quarter of 1997 (see last column of table 4). Employment growth did fall sharply in urban areas, to 3.3% in 1997–98, compared with rates of close to 7% in 1990–96. But this was counterbalanced by an increase in participation and employment rates among women, especially in rural areas. A slowdown of growth in urban employment was to be expected, given the intensity of the impact of the crisis in Indonesia’s major cities. Nevertheless, urban employment continued to grow. There is no indication of the massive de-urbanisation and movement to the countryside that some commentators had predicted.14
As table 3 indicates, unemployment rose only slightly in 1997–98—to 5.5% in August 1998 from just under 5% a year earlier. As noted, earlier studies had predicted quite dramatic increases in unemployment based on employment elasticity calculations with respect to GDP growth by sector (ILO 1998). That this did not occur attests to the remarkable flexibility of Indonesian labour markets and the capacity of people to find new jobs after being retrenched from wage employment.15
Indonesian unemployment trends contrast markedly with those in several other crisis-affected countries in East Asia. For example, by the last quarter of 1998, unemployment in South Korea had more than tripled from 2.2% in 1997 to close to 8%; in Hong Kong, Malaysia and Thailand it more than doubled, from 2–2.5% in 1997 to 5–6% in 1998 (Manning 1999b).
Chris
M
anning
(%)
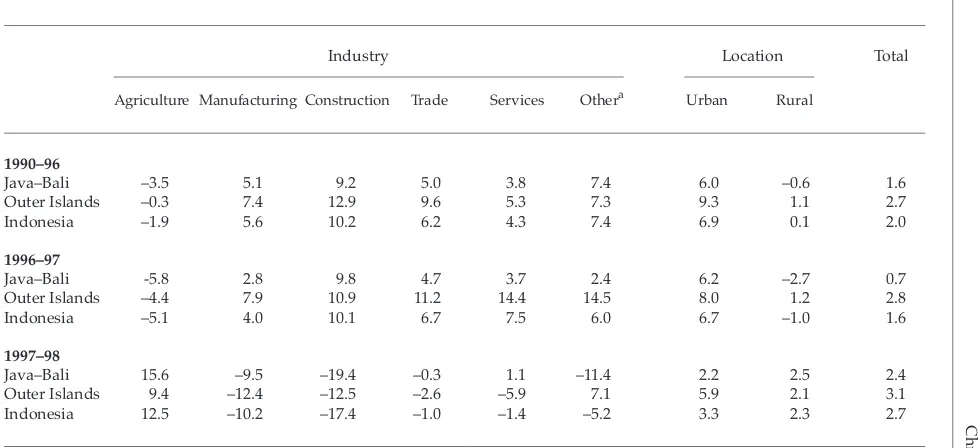
Industry Location Total
Agriculture Manufacturing Construction Trade Services Othera Urban Rural
1990–96
Java–Bali –3.5 5.1 9.2 5.0 3.8 7.4 6.0 –0.6 1.6
Outer Islands –0.3 7.4 12.9 9.6 5.3 7.3 9.3 1.1 2.7
Indonesia –1.9 5.6 10.2 6.2 4.3 7.4 6.9 0.1 2.0
1996–97
Java–Bali -5.8 2.8 9.8 4.7 3.7 2.4 6.2 –2.7 0.7
Outer Islands –4.4 7.9 10.9 11.2 14.4 14.5 8.0 1.2 2.8
Indonesia –5.1 4.0 10.1 6.7 7.5 6.0 6.7 –1.0 1.6
1997–98
Java–Bali 15.6 –9.5 –19.4 –0.3 1.1 –11.4 2.2 2.5 2.4
Outer Islands 9.4 –12.4 –12.5 –2.6 –5.9 7.1 5.9 2.1 3.1
Indonesia 12.5 –10.2 –17.4 –1.0 –1.4 –5.2 3.3 2.3 2.7
aIncludes banking and finance, transport and communications, electricity, gas and water, and mining.
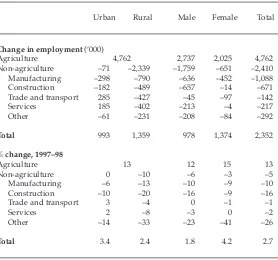
unemployed. As table 3 shows, male workers accounted for 70% of the increase in unemployment over the 12-month period.
At the same time, the unemployment pool now consisted of a much larger proportion of workers with previous job experience. In 1998, approximately 40% of all unemployed had worked previously, compared with only 20% in 1997. (The balance were first job-seekers.) The rise in the share of those who had worked before was particularly marked among younger males, in both urban and rural areas.
Employment Changes by Industry and Work Status
It was suggested earlier that crisis in Indonesia differed from the pattern commonly observed in other countries, where there has tended to be a large shift of resources into tradeable activities. This conclusion is supported by the data on employment. Although employment grew overall in tradeable goods industries in 1997–98, there was no clear-cut shift in jobs in favour of tradeables, as might have been expected following such a large exchange rate depreciation. Paradoxically in light of pre-crisis trends, the largest changes involved a reallocation of rural jobs into agriculture, from both other tradeable and non-tradeable industries.
The main trends are summarised in table 1 (above) and in tables 4–5.
Tradeable Activities. The most important development among tradeables was a dramatic increase in work in the agricultural sector. But while agriculture made significant gains, manufacturing employment contracted sharply among tradeable goods sectors, in both urban and rural areas (see table 1, last column, and table 5). The increases in agricultural work were large, and reversed the substantial fall in jobs experienced in this sector in 1990–96, especially in Java–Bali (table 4). The growth rate was high for both male and female workers, most of them self-employed and working in family businesses. Bearing in mind that agricultural production grew only slightly in 1998, output per worker probably fell by around 10% overall.
Although disaggregated data on employment are not available by agricultural subsector, it seems likely that many people crowded back into this sector, sharing work on small farms. Many who returned probably failed to find much work.16 Perhaps, too, many went back to
But not all agricultural producers suffered from the crisis. There was a significant rise in agricultural employment outside Java, in response to improved domestic prices for cash crop exports in certain provinces, such as South and North Sulawesi and Lampung (Potter 2000). Farmers who produced a marketable surplus—not just of rice, but also of corn in the poorer, rain-fed areas of Java and the Outer Islands, and of fish in the case of fishing families dotted along the north coast of Java—benefited from the sharp increases in food prices in 1998 (Maurer 1998). The ‘traditional’ free-range chicken industry and vegetable producers
TABLE 5 Change in Employment by Sector, Location and Sex, 1997–98a
Urban Rural Male Female Total
Change in employment (‘000)
Agriculture 4,762 2,737 2,025 4,762
Non-agriculture –71 –2,339 –1,759 –651 –2,410
Manufacturing –298 –790 –636 –452 –1,088
Construction –182 –489 –657 –14 –671
Trade and transport 285 –427 –45 –97 –142
Services 185 –402 –213 –4 –217
Other –61 –231 –208 –84 –292
Total 993 1,359 978 1,374 2,352
% change, 1997–98
Agriculture 13 12 15 13
Non-agriculture 0 –10 –6 –3 –5
Manufacturing –6 –13 –10 –9 –10
Construction –10 –20 –16 –9 –16
Trade and transport 3 –4 0 –1 –1
Services 2 –8 –3 0 –2
Other –14 –33 –23 –41 –26
Total 3.4 2.4 1.8 4.2 2.7
aData refer to population aged 10 and over.
cultivating house-gardens also received a boost from the high prices of imported substitutes and inputs.17
According to the Sakernas data, agricultural employment rose quite steeply in urban areas as well, possibly as a result of renewed cultivation of previously unused land (lahan kosong) controlled before the crisis by real estate companies and speculators (Tubagus 1999). This trend was particularly pronounced in the Outer Islands, where land was more abundant on the outskirts of urban areas than in Java–Bali.
In contrast to agriculture, manufacturing employment fell by a large margin in both Java–Bali and the Outer Islands (table 4).18 Within Java,
the declines were particularly marked in the major industrial centres of Jakarta, West Java and East Java, where the Sakernas data suggest manufacturing employment fell by close to 15%.
These aggregate changes undoubtedly hide important changes in the composition of manufacturing.19 The large changes in relative prices
opened up new opportunities in this sector. While the impact of the depreciation was felt most by cash producers outside Java, several clusters of small and medium industries in Java also benefited. They included producers of sarongs in Majalaya, West Java, and furniture producers in Jepara in Central Java. In other cases, imports were substituted with domestic production that was largely free of imported inputs. Anecdotal evidence suggests that many products that had once been part of the traditional Javanese economy began to be produced by rural people at a fraction of the cost of imported goods. These included bamboo mats and bags (replacing plastic) and processed food relying entirely on local food products.
Finally, there were important changes in employment by sex in the tradeable goods sectors. Employment of both males and females rose in agriculture, but the percentage increase was greater among females (table 5). In addition, many more males lost wage jobs in manufacturing. In general males, who tended to be more concentrated in modern sector jobs, were harder hit than females by the crisis, although women also lost a significant number of jobs in manufacturing.
Non-tradeable Activities. As would be expected, employment declined substantially in non-tradeables, in contrast to the overall expansion of employment in tradeables. However, as with tradeables, there was considerable variation within non-tradeable activities and a marked shift from wage to non-wage employment. The data point to an increasing informalisation of employment in non-tradeable activities.
(trishaws) and ojeg (private motor cycle transport services). By far the greatest decline—aside from the small utilities sector (electricity, gas and water)—was in construction in both urban and rural areas.20
There was, however, a marked contrast in employment trends between urban and rural areas in other non-tradeable goods and service industries. Whereas mainly informal, non-wage jobs rose in trade, transport and services in the towns and cities, employment in similar activities fell in rural areas (table 5). Some activities, such as petty trade, repair work and food stalls, absorbed more workers in towns and cities, but probably at lower levels of income. In these sectors, similar patterns were observed in Java–Bali and the Outer Islands.
Although some new activities have been important for the poor, their impact can be overstated given the substantial disruption caused to local trade and transport and the negative impact of inflation on living standards (see below). There is little doubt that Jellinek and Rustanto (1999: 2) overstate the impact of consumption switching and substitution in production on the incomes of the poor when they suggest that ‘we are witnessing an unprecedented economic boom in the small-scale sector’. The employment and wage data suggest that, in so far as employment grew in non-tradeable industries, this was mainly the result of crowding into the informal sector.
Displaced Workers
The data presented above do not help us to identify the impact of job losses during the crisis, since they refer to changes in the employment structure at two points in time. We can obtain a better glimpse of the direct impact of labour displacement from a 1998 Sakernas questionnaire on the current activities of people who left their jobs between August 1997 and August 1998. Although not all those who left jobs did so because of the crisis, a large percentage appear to have done so.21 We refer to this
group as ‘displaced workers’ for convenience.
The data support the general findings presented above on changes in the distribution of work by industry and work status. Table 6 presents data on the sector of employment in August 1998 of people who had left their jobs during the previous year. Two findings stand out.
TABLE 6 Main Activity in August 1998 of People Who Left Jobs during the Previous Year
(%)
Main Activity Male Female Total
Not working
Unemployed 25.6 24.8 25.4
Outside the labour force 13.0 43.7 23.5
Subtotal 38.6 68.5 48.9
Working 61.4 31.5 51.1
Total who left their jobs 100.0 100.0 100.0
(‘000) 2,808 1,471 4,279
Main sector of work of those finding new jobs
Agriculture 38.9 40.7 39.3
Manufacturing 10.7 17.5 12.1
Construction 11.7 1.5 9.5
Trade 17.3 26.1 19.2
Services 9.0 12.1 9.6
Other 12.5 2.2 10.3
Total finding new jobs 100.0 100.0 100.0
(‘000) 1,724 464 2,188
Of which:
Wage 36.6 30.0 35.2
Non-wage 63.4 70.0 64.8
Those finding new jobs as 3.2 1.4 2.5
% of total employed
Total employed (‘000) 53,969 33,077 87,046
Second, trade—typically the largest informal sector in urban areas— was the second most important sector of employment for displaced workers. Not surprisingly, the majority were self-employed, seemingly in activities such as small stalls and hawking. Around 20% of people who had previously worked in manufacturing and services found new jobs in trade.
We can infer that much of the labour displacement was from modern sector work by looking at the educational status of people who left jobs in the year to August 1998. While many less-educated persons lost their jobs, a disproportionate number of displaced workers—nearly one-third—were educated to at least upper secondary level, compared with only around 20% of all employed persons in 1997.22
As might be expected, not all those who left their jobs were able to find employment. One-quarter remained unemployed in 1998, and a high proportion of females (44%) were outside the workforce (table 6). Most of the women (some 300,000) who left the labour force had formerly been wage workers, although a significant proportion had previously managed their own enterprises or worked in family businesses.23 Thus there
appears to have been a significant number of ‘discouraged’ workers who left the labour force as a result of the crisis (although, as noted above, the number of women entering the labour force in 1998 far exceeded those who left, the net increase being just under two million).
Trends in Wages
As noted, average real wages grew strongly across all major sectors from 1990 through to the onset of the economic crisis. Wage growth was rapid across all sectors, both tradeable and non-tradeable, suggesting a general tightening of labour markets (table 7). However, real wage rates in rice agriculture—still the single most important employer of unskilled, casual labour—grew less quickly than average wages, and were uneven across regions (Manning 1999a).24 Given the substantial rise in average wages
noted earlier, it is likely that much of the increase could be accounted for by the rising proportion of skilled workers in the workforce, and their deployment into higher-productivity jobs, especially in manufacturing and services.
The general pattern of real wage increases reversed sharply in 1998 as adjustments in nominal wages failed to keep up with rates of inflation.25
The decline in real wages was dramatic in both tradeable and non-tradeable goods sectors. They fell by close to 35% overall, and nearly 40% in manufacturing (figure 6, table 7).26 The declines were smaller in
TABLE 7 Nominal and Real Wage Growth in Major Sectors, 1990–98 (% per annum)
Agriculture Manufacturing Services All Sectors
Nominal
1990–97 14.5 13.4 12.1 14.1
1997–98 30.3 11.0 20.9 17.0
Reala
1990–97 5.9 5.0 3.8 5.7
1997–98 –26.3 –38.1 –32.1 –33.9
aThe CPI is used as the deflator.
Source: BPS, Sakernas, and Economic Indicators (various years).
FIGURE 6 Index of Change in Real Wages by Sector, 1989–98
Source: BPS, Sakernas, 1989–98.
1989 1990 1991 1992 1993 1994 1995 1996 1997 1998 50
75 100 125
Agriculture
Manufacturing
Services
30–50% in the provinces of Java during 1998 (Papanek and Budiono 1999).27 They also fell in real terms in the Outer Islands, although by a
smaller amount. These labour market effects were consistent with the social impact of the crisis, which appears to have been much more pronounced in Java.
CONCLUSIONS
Two key questions were raised in this paper. First, can analysis of labour markets help explain the seemingly much better outcomes for the poor during the economic crisis than had been predicted at the time? Second, to what extent did the large changes in relative prices between tradeable and non-tradeable goods influence the deployment of labour?
I posed two potential processes of labour market adjustment to help answer the first question. In a Keynesian-type world with rigid real wages—akin to labour market conditions in some Latin American countries—the brunt of adjustment occurs in employment, unemployment rates rise steeply, and there is a marked increase in poverty. The second model, a stylised ‘East Asian’ case, is more consistent with a neoclassical framework, where real wages adapt quickly to sharp changes in labour demand and there is a much smaller rise in unemployment and the incidence of poverty.
Underlying the contrast in these two patterns of adjustment was the notion that a country’s stage of economic development and related institutional developments can play a key role in determining labour market outcomes.28 Employment and wages are likely to be more flexible
in largely agricultural societies in which a high proportion of the workforce is self-employed or works in the informal sector. They tend to become more rigid once countries industrialise and a high proportion of the workforce is engaged in wage employment. Labour contracts become less flexible, supported by government regulation of labour protection and social security. A greater voice for organised labour limits employer choice in the setting of wages and deployment of labour. Neither agriculture nor the informal sector, which shrink in size, provide the same cushion for workers (and employers) that they once had during difficult times.
modern sector. The agricultural and urban informal sectors remained large. This structure supported labour market adaptation to what was essentially a modern sector crisis. Labour protection applied to a relatively small proportion of the workforce, and even here the regulations were indeed ‘paper tigers’. Flexible real wages supported the adjustment process, although this contributed to considerable loss of income for most workers. Our conclusion is that the Indonesian adjustment process was much closer to a neoclassical than to a Keynesian model.
Regarding the second question, it was found that much of the reallocation of labour occurred within tradeable and non-tradeable industries, although there was a net shift towards tradeables. Within tradeable industries, net gains occurred only in agriculture. Even here, we suggested, much of the new employment may have been more the result of flexible employment and income-sharing arrangements than improved income opportunities resulting from the rupiah depreciation. In general, it was argued that while relative price changes help explain employment shifts, the extent and nature of Indonesia’s shock produced a rather different outcome to that expected from standard economic theory.
It is important to point out two limitations of the analysis. First, we worked with data that were not sufficiently disaggregated at industry level, or by occupation, to be able to link macroeconomic and labour market change directly. We relied quite heavily on micro-level studies to support the tentative conclusions that emerged from the analysis of secondary data. Second, our conclusions rest heavily on one source of data, the Sakernas, and concentrate on the 12-month period from August 1997 to August 1998. They need to be tested through more disaggregated analysis based on other data sets, such as the Susenas, and for more recent times.
Finally what are the implications of the findings? First, they suggest that rural employment opportunities, especially in agriculture, still have a major role to play in labour absorption. This is especially true given that the modern sector is likely to recover only slowly from the crisis. Maintenance of rural infrastructure, both social and physical, as well as removal of impediments to trade, would seem to be critical for employment creation, income growth and poverty alleviation. Second, given the right incentives, small-scale industry can also absorb large amounts of labour through a market-oriented response to relative price changes, without the need for special subsidies or protection, many of which have not had a good record in the past.29 And finally,
during the crisis, is also likely to be critical for a broad-based improvement in living standards in the recovery period.
NOTES
* An earlier version of this paper was presented at the University of Indonesia– USAID conference, ‘Economic Issues facing the New Government’, held in Jakarta on 18–20 August 1999. The author is indebted to an anonomous referee and John Maxwell for helpful comments, and to Tubagus Feridhanusetyawan for the development of several of the ideas presented in the paper. The normal disclaimers apply.
1 The figure of 24% is based on a different basket of goods than that used to derive the poverty line in earlier years. Based on the same basket of goods as in 1996, the Central Statistics Agency, BPS, estimated (derived from consumption expenditures) that poverty incidence increased from 11% in 1996 to 17% in 1998. See also World Bank (1998), Poppele, Sumarto and Pritchett (1999), Frankenburg, Thomas and Beegle (1999) and Suryahadi, Sumarto, Suharso and Pritchett (1999) for discussions of the social impact of the crisis. 2 Of course, the process of labour market adaptation makes up only part of the story of poverty outcomes. Dissaving, transfers between households and adjustments to consumption patterns have all played an important role as strategies to deal with the crisis.
3 See especially Horton, Kanbur and Mazumdar (1994), World Bank (1995b), Guasch (1998) and Márquez (1999). Chile, where unemployment topped 20% in the early 1980s, was the extreme example.
4 This discussion draws heavily on Manning (1998).
5 The 1971 Population Census provides the first set of data on the national labour force after the Soeharto regime took over in the mid 1960s. In table 1, data from the 1971 and 1990 censuses are compared.
6 Until the economic and political crisis, migrant workers were mostly protected by tight military-imposed security from potential action against newcomers on the part of envious local populations.
7 See also Tubagus (1999), appendix A9. Real wages rose on a par with labour productivity, suggesting that unit labour costs remained relatively constant (Tubagus 1999). Indonesia’s increases in real wages were still well below those achieved in Korea and Taiwan, especially after labour markets tightened in the 1980s.
9 The emphasis in this paper is on the response to the crisis of the labour market in 1997–98. It should be noted that, despite the absence of signs of a recovery in modern sector investment, several non-agricultural sectors did show signs of improvement in the last quarter of 1998 and first half of 1999.
10 Several papers detail these developments. See especially Soesastro and Basri (1998), Johnson (1998), Sadli (1998), Tubagus (1999) and Hill (1999). 11 However, the dollar value of non-oil exports increased only slightly owing to
adverse terms of trade effects, and total export growth was adversely affected by the low price of oil (Cameron 1999).
12 The total sample covered some 60,000 households in both 1997 and 1998. Although annual indicators of labour force and employment change tend to fluctuate, partly in response to sampling error in a large and heterogeneous population, they are the best aggregate source of trends in employment and wages in Indonesia. The Susenas collects data on key labour force indicators from a larger sample, but these data are not published on a regular basis. 13 The increases in rural participation rates occurred among all age groups except
15–19-year-olds, and was especially evident among women aged 40 and over (Sakernas 1997 and 1998, table 2).
14 There is no doubt that many single migrant workers, especially in construction and manufacturing, moved back to their villages in the early months of the crisis. But at the same time little work was available in many villages, and higher urban incomes facilitated income sharing in the big cities.
15 It also points to the shortcomings of analysis based on labour demand predictions at a time when labour supply movements are a crucial determinant of employment outcomes (people crowd into informal jobs because of labour supply pressures).
16 The Sakernas data show that there was some fall in hours worked in agriculture in 1998 and a rise in the proportion of the rural workforce working very few hours (from 12 to 13%).
17 The chicken farms that mushroomed during the Soeharto era had depended on imported animal meal.
18 The large percentage decline in manufacturing employment in the Outer Islands shown in table 4 gives a somewhat misleading picture of the overall impact of the crisis, since this sector was relatively small compared with that of Java–Bali. Many more jobs were lost in manufacturing in Java–Bali, even though the overall contraction in manufacturing employment was smaller. 19 This information is based on the author’s visits to rural areas of West Java and
Yogyakarta in September 1998 and February–March 1999. See also Sandee, Andadari and Sulandri (2000), Hill (1999) and Jellinek and Rustanto (1999). 20 These findings from the macro data are confirmed by field studies. See, for
example, SMERU (forthcoming).
answer to a question on the reasons for leaving jobs, just under one-third of respondents (over one million) said that they had been retrenched. A further 45% left either because their enterprises had shut down or because their incomes were too low.
22 Over half of those losing their jobs had only a primary school education or less.
23 This point is also made in SMERU (forthcoming), which comments on the many retrenched factory women who returned to their villages.
24 While real wage growth in the rice sector was unambiguously positive in Java (around 2–3% p.a.), this was not the case in some Outer Island provinces. Wages increased very little, if at all, in South Sumatra and the more densely populated provinces of Lampung, South Sulawesi and West Nusa Tenggara. 25 The calculation of real wages using the consumer price index (CPI) as the deflator almost certainly understates the extent of real wage declines among lower-income groups, since the food component of the CPI is much smaller than in the typical basket of commodities consumed by unskilled wage workers.
26 The decline in wages may have been partly the result of a redistribution of work among wage workers. For example, males on permanent wage contracts were often replaced by younger females employed on a casual basis (Skoufias and Suryahadi 1999).
27 Papanek and Budiono also show that real wages had begun to recover by early 1999, largely as a result of much slower increases in the CPI.
28 Obviously there are large differences between countries, related to both their economic, social and political structures and their patterns of development over time.
29 The employment growth in small industry discussed in this paper preceded the substantial small-industry support schemes initiated by the former Minister for Cooperatives and Small Industry, Adi Sasono. See especially Hill (1996) for a discussion of the impact of small-scale industry support programs during the Soeharto era.
REFERENCES
Booth, Anne (2000), ‘The Impact of the Economic Crisis on Welfare: What Do We Know Two Years On’, in Chris Manning and Peter van Diermen (eds), Indonesia in Transition: Social Dimensions of Reformasi and Crisis, Institute of Southeast Asian Studies, Singapore: 145–62.
Cameron, Lisa (1999), ‘Survey of Recent Economic Developments’, Bulletin of Indonesian Economic Studies 35 (1): 3–40.
Frankenberg, Elizabeth, Duncan Thomas and Kathleen Beegle (1999), ‘The Real Costs of Indonesia’s Economic Crisis: Preliminary Findings from the Indonesia Family Life Surveys’, Labour and Population Program Working Paper No. 99-04,
Rand Corporation, New York.
Freeman, R. (1992), ‘Labour Market Institutions and Policies: Help or Hindrance to Economic Development?’, Annual Proceedings of the World Bank Conference on Development Economics, World Bank, Washington DC: 117–56.
Guasch, J. Luis (1998), ‘Labor Reform and Job Creation: The Unfinished Agenda in Latin America and Caribbean Countries’, in Shahid Javed Burki, Sri-Ram Aiyer and Rudolf Hommes (eds), Poverty and Inequality, Annual World Bank Conference on Development in Latin America and the Caribbean, World Bank, Washington DC: 145–82.
Hadiz, V. (1997), Workers and the State in New Order Indonesia, Routledge, London. Hill, Hal (1996), Southeast Asia’s Emerging Giant: Indonesian Economic Policy and
Development since 1966, Cambridge University Press, Cambridge.
—— (1999), The Indonesian Economic Crisis: Causes, Consequences andLessons, Institute of Southeast Asian Studies, Singapore.
Horton, S., R. Kanbur and D. Mazumdar (1994), Labour Markets in an Era of Adjustment, EDI Development Studies, World Bank, Washington DC. ILO (International Labour Organization) (1998), Employment Challenges of the
Indonesian Economic Crisis, ILO, Jakarta.
Jellinek, Lea, and Bambang Rustanto (1999), Survival Strategies of the Javanese during the Economic Crisis, World Bank, Jakarta, January.
Johnson, Colin (1998), ‘Survey of Recent Economic Developments’, Bulletin of Indonesian Economic Studies 34 (2): 3–57.
Manning, Chris (1998), Indonesian Labour in Transition: An East Asian SuccessStory?
Cambridge University Press, Cambridge.
—— (1999a), ‘Poverty Decline and Labour Market Change in Indonesia: Lessons from the Soeharto Era’, Indonesian Quarterly 27 (2): 122–45.
—— (1999b), ‘Labour Market Developments in the NIEs and the ASEAN-4: An Update’ Asian Pacific Economic Literature 13 (1): 51–68.
Márquez, Gustavo (1999), Labor Markets and Income Support: What Did We Learn from the Crisis? Unpublished paper, Inter-American Development Bank, Washington DC.
Maurer, Jean-Luc (1998), Indonesia: Country Strategic Opportunities Paper, Report prepared for the International Fund for Agricultural Development, Jakarta. Mietzner M. (1998), ‘From Soeharto to Habibie: The Indonesian Armed Forces
and Political Change during the Transition’, in G. Forrester (ed.), Post-Soeharto Indonesia: Renewal orChaos, Institute of Southeast Asian Studies, Singapore: 65–102.
Nayyar, R. (1995), Indonesian Labour Legislation in Comparative Perspective: A Study of Six APEC Countries, Unpublished paper, World Bank, Washington DC.
Pardede, Raden (1999), ‘ Survey of Recent Economic Developments’, Bulletin of Indonesian Economic Studies 35 (1): 3–44.
Poppele J., Sudarno Sumarto and L. Pritchett (1999), Social Impacts of the Indonesian Crisis: New Data and Policy Implications, Unpublished paper, SMERU, Jakarta.
Potter, Lesley (2000), ‘Rural Livelihoods and the Environment at a Time of Uncertainty: The Situation outside Java’, in Chris Manning and Peter van Diermen (eds), Indonesia in Transition: Social Dimensions of Reformasi and Crisis, Institute of Southeast Asian Studies, Singapore: 239–52.
Sadli, M. (1998), ‘The Indonesian Case’, ASEAN Economic Bulletin 15 (3): 272–80. Sandee, H., R.K. Andadari and Sri Sulandri (2000), ‘Small Firm Development
during Good Times and Bad: The Jepara Furniture Industry’, in Chris Manning and Peter van Diermen (eds), Indonesia in Transition: Social Dimensions of Reformasi and Crisis, Institute of Southeast Asian Studies, Singapore: 184–98. Skoufias, Emmanuel, and Asep Suryahadi (1999), ‘Growth and Crisis: Impacts on
Formal Sector Wages in Indonesia’, SMERU Working Paper Series, Jakarta, December.
SMERU (Social Monitoring and Early Response Unit) (forthcoming), ‘The Labour Force Dimensions of the Economic Crisis’, SMERU Working Paper Series, Jakarta. (See also SMERU, Newsletter 07/99, August 1999.)
Soesastro, Hadi, and M. Chatib Basri (1998), ‘Survey of Recent Economic Developments’, Bulletin of Indonesian Economic Studies 34 (1): 3–54.
Suryahadi, Asep, Sudarno Sumarto, Yusuf Suharso and Lant Pritchett (1999), ‘The Evolution of Poverty during the Crisis in Indonesia: 1996 to 1999’, SMERU Working Paper Series, Jakarta, December.
Tubagus Feridhanusetyawan (1999), The Impact of the Crisis on the Labor Market in Indonesia, Report prepared for the Asian Development Bank, Manila, 22 March. Williamson, J. (ed.) (1990), Latin American Adjustment: How Much Has Happened?
Institute for International Development, Washington DC.
World Bank (1995a), World Development Report 1995: Workers in an IntegratingWorld, World Bank, Washington DC.
—— (1995b), Labor and Economic Reforms in Latin America and theCaribbean, World Bank, Washington DC.