Full Terms & Conditions of access and use can be found at
http://www.tandfonline.com/action/journalInformation?journalCode=vjeb20
Download by: [Universitas Maritim Raja Ali Haji] Date: 11 January 2016, At: 22:20
Journal of Education for Business
ISSN: 0883-2323 (Print) 1940-3356 (Online) Journal homepage: http://www.tandfonline.com/loi/vjeb20
Retention of Economics Principles by
Undergraduates on Alternative Curricular
Structures
Daniel K. N. Johnson , Kristina M. Lybecker & Corrine H. Taylor
To cite this article: Daniel K. N. Johnson , Kristina M. Lybecker & Corrine H. Taylor (2011) Retention of Economics Principles by Undergraduates on Alternative Curricular Structures, Journal of Education for Business, 86:6, 332-338, DOI: 10.1080/08832323.2010.532240 To link to this article: http://dx.doi.org/10.1080/08832323.2010.532240
Published online: 29 Aug 2011.
Submit your article to this journal
Article views: 313
ISSN: 0883-2323 print / 1940-3356 online DOI: 10.1080/08832323.2010.532240
Retention of Economics Principles by
Undergraduates on Alternative Curricular Structures
Daniel K. N. Johnson and Kristina M. Lybecker
Colorado College, Colorado Springs, Colorado, USA
Corrine H. Taylor
Wellesley College, Wellesley, Massachusetts, USA
The authors investigated whether the curricular structure of an economics course (semester, trimester, or compressed block schedule) has an effect on an undergraduate’s subsequent reten-tion of course material, while controlling for other relevant differences. They tested separately for theoretical or process comprehension and for graphical construction or interpretation, while separating microeconomics from macroeconomics content as well. They used an instrument to address the no-stakes testing problem, and their Heckman two-stage estimations present some interesting results for educators and institutional policymakers alike.
Keywords: curriculum, economics, Heckman, retention, survey
Although the vast majority of U.S. undergradu-ates take their courses on a semester-based (roughly September–December, then January–May) system, there are several alternative curricular structures available. Some institutions follow a trimester system (approx-imately September–November, November–March, and March–June), or a quarter system (September–November, November–February, February–April, then April–June). A few employ a creative compressed schedule, comparable to many summer education programs, where students take only one class per month, switching every month (e.g., the Col-orado College Block Plan, which was also adopted by Cornell College, among others). This leads to an obvious question: Does the curricular form of instruction matter, or does the function of an economics education prevail equally regard-less of format? That is, does a compressed format serve students equally well in conveying the theory and tools of an economics education?
Each curricular format offers roughly the same number of classroom contact hours per course, but range from 3 hr/week for 13 weeks to 15 hr/week for 3 weeks. Therefore, the
ef-Correspondence should be addressed to Daniel K. N. Johnson, Col-orado College, Department of Economics and Business, 14 E. Cache La Poudre Street, Colorado Springs, CO 80903, USA. E-mail: djohnson@ coloradocollege.edu
fect of these alternative formats on student retention may be dramatically different. We tested those differences using a nationwide sample of undergraduate liberal arts students, all of whom had taken at least one principles course (microe-conomics, macroe(microe-conomics, or a combination principles of economics course), evaluating them after course completion for their retention of economics tools and concepts.
Naturally, there is self-selection intrinsic to the question at hand, as students have not been assigned randomly to dif-ferent curricular formats. The question still remains as to whether all structures serve their constituents equally effec-tively. Is retention of subject matter driven by institutional structure, a factor largely out of the control of the teacher or student once a choice of school is made, or does knowledge retention depend on other factors instead?
Studies of student learning and retention are not new in economics, and many can be traced back to the Stigler’s (1963) hypothesis, namely that exposure to economics courses does nothing for the long-term memory of economics concepts. The types of studies conducted broadly fall into the following categories: retention of introductory economics by college students, retention of college economics by public school teachers, retention of economics by students at differ-ent types of institutions, and the impact of microeconomics textbooks on knowledge retention. In general, scholars have found minimal long-term memory, in particular for those students who took fewer than four courses.
RETENTION OF ECONOMICS PRINCIPLES 333
The existing literature has incorporated a wide variety of explanatory variables, testing the importance of each of the following: number of economics courses taken in college, length of time since last course, class standing, gender, age, college major, occupation, interest in economics, reading habits, SAT scores, race, ethnicity, educational aspirations, class size, use of graduate student instructors, and reinforcing coursework in mathematics. We subsequently specify vari-ables included in previous studies. Kohen and Kipps (1979) included time elapsed, GPA, credit hours completed in eco-nomics, credit hours completed in mathematics, credit hours completed in business, age of student, and student gender. Saunders (1971) included quality of textbook, quality of in-struction, and time spent on course. Saunders (1980) included number of economics courses, SAT score, gender, marital sta-tus, interest in economics, importance of economics, reads business periodicals, major course of study, occupation, and income. Walstad and Allgood (1999) included gender, race, transfer student status, enrollment (full- or part-time), native language, degree aspiration, and GPA. Bach and Saunders (1966) included number of economics courses, time since economics course, gender, and college major. Pyne (2006) included grade in economics course, term in which course was taken, grade in calculus, number of additional mathe-matics courses, GPA, and textbook. Brown and Liedholm (2002) included gender, race, mathematics courses taken, ACT score, GPA, and number of credit hours attained.
Further, a variety of tests and surveys have been utilized to measure student performance. In addition to study-specific surveys, student retention has been evaluated using a variety of other tests and surveys: Gallup survey, Major Field Test in Business II (MFTB), Test of Economic Understanding (TEU), and several versions of the Test of Understanding in College Economics (TUCE).
Bach and Saunders (1966) presented data on high school social studies teachers that attended five different types of in-stitutions. In comparing students who had taken economics courses with those who did not, their results tended to sup-port Stigler’s (1963) hypothesis. Saunders (1971, 1980) com-pared the performance of students who took an introductory economics course with that of students who did not over three periods of time: immediately following the course, two years after the course, and five years after taking the course. Finding a small difference (about 10%) in favor of the alumni with only an introductory economics course provided a weak rebuttal to Stigler’s hypothesis. The previously mentioned studies have also shown that the effects of an introductory economics courses on student performance diminish over time.
Kohen and Kipps (1979) considered the effect of time on retention and empirically measure the rate of depreciation of a student’s stock of economic knowledge, finding annual rates of decay ranging between 13 and 23%.Walstad and Allgood (1999) study investigated the economic knowledge of college seniors, finding those with an economics course
scored 14% higher than those without. At the same time, the performance of those who had taken an economics course was quite disappointing, averaging only 62% correct. How-ever, it is worth noting that this is not too far from the posttest mean scores on the TUCE III of 45.3 to 51.2% (Saunders, 1991).
Most recently, Pyne (2006) explored whether the choice of introductory microeconomics textbook has a lasting effect on student retention and performance in future economics courses. He found limited evidence that the choice of text matters, although it is impossible to reject the hypothesis that most texts lead to identical results in student retention.
In the present article we extend the literature’s discussion in a new way, exploring the importance of curricular format while controlling for the same factors that other researchers have used to explore long-term memory of economics prin-ciples. In the Method section we outline our research design and in Section 3 we present our survey data. In Section 4 we present the model, in Section 5 we present the estimation results, and in Section 6 we conclude with implications and suggestions for subsequent work.
METHOD
Given the vast heterogeneity with which principles of eco-nomics courses are taught across the nation, we first decided to curtail our consideration to undergraduates at roughly sim-ilar institutions: 4-year liberal arts colleges of high national ranking. It is worth noting that in a study of different insti-tutional types, Bach and Saunders (1966) found that lasting retention was greatest at small liberal arts colleges. We ran-domly chose 50 such institutions from the top 200 listed by U.S. News and World Report (“U.S. News Best Colleges 2004,” 2004). Of the 50 invitees, only 5 agreed to partic-ipate: Colorado College, Furman University, Kenyon Col-lege, Wellesley ColCol-lege, and Whitman College. All others sent their regrets, citing confidentiality of student e-mail ad-dresses and the desire not to tax their students with too many surveys as their primary concerns.
We asked each participating registrar to provide a list of e-mail addresses for students who fit our specific sample re-quirements: juniors and seniors who had taken at least one economics course but who were not at that time enrolled in an economics course, and who were not declared majors in economics, business, political economy, or mathematical economics. We limited our sample to upper level students to minimize the variation in age and college test-taking experi-ence. We sampled only students who had taken an economics course, as other studies (e.g., Bach & Saunders, 1966; Saun-ders, 1971; SaunSaun-ders, 1980; Walstad & Allgood, 1999) have provided ample evidence comparing control groups with no economics coursework. Finally, we deliberately excluded students majoring in economics or related disciplines to min-imize variation in exposure of the respondents to economics
applications, and to target the specific population we have in mind, namely students with rudimentary education in the discipline. By selecting juniors and seniors only, we also minimized the chance that we would have potential eco-nomics majors in the sample who were undeclared at the time of study. Given that such a possibility still exists, we controlled for the number of related courses the students had taken.
We e-mailed an invitation to participate to each student, providing a link to a third-party survey website with the promise of a randomly assigned $50 prize to five
partici-pants. Given this structure, our results are clearly subject to the low-stakes testing problem, widely referenced in the education literature as a challenge to most forms of stan-dardized testing (e.g. Wise & DeMars, 2005). In the absence of an incentive to take the questions seriously, we had lit-tle confidence that all students approached the survey with an equal degree of attention. Furthermore, survey invitations came from an e-mail address at either Colorado College or Wellesley College, which may have had an impact on the willingness of students at those institutions to respond. Un-beknownst to the respondents, we recorded the amount of time each respondent took to complete the online survey and used it in the following section as an (imperfect) indicator of the seriousness with which respondents answered the ques-tions posed.
The survey consisted of 25–41 questions (depending on whether the respondent took one principles course or two). The full survey is included in Appendix A. It begins with four questions to confirm eligibility: junior or senior sta-tus, one or more economics principles courses taken, major, and confirmation that the respondent was not taking an eco-nomics course. Any respondent not answering all questions as needed for our sample was politely dismissed from the process and blocked from responding to any further ques-tions. For those respondents continuing on, five questions investigated their status: GPA, gender, foreign student status, number of high school and college courses taken abroad, and number of courses in economics beyond principles. Next, participants were asked six questions about each principles-level class they had taken: how many months ago it took place, what curricular structure it used (semester, trimester, quarter, or compressed schedule), how much effort the stu-dent contributed in hours per day, class size, a rating of the instructor, and a rating of the text. Students were asked to rate the overall effectiveness of the course and of the instructor. No further details were provided to them on which criteria they should use to determine their ratings. All descriptive questions were asked in the form of multiple choice, with the exception of GPA, in which a precise number was requested. Notice that all variables were therefore recorded on a 6-point Likert-type scale ranging from 1 (very little) to 6 (very much). Finally, to ensure impartiality of the knowledge-based questions, 20 multiple-choice questions from the College Board’s Advanced Placement 2005–2006 test were selected
(10 for microeconomics and 10 for macroeconomics). The questions covered standard topics: comparative statics of de-mand and supply, profit from cost-curve graph, consumer surplus, Federal Reserve open market operations, fiscal pol-icy, and exchange rates. Respondents were allowed to answer only questions that pertained to the courses that they had completed. At the time of the survey’s administration, we were unaware of TUCE, but would find that equally suitable, if not preferable, in subsequent studies of this type.
Half of the knowledge-based questions required some graphical skills of the respondent (either interpretive or cre-ative by the respondent to answer the question). The other half were based on an understanding of process or theory (e.g., how do exchange rates work) rather than interpretation of a graph’s movement or area.
Data
We received 294 valid responses, a 24.2% response rate—which was better than the response rate reported in studies by Saunders (1971, 1980) and Allgood, Bosshardt, van der Kaauw, and Watts (2004)—after two waves of invi-tations in September and October of 2005. A total of 60% of the resulting sample was seniors. All but 10 respondents chose to voluntarily report their GPA, but because less than one third elected to report their sex, our data do not report any decompositions or statistical controls for sex.
Of the respondents, 85 took microeconomics principles, 17 took only macroeconomics principles, 96 took both sub-jects as separate courses, and the remaining 96 took both as a single combined course. Only three respondents reported taking no economics courses subsequent to principles of eco-nomics.
Eight percent of respondents reported completing princi-ples courses in the prior 6 months, another 16% indicated completion within the year prior, and a further 33% had completed the course less than two years prior.
Just under one quarter of all respondents reported attend-ing all of their high school and college courses within the United States, and a full two-thirds of respondents had taken some share of their college education abroad. However, only 14 respondents (less than 5%) self-identified as foreign stu-dents.
We found that over 70% had attended class under the semester system, another 10% had attended under the trimester system, and the remaining 20% learned economics under the compressed schedule (either Block Plan or sum-mer classes). We therefore removed the quarter system from consideration in our sample. It is also important to note that there was not a perfect overlap between the manner in which a student learned economics and the curricular structure at the student’s home institution, as some students took eco-nomics at a summer program hosted by a different institution or during a study abroad program. Although we were unable
RETENTION OF ECONOMICS PRINCIPLES 335
to control for students who studied at different institutions during a summer term, we did include a control for study abroad programs.
In the subsequent estimation, several variables were treated as level variables: subsequent economics courses (one, two, three or more), retention period since the prin-ciples course was completed (<6 months, 6–11 months, 12–23 months, 24–36 months, >36 months prior), stu-dent effort in the class (less than 1 hr outside of class per day, 1–2 hr; more than 2 hr and as much as 3 hr, more than 3 hr), teacher and text quality, ranked on a 6-point Likert-type scale ranging from 1 (excellent; always clear, knowledgeable, energetic, approachable) to 6 (would have failed “Teaching 101”; never any of the above), are grouped as level variables. Others are simply presented as dummy variables: senior status, foreign status, studied abroad, small class size (i.e., less than 25 students), taking both principles classes as opposed to only one, and curricular structure.
An examination of the results revealed scores that were strikingly low (averages of 2.43 and 2.05 out of 10 on micro-and macroeconomics quizzes, respectively). This may sup-port the rather dire Stigler (1963) hypothesis that retention of applicable knowledge may be not much better than zero, as random guesses would warrant an average of 2 out of 10. Moreover, even college students lacking any economics training would presumably be able to eliminate some pos-sible responses to score higher than random guesses. Upon further reflection, given that the AP economics test is de-signed to test proficiency in the discipline at the principles level among a population of high school students studying in advance (often with the help of preparatory courses and materials), perhaps it would be improper to be too hard on the survey respondents. After all, they were instructed not to prepare, but rather to reveal their on-the-spot recollections of graphs and theory outside of their major.
In addition, we recognized that some respondents sim-ply did not take the knowledge-based questions seriously. We therefore used another piece of information collected, the time taken to complete the survey, as an indicator of whether respondents were seriously answering the questions or merely entering the prize lottery. In fact, times ranged from under 1 min for all 26 relevant questions (inadequate time to even read each question) to almost 3 days (presumably by someone who forgot that the link remained open on their computer).
Table 1 presents summary statistics on the dependent vari-able, correct responses, and on the micro- and macroeco-nomics tests for various populations. Notice in particular the pattern of increasing correct answers among respondents who took only slightly longer to think about the questions before submitting their answers. Thankfully, we differentiated these groups using the subsequent methodology in order to learn more accurately about the true underlying retention patterns of our students.
TABLE 1 Summary Statistics
Correct response
Microeconomics Macroeconomics
Statistic M SD M SD
Semester 2.46 1.09 2.06 1.74
Trimester 2.33 1.24 2.29 1.52
Compressed
Total 2.43 1.10 2.05 1.72
Model
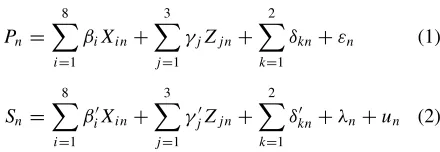
We estimated a Heckman-corrected negative binomial model, assuming that respondents spending less than a crit-ical minimum amount of time on the survey were not truly displaying their knowledge on the survey. In other words, we estimated a two-stage model: first, the decision by re-spondents to display their full knowledge accurately, and second, their ability to answer economics questions cor-rectly.
where Pnis the probability that respondentnspent more than 15 minutes on the test; Xi represents respondent-level fac-tors (GPA, number of subsequent courses, foreign student status, study abroad, senior status, both principles courses taken, retention lag, effort level); Zjrepresents course-level factors (teacher quality, text quality, class size); δk repre-sents the curriculum-level factors (dummies for trimester or compressed schedule as compared with the default semester system); Sn is the score of respondent non the economics test;λnis the inverse Mills ratio for the respondent, as cal-culated from Equation 1; ε and u are error terms due to the linear approximation of Equations 1 and 2; and esti-mated coefficients β andβ’,γ andγ’, andδ andδ’ have no theoretical linkage to one another other than their pre-multiplication of similar variables in separate stages of the analysis.
TABLE 2
Determinants of Successful Responses on Knowledge-Based Questions
Microeconomics questions Macroeconomics questions
All questions Graphical questions only All questions Graphical questions only
Variable Coefficient t Coefficient t Coefficient t Coefficient t
Respondent-level variables
GPA –0.072 0.62 –0.225 1.56 0.727 1.74† –0.239 0.97
Subsequent courses 0.031 0.33 0.023 0.21 –0.212 1.63† 0.194 1.17
Foreign status –0.156 0.36 –0.270 0.55 –2.488 2.34∗ –0.578 0.82
Studied abroad 0.186 1.08 0.173 0.77 –0.319 1.41 –0.379 1.35
Senior –0.281 1.71 –0.185 0.94 –0.607 2.24∗ –0.599 1.54
Both principles classes 0.511 2.53∗∗ 0.529 2.35∗∗ 4.776 2.75∗∗ 3.043 1.89†
Retention lag 0.002 0.22 0.003 0.39 0.008 0.82 0.004 0.30
Effort level −0.071 0.62 −0.054 0.38 0.032 0.23 –0.197 1.17
Course-level variables
Teacher quality 0.011 0.26 –0.032 0.57 0.077 1.28 0.038 0.50
Text quality –0.001 0.02 –0.043 0.40 0.094 0.97 0.119 0.79
Small class size 0.190 1.10 0.015 0.08 –0.309 1.25 0.909 1.55
Curriculum-level variables
Trimester –0.256 0.90 –0.584 1.62† –0.535 1.27 1.01 1.51
Compressed schedule (block plan) –0.011 0.05 –0.006 0.02 0.236 0.81 0.061 0.18
Regression-wide controls and diagnostics
Inverse mills 0.089 1.21 0.093 2.00∗ –5.455 –2.27∗ –3.663 1.49
Number of observations 206 206 200 200
Waldχ2 74.88∗∗ 40.99∗∗ 28.74∗∗ 34.63∗∗
†p=.1.∗p=.05.∗∗p=.01.χ2for microeconomics questions (first 4 columns)n=197, df=12;χ2for macroeconomics questions (last 4 columns)n=
200, df=13.tvalues for microeconomics questions (first 4 columns) df=185;tvalues for macroeconomics questions (last 4 columns) df=187.
This suggests that a respondent may decide to seri-ously consider the questionnaire depending on the same vector of characteristics that enable them to correctly an-swer the questions (i.e., all information that we have about the respondent and his or her educational experience). The cutoff level of 15 min was established to roughly corre-spond to the College Board’s own timed ratio of 0.857 content questions per minute with an additional 3.5 min for completion of the descriptive questions at the start of our survey. According to the College Board, each exam (the AP microeconomics exam and the AP macroeco-nomics exam) is 2 hr 10 min in length. In Section I, stu-dents are given 70 min to answer 60 multiple-choice ques-tions; in Section II, they must answer three required free-response questions in 50 min. (http://apcentral.collegeboard. com/apc/members/exam/exam information/2084.html). We deemed respondents spending less than that amount of time to have chosen not to display their knowledge. We inferred the probable correct responses to the economics quizzes for those below the cutoff using the standard Heckman technique with inverse Mills ratio. Naturally, we tested al-ternative cutoff deadlines to ensure that our results were robust.
To our knowledge, there is little rigorous modeling of knowledge retention in the economics literature. Seminal studies of student outcomes tend to rely on a reduced form
linear approximation (Bach & Saunders, 1966; Walstad & Allgood, 1999). We found that the literatures in psychology and education focus on fundamentally different questions surrounding the retention of learned material, so treating the data as linear approximation is the present best practice.
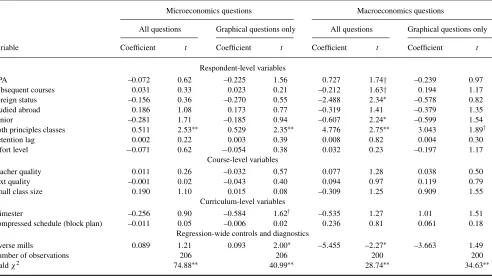
RESULTS
Results for four estimations are presented in Table 2, all for cutoffs of 15 min. With cutoffs of 10 min or 30 min, the resulting coefficients are extremely similar in sign and size. All formulations show highly significant Wald statistics, indicating that the linear approximation has some measure of explanatory power.
Most importantly, curricular structure appears to be largely insignificant to the learning of economics. Students who learned on the trimester system were less adept at microeconomics-related graphical questions, but there ap-peared no relative benefit or cost in either microeconomics or macroeconomics overall.
GPA seemed to matter little (in contrast with Kohen & Kipps, 1979; Walstad & Allgood, 1999), although we found a slight advantage to better overall students in the retention of macroeconomics knowledge.
RETENTION OF ECONOMICS PRINCIPLES 337
Oddly, students appeared to be slightly less accu-rate on macroeconomics questions if they had taken subsequent economics courses. This, combined with in-significant coefficients for microeconomics-related ques-tions, raises questions about their significance and cause. We trust that it is merely a function of our data set. However, it is worth pointing out that the improve-ment in student performance from taking both principles courses was much greater for macroeconomics-related questions than for microeconomics-related questions.
Foreign students performed significantly worse on the macroeconomics test than did domestic students. Perhaps that is due to linguistic or institutional differences, but if so, it is puzzling why those differences did not similarly compromise the performance of foreign students in mi-croeconomics questions. Is it possible that the traditional principles experience in introductory microeconomics is typically more mathematical and theoretical compared to a more institutional or culturally specific education in in-troductory macroeconomics? Consider, for example, how frequently macroeconomics is taught using U.S. examples (e.g., the Federal Reserve system’s workings), whereas mi-croeconomics examples are more universal (e.g., indirect tax incidence). Optimistically, it is merely that the choice of questions from the AP economics exam was culturally bi-ased.
The institutional content of macroeconomics versus the more mathematical content of microeconomics may have other implications as well. It is interesting to note that only 17% of the students who took only one course took macroe-conomics, while the vast majority (83%) chose to take a microeconomics course. This may imply a preference for microeconomics over macroeconomics, or it may indicate that more of the students who first took a macroeconomics course went on to take the introductory microeconomics than students who first took microeconomics. It is possible that the more mathematical content of microeconomics courses may discourage mathematics-phobic students from taking additional courses, whereas macroeconomics is potentially less likely to have this effect.
Seniors performed worse on the macroeconomics ques-tions than did their junior peers, even controlling for the time since they took the course. It is curious that their poor per-formance was not uniform, but rather scores were lower in macroeconomics than in microeconomics. Notice also that the retention lag, or time since the course was completed, did not appear significantly in any equation, perhaps because the time frame (3 months to 3 years) was still quite limited.
Although not surprising, it is encouraging to note that stu-dents who took both principles courses were unambiguously better at answering all forms of questions. Complementary courses in microeconomics appeared to help students answer questions in macroeconomics much more than the reverse.
Finally, notice that the Mills ratio was significant in two of the four specifications, and close to significance on the
other two. We take that as indication that the econometric correction for sample selection bias was warranted.
CONCLUSION
This study extends the existing literature on the retention of economic knowledge by investigating the importance of curricular format. Examining semester, trimester, and block formats, we tested for elementary economic knowledge re-call while controlling for the traditional variables that previ-ous researchers have used to explore long-term memory of economic principles. Perhaps most important, we found that curricular structure is largely insignificant to the learning of economics. This is encouraging for instructors under each structure, suggesting that long-term retention of economics is dependent on factors more directly under their control.
The results also point to the importance of providing stu-dents with exposure to macro- and microeconomic theories and concepts. Performance in each of the two areas was en-hanced by coursework in both principles classes. Because long-term retention of economic knowledge is improved by taking both courses, notably even when offered as a single combined course, increasing the number of students who take combination and sequence courses would seem to be a worthwhile endeavor.
From one perspective, our overall results could be inter-preted as fairly bleak. After all, retention overall was atro-ciously low in our sample. The results were more in line with the TUCE pretest scores, 29% and 31% on TUCE-4 microe-conomics and macroemicroe-conomics tests, respectively (Walstad & Watts, 2005), than the posttest mean scores, 45–51 percent on TUCE III (Saunders 1991). Moreover, performance did not appear to be impacted much by variables that we would prefer to believe really do matter, such as student effort and scholastic ability, teacher quality, or textbook choice.
On the other hand, respondents have self-selected into their chosen curricular structures and class choices, hopefully altering their paths to the point where marginal differences in textbook quality or student effort do not matter. For students who are experiential learners, they may presumably not be dissuaded by a course with a mediocre textbook, and their knowledge retention may be largely unaffected by the quality of that text.
More importantly, it is essential to recognize that all sur-veys were completed by students who took principles of eco-nomics courses and then subsequently chose not to major in economics-related disciplines. Presumably they did not have a natural passion or proclivity for the subject area, although the overwhelming majority of respondents reported taking additional economics courses subsequent to principles. Such students may have little reason to perform well on a sponta-neous test of knowledge in a subject area in which they have universally chosen not to pursue as a major, and in which
most of them have not taken a course for more than a year prior to the survey.
One concrete logistical suggestion that these results point to is the necessity of accounting for and, if possible, counter-manding the limitations of low-stakes testing. In subsequent testing, we would consider installing a visible timer on each question, or a prompt to ask for confirmation if a respondent clicks through a question too quickly to be considered se-rious. We suspect that small cues to raise expectations may generate much more information on true student performance than we were able to gather.
It would naturally be interesting to mount this experiment again, in cooperation with others in the discipline, to test larger populations, and to test economics majors compared to noneconomics majors while controlling for curricular struc-ture. We would appreciate the chance to confirm the results presented here with the TUCE. Parallel tests in other disci-plines, to discern where (if any) the benefits of the semester, trimester, or block systems are greatest would be valuable to educational administrators and teachers alike.
ACKNOWLEDGMENTS
The authors wish to thank the College Board for their kind permission to use AP questions in this work. We also ac-knowledge the support of the Colorado College Learning and Teaching Center as well as a Mrachek Fellowship from Colorado College. Special thanks to Sylwia Kolankowska and Scott McCulloch for their great research assistance.
REFERENCES
Allgood, S., Bosshardt, W., van der Klaauw, W., & Watts, M. (2004). What
students remember and say about college economics years later.The
American Economic Review,94, 259–265.
Bach, G. L., & Saunders, P. (1966). Lasting effects of economics courses
at different types of institutions.The American Economic Review,56,
505–511.
Brown, B. W., & Liedholm, C. E. (2002). Can Web courses replace the
classroom in principles of microeconomics?American Economic Review,
92, 444–448.
Kohen, A. I., & Kipps, P. H. (1979). Factors determining student retention of economic knowledge after completing the principles-of-microeconomics
course.The Journal of Economic Education,10(2), 38–48.
Pyne, D. (2006).Does the choice of introductory microeconomic textbook
matter?Working paper, Memorial University of Newfoundland. Saunders, P. (1971). The lasting effects of elementary economics courses:
Some preliminary results.The American Economic Review, 61, 242–
248.
Saunders, P. (1980). The lasting effects of introductory economics courses. The Journal of Economic Education,12(1), 1–14.
Saunders, P. (1991). The third edition of the test of understanding in college
economics.The Journal of Economic Education,22, 255–272.
Stigler, G. J. (1963). Elementary economic education. The American
Eco-nomic Review, 53, 653–659.
U.S. News best colleges 2004. (2004). U.S. New and World Report, February.
Walstad, W. B., & Allgood, S. (1999). What do college seniors know about
economics?The American Economic Review,89, 350–354.
Walstad, W. B., & Watts, M. (2005, December).The test of
understand-ing of college economics: Revision and preliminary results. Paper pre-sented at the American Economic Association Annual Meeting, Boston, MA.
Wise, S. L., & DeMars, C. E. (2005). Low examinee effort in low-stakes
assessment: Problems and potential solutions.Educational Assessment,
10(1), 1–17.