Associations between Dengue Hospitalizations and Climate in Can Tho,
Vietnam, 2001-2011
Nguyen P. Toai a, Dang V. Chinh b, Amy Y. Vittor c and Nguyen N. Huy d
a
Department of Research and International relations, Can Tho Medical College, 340 Nguyen van Cu street, Can Tho city, Vietnam
b
Department of Epidemiology, the Institute of Public Health in Ho Chi Minh city, 159 Hung Phu street, Ho Chi Minh city, Vietnam
c
Department of Medicine, Emerging Pathogens Institute, the University of Pennsylvania, Philadelphia PA 19104, USA
d
The Institute for Social and Environmental Transition (ISET), No. 18, alley 1/42, Lane 1 Au Co, Tay Ho District, Hanoi, Vietnam
Abstract
In Vietnam, dengue fever is a major cause of hospitalization with over one million cases reported between 1991 and 2004. Changes in the incidence of dengue in Can Tho city due to increased temperature and changes in precipitation, are anticipated. In an effort to better characterize the relationship between climate and dengue, we examine the associations between weather variables and dengue hospitalizations in Can Tho between 2001 and 2011. Monthly data on hospitalized dengue cases and means of temperature, rainfall and humidity were recorded from 2001 to 2011. We used the Box-Jenkins approach to modelling of time series to assess the association between these factors. This model was validated by the Port-manteau test. Our results revealed that the highest dengue incidences in Can Tho occur between July and December. After
adjusting for seasonality, the rate of dengue hospitalizations was signiicantly associated with relative humidity with a lag
of one month. Rainfall and temperature were not predictors of dengue hospitalization rate. In conclusion, these data suggest that maximum relative humidity (with a one month lag) is an important determinant of dengue hospitalizations. Enhanced vector control during months with high humidity may be an important approach to prevent dengue transmission.
Keywords: dengue fever; incidence; climate; hospitalizations; ARIMA model
1. Introduction
Infection with one of four dengue virus serotypes (DEN-1, DEN-2, DEN-3, and DEN-4; family
Flaviviridae; genus Flavivirus) causes an acute febrile syndrome called Dengue Fever. Mosquitoes of the genus Aedes (Ae. Aegypti, and to a lesser extent, Ae. albopictus) are its vector. It is estimated that 390 million people worldwide are infected yearly with 96 million manifesting symptoms (Bhatt et al., 2013). Approximately one percent of the dengue cases are complicated by hemorrhage, hemodynamic instability, and/or end-organ damage (Rigau-Pérez, 2006). In endemic regions in Asia and Latin America, severe dengue is a leading cause of morbidity and mortality.
At present, there are no approved speciic therapies
(Schwartz et al., 2015). A vaccine has been very recently developed and registered for use in endemic regions (WHO, 2016), but vector control remains critical for disease prevention.
In Vietnam, dengue fever is an important public health issue and a leading cause of illness and death (WHO, 2011). In 2010, over one hundred thousand cases of dengue were reported (Central Institute for Hygiene and Epidemiology, 2010). It is estimated that one third of the cost of dengue management is assumed by the government, and the remainder is covered by the patients themselves (Can Tho Department of Health, 2011). This cost does not include the number of working days lost by patients and caregivers.
The burden of disease in Vietnam is greatest in the Mekong Delta (Vu et al., 2014). In the city-province of Can Tho, which lies in the heart of the delta, the annual dengue hospitalization rate has been approximately one in one thousand per year (Center for Preventive Medicine of Can Tho City, 2009; 2010; 2011). Many studies have examined the relationship between climate and dengue incidence (Thai and Anders, 2011; Thai
et al., 2010; Gharbi et al., 2011; Descloux et al., 2012; Banu et al., 2011), but it has been dificult to
The international journal published by the Thai Society of Higher Education Institutes on Environment
E
nvironment
A
sia
generalize the indings due to regional variability and
heterogeneity of methods used. In Vietnam, Thai et al. (2010) examined climate and dengue incidence in Binh Thuan Province in the middle of Vietnam using wavelet analysis, and found a positive association between dengue incidence and precipitation,
temperature, and humidity, and identiied a periodic
multi-annual cycle. Pham et al. (2011) analysed dengue incidence, larval indices, and weather variables in Vietnam’s central highlands, and also found that precipitation, temperature, and humidity were positively associated with the risk of dengue. However, in examining multiple provinces in Vietnam, Vu et al.
(2014) found that while temperature, precipitation and
humidity were signiicantly associated with dengue
in most of the provinces, the direction and degree of association varied greatly.
Thus, in order to understand the influence of weather variables on dengue transmission in Can Tho, inferences cannot be made reliably from the literature alone. We therefore conducted a time series analysis of the dengue hospitalization rate and weather variables in Can Tho between 2004 and 2011. The aim of this work is to lay the groundwork for the adaptation of dengue prevention and control strategies to a changing climate.
2. Materials and Methods
2.1. Study site
Can Tho city is one of five major cities in Vietnam. It lies in the heart of the Mekong Delta and has a population of 1.2 million (Can Tho City Statistics Department, 2012). The city limits include rural areas in which 65% of the population resides. With a population density of 852 people/km2, the city is considerably denser than the country wide average for Vietnam (289 people/ km2). Can Tho has a tropical monsoon climate, with a rainy season from May to October, and a dry season from November to April. Average humidity is 83% and annual rainfall is between 1,500 to 1,800 mm/year. The city has been
experiencing increasing looding with parts of the city
inundated for two months per year, (Can Tho Climate
Change Ofice, 2012). The mean annual temperature
is 27°C, but a rise of 0.4°C has been recorded since 1960 (World Bank, 2015).
2.2.Dengue hospitalizations
Dengue hospitalizations have been recorded between 2001 and 2011 but reliability is an issue prior to
2004. The monthly rate of hospitalization was calculated
based on clinically deined cases in accordance with
WHO diagnostic criteria (WHO, 2009). Data gathered included name, age, sex, address, hospital admission date, diagnosis, and disease severity.
2.3.Meteorological data
Meteorological data collected included monthly averages, minimums, and maximums for rainfall, temperature, and humidity from the Can Tho meteorological and hydrological station, located in the center of Can Tho city.
2.4. Autoregressive integrative moving average (ARIMA) models
Autoregressive integrative moving average (ARIMA) models have proven very useful for the analysis of time-series data, explicitly accounting for temporal dependence between observations (Helfenstein, 1996). We employed the Box-Jenkins approach to modelling dengue hospitalization rates in Can Tho, in which we: 1) examined the observations for stationarity (constant mean and variance over time); 2) analyzed the data for seasonal variance; 3)
speciied the model by inspecting its autocorrelation
structure; 4) estimated model parameters; and 5)
reined the model and examined its goodness-of-it.
The monthly auto-correlation function (ACF) and the partial auto-correlation function (PACF) were examined to determine the lag. Residuals of the model were checked for white noise with Bartlett’s Portmanteau test. Statistical analysis was conducted in STATA v11.0 (Statacorp, College Station, TX).
3. Results and Discussions
3.1.Dengue hospitalization rate
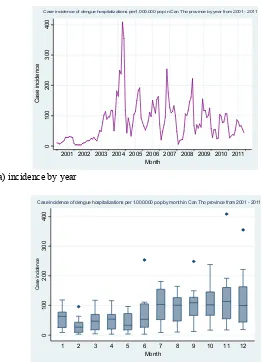
There were signiicant year-to-year variations, with
peak rates occurring in 2004. Dengue hospitalization rates declined in subsequent years, from 2.2/1000 in 2004 to 1.3/1000 in 2007, then 0.8/1000 in 2010, and 0.6/1000 in 2011.The annual incidence of new dengue cases remained high. (Fig. 1(a)).
3.2. Seasonal variation
3.2.1. Temperature
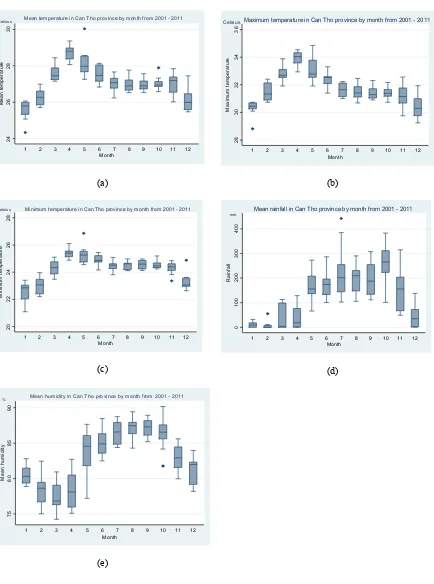
Average monthly temperatures from 2001 to 2011 were plotted to place the dengue hospitalization data in a larger climate context. Fig. 2(a) depicts monthly average temperatures. Maximum temperatures ranged between 21.1°C and 34.9°C (mean 27.1±1.0°C, 95% CI 26.9 - 27.3°C), with hottest periods occurring in
April (Fig. 2(b)). Minimum temperatures luctuated
between 21.1°C and 26.9°C (mean 24.3±0.9°C, 95% CI 24.1 - 24.5°C) (Fig. 2(c)).Temperature is an important factor in the rate of mosquito development, biting behaviour, and the dengue virus extrinsic cycle,
with both elements slowing down signiicantly below
20°C (Watts et al.,1987).
3.2.2. Precipitation
This peaked in October with an average rainfall of 265.3±25.8mm (95% CI, range from 210.5 to 320.1mm). Lowest precipitation occurred in February (mean 6.2±3.4mm, 95% CI range from -1.1 to 13.4) (Fig. 2(d)). Precipitation is clearly important for the formation of breeding sites, but excessive precipitation may washout breeding sites. In addition, key breeding containers may be large capacity (>50L) water storage
containers that are less inluenced by day-to-day rainfall
(Kay and Nam, 2005)
(a) incidence by year
(b) incidence by month
0
1
00
2
00
3
00
4
00
C
a
s
e
i
nc
id
e
nc
e
2001 2002 2003 2004 2005 2006 2007 2008 2009 2010 2011 Month
Case incidence of dengue hospitalizations per1.000.000 pop in Can Tho province by year from 2001 - 2011
0
1
0
0
2
0
0
3
00
4
0
0
C
a
se
in
ci
d
e
nc
e
1 2 3 4 5 6 7 8 9 10 11 12
Month
Case incidence of dengue hospitalizations per 1.000.000 pop by month in Can Tho province from 2001 - 2011
Figure 1. Dengue hospitalization incidence per 1,000,000 population by year, Can Tho City (2001-2011) (a) Incidence by year; (b) incidence by month: 12 bars symbolize to the case incidence of dengue hospitalization in 12 months. In each bar, the horizontal lines represent (from the top) the maximum, the third quartile, the
(a) (b)
Mean temperature in Can Tho province by month from 2001 - 2011 Celsius
Maximum temperature in Can Tho province by month from 2001 - 2011 Celsius
Minimum temperature in Can Tho province by month from 2001 - 2011
Celsius
Mean rainfall in Can Tho province by month from 2001 - 2011 mm
Mean humidity in Can Tho province by month from 2001 - 2011 %
Figure 2. Climate variables in Can Tho by month (2001 - 2011); (a) mean temperature (°C); (b) maximum temperature (°C); (c) minimum temperature (°C); (d) mean rainfall (mm) and; (e) mean relative humidity (%).
In every igure, 12 bars symbolize the data in 12 months. In each bar, the horizontal lines represent (from the top) the maximum, the third quartile, the median, the irst quartile and the minimum of data. The shaded box represents the middle 50% of the distribution (between the irst and third quartiles). Dots symbolize to outlier
3.2.3. Humidity
Humidity was generally high, averaging 83.6±0.5% (95% CI 82.6 - 84.6%) (Fig. 2(e)). Projecting into the
future, it is dificult to assess the trajectory of relative
humidity. In earlier climate change models, relative humidity was assumed to remain constant (Dessler and Sherwood, 2009). However, Minschwaner and Dressler (2004) modelled changes in relative humidity in the upper troposphere, and discovered that relative humidity is likely to decrease slightly as temperatures rise. In addition, a study of trends in relative humidity in the USA between 1961 - 1995 showed that surface relative humidity changes varied regionally but increased slightly overall (Gaffen and Ross, 1999). Accurately modelling surface relative humidity in conjunction with other climate variables may be critical for dengue predictions in the face of climate change.
3.3. Dengue hospitalization rates and climate
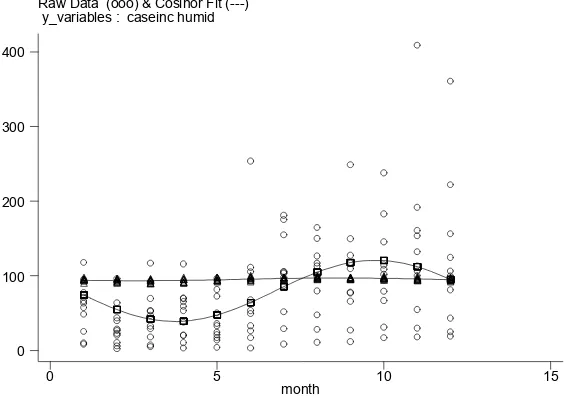
By examining dengue hospitalization rates and climate variables in a time series analysis spanning 8 years, we have shown here that dengue hospitalization rates in Can Tho are positively correlated with humidity, but not with temperature or rainfall (Fig. 3). Humidity is a key determinant of mosquito longevity (Canyon
et al., 1999). Humidity also has been associated with movement patterns of Ae. aegypti into and out of houses (Suwannachote et al., 2009). Furthermore,
Ae. aegypti fecundity has been shown to be
substantially reduced by low humidity (Canyon
et al., 1999). Experimental studies of the ability
of dengue virus to proliferate within Ae. aegypti
u n d e r v a r y i n g t e m p e r a t u r e s a n d r e l a t i v e
humidity demonstrated signiicantly higher dengue
virus titers with high humidity. This study also reinforced that mosquito survival was drastically lower in 65% vs 90% relative humidity (20-day survival: 0-45% vs. 90-93%, respectively). With higher relative humidity (90%), larvae developed more quickly, and a greater proportion of pupae emerged as adults compared to lower humidity conditions (Thu et al., 1998). Similar positive associations between relative humidity and dengue have been reported elsewhere such as, in New Caledonia, where Descloux et al. (2012) reported that a relative humidity above 95% and temperatures exceeding 32°C were important predictors of dengue outbreaks. Johansson et al. (2009) demonstrated in Puerto Rico that the effects of climate on dengue transmission are geographically variable.
A study examining regional differences in Vietnam also showed that there is substantial
heterogeneity of the inluence of weather variables on
dengue incidence. In Ho Chi Minh City (180km north of Can Tho), where dengue incidence was highest, a
signiicant positive relationship was observed between
relative humidity and dengue incidence, but not for
rainfall. A signiicant negative association was seen
for temperature and dengue incidence in this city. This was in contrast to the cooler Ha Noi capital, (1,877km north of Vietnam), where rainfall and temperature were both positively associated with dengue incidence, whereas relative humidity was negatively associated with the outcome (Vu et al., 2014).
Figure 3. Correlation between dengue hospitalization incidence and relative humidity (2001-2011) Raw Data (ooo) & Cosinor Fit (---)
y_variables : caseinc humid
month
0 5 10 15
0 100 200 300 400
Taken together, these factors may explain why
only humidity was signiicantly associated with dengue
hospitalizations. It is possible that the temperature and precipitation consistently remained within optimum range for mosquito and viral development over time,
and therefore did not reveal a signiicant association.
3.4 Predicting
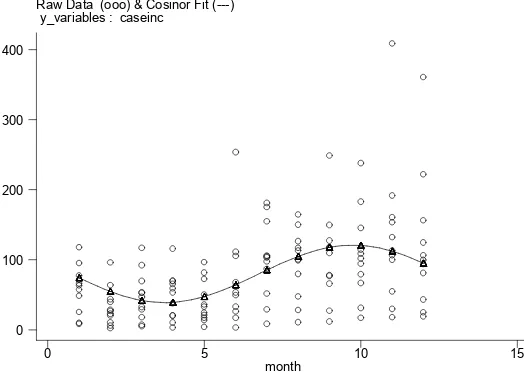
Dengue hospitalization rates by month from 2001
to 2011 were shown in a Cosinor it graph by month
(Fig. 4).The graph suggested a seasonal pattern. The Augmented Dickey-Fuller test for unit root indicated that the series was not stationary (12-month lag, MacKinnon approximate p-value for Z(t)=0.1928). The series became stationary upon differencing for seasonality (Augmented Dickey-Fuller test for unit root, 12-month lag, p-value=0.0636). Further term
selection for the ARIMA model was accomplished by examining the autocorrelation function (ACF, Fig. 5) and partial autocorrelation function (PACF, Fig. 6) structures of dengue hospitalizations. The PACF cut-off at lag 1 suggests an AR (P=1). The ACF decay at lags 1-2 or 1-3 suggests an MA (Q=2).
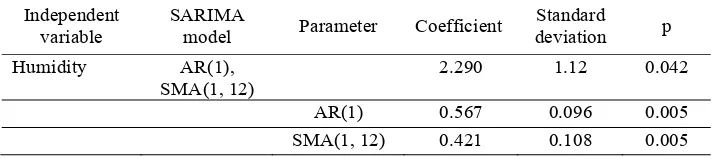
Climate variables (maximum temperature, rainfall, and humidity) were then incorporated into the model. Neither rainfall nor maximum temperature were significant, and were therefore dropped. In Table
1 relative humidity was signiicant with a lag of 1
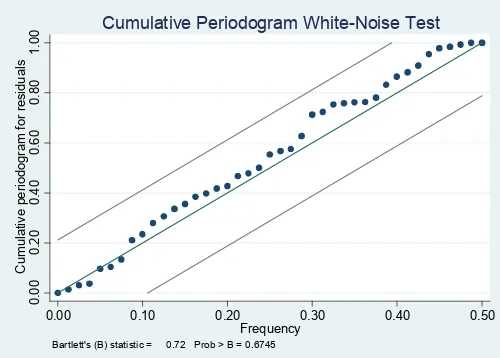
month (p=0.042). Adequacy of the ARIMA model was assessed by examining the ACF of the residuals for white noise (Portmanteau Q-statistic=37.23, p=0.50; Bartlett’s B statistic=0.72, p=0.67; Fig. 7). These suggest that the residuals are uncorrelated (white), and that the model is therefore adequate.
Figure 4. The Cosinor Fit depicts fitted monthly dengue incidence based on observations between 2001 and 2011
Raw Data (ooo) & Cosinor Fit (---) y_variables : caseinc
month
0 5 10 15
0 100 200 300 400
Figure 5. Autocorrelations of dengue hospitalization incidence per 1,000,000 population in Can Tho, 2001 - 2011, with 95% confidence intervals (shaded), and lags 1 through 40
-0
.5
0
0
.0
0
0
.5
0
1
.0
0
A
u
to
c
o
rr
el
at
ion
s
o
f
c
as
ei
n
c
0 10 20 30 40
Lag
Bartlett's formula for MA(q) 95% confidence bands
For forecasting of dengue incidence and hospitalizations in Can Tho and similar regions, future analysis could incorporate such non-weather
factors to account for the inluence of human activities
on the outcome. As climate modelling improves with the use of increasingly sophisticated tools (e.g. the Atmospheric Infrared Sounder satellite), an analysis that more accurately models changes in relative humidity in relation to rising temperature would be of value to estimate the impact of climate change on dengue incidence in this region.
4. Conclusions
This study shows that dengue hospitalization rates from 2001 - 2011 in Can Tho were positively correlated with humidity, but not with temperature or rainfall. We also have shown here that the ARIMA model-supported maximum relative humidity was
signiicant with a lag of 1 month (p=0.042) as an
important predictor for dengue hospitalizations in Can Tho, and is consistent with other studies in climatically similar areas. With further validation, this finding may improve dengue prevention and management by helping focus efforts during times of high humidity.
Acknowledgments
The authors would like express our gratitude to the Rockefeller Foundation, which funded this project to promote public health for coping with the adverse effects of climate change. We thank the Institute for Social and Environmental Transition (ISET); the Institutions on Health and Climate Change, and Can Tho Medical College, in Can Tho City; the Institute for Public Health in Ho Chi Minh. We also thank Ms. Dianne Longson and Mr. Ho Huu Tinh the volunteers who revise on the manuscript.
References
Banu S,HuW,Hurst C, Tong S.Dengue transmission in the Asia-Pacific region: impact of climate change and socio-environmental factors.Tropical Medicine and International Health, 2011; 16(5): 598-607.
Bhatt S, Gething PW, Brady OJ, Messina JP, Farlow AW, Moyes CL, Drake JM, Brownstein JS, Hoen AG, Sankoh O, Myers MF, George DB, Janisch T, William Wint GR, Simmons CP, Scott TW, Farrar JJ, Hay SI.The global distribution and burden of dengue. Nature, 2013; 496: 504-07.
Can Tho Department of Health. Five Year Report on Health Statistics (2006-2010). Can Tho City, Vietnam. 2011. Can Tho Climate Change Office. Hydrometeorological
Charts. Can Tho City,Vietnam, 2012.
Table 1. SARIMA model of dengue hospitalizations
Independent variable
SARIMA
model Parameter Coefficient
Standard
Figure 6. Partial autocorrelations of dengue hospitalization incidence/1 million population in Can Tho Province, 2001 - 2011, with 95% confidence intervals (shaded), and residual variance for lag 1 through 40
-0 95% Confidence bands [se = 1/sqrt(n)]
Can Tho Statistics Department. Socio-Economic data: annual statistics.Can Tho City, Vietnam, 2012.
Canyon DV, Hii JLK, Müller R. Adaptation of Aedes aegypti (Diptera: Culicidae) oviposition behavior in response to humidity and diet. Journal of Insect Physiology, 1999; 45(10): 959-64.
Center for Preventive Medicine of Can Tho City. Report on Preventive Medicine Activities in 2008 - Preventive Medicine Plans in 2009. Can Tho City, Vietnam, 2009. Center for Preventive Medicine of Can Tho City. Report on
Preventive Medicine Activities in 2009 - Preventive Medicine Plans in 2010. Can Tho, Vietnam, 2010. Center for Preventive Medicine of Can Tho City. Report on
Preventive Medicine Activities in 2010 - Preventive Medicine Plans in 2011. Can Tho City,Vietnam, 2011. Central Institute for Hygiene and Epidemiology. Report on
Dengue Fever Statistics; Ha Noi, Vietnam, 2010. Descloux E, Mangeas M, Menkes CE, Lengaigne M, Leroy
A, Tehei T, Guillaumot L, Teurlai M, Gourinat AC, Benzler J, Pfannstiel A, Grangeon JP, Degallier N, L a m b a l l e r i e X D . C l i m a t e - b a s e d m o d e l s f o r understanding and forecasting dengue epidemics. PLoS Neglected Tropical Diseases 2012; 6(2): e1470. Dessler AE, Sherwood SC. Atmospheric science. A matter
of humidity. Science, 2009; 323(5917): 1020-21. Gaffen DJ, Ross RJ.Climatology and trends of US surface
humidity and temperature. Journal of Climate, 1999; 12: 811-28.
Gharbi M, Quenel P, Gustave J, Cassadou S, La Ruche G, Girdary L, Marrama L. Time series analysis of dengue incidence in Guadeloupe, French West Indies: forecasting models using climate variables as predictors. BMC Infectious Disesses, 2011; 11: 166.
Helfenstein U.Box-Jenkins modelling in medical research. Statistical Methods in Medical Research, 1996; 5(1): 3-22.
Johansson MA, Dominici F, Glass GE.Local and global effects of climate on dengue transmission in Puerto
Rico. PLoS Neglected Tropical Diseases, 2009; 3(2): e382.
Kay B, Nam VS. New strategy against Aedes aegypti in Vietnam. The Lancet, 2005; 365(9459): 613-17. Minschwaner K,Dessler AE.Water vapor feedback in the
tropical upper troposphere: model results and observations. Journal of Climate, 2004; 17: 1272-82. Pham HV, Doan HT, Phan TT, Minh NN.Ecological
factors associated with dengue fever in a Central Highlands province, Vietnam. BMC Infectious Disesses2011; 11: 172.
Rigau-Pérez JG. Severe dengue: the need for new case definitions. The Lancet Infectious Diseases, 2006; 6: 297-302.
Schwartz LM, Halloran ME, Durbin AP, Longini IM Jr. The dengue vaccine pipeline: implications for the future of dengue control. Vaccine, 2015; 33(29): 3293-98. Suwannachote N, Grieco JP, Achee NL, SuwonkerdW,
Wongtong S, Chareonviriyaphap T. Effects of environmental conditions on the movement patterns of Aedes aegypti (Diptera: Culicidae) into and out of experimental huts in Thailand. Journal of Vector Ecology, 2009; 34(2): 267-75.
Thai KT, Anders KL. The role of climate variability and change in the transmission dynamics and geographic distribution of dengue. Experimental Biology and Medicine, 2011; 236(8): 944-54.
Thai KTD, Cazelles B, Nguyen NV, Vo LT, Boni MF, Farrar J, Simmons CP, van Doorn HR, de Vries PJ. Dengue dynamics in Binh Thuan province, southern Vietnam: periodicity, synchronicity and climate variability. PLoS Neglected Tropical Diseases, 2010; 4(7): e747. Thu HM, Aye KM, Thein S.The effect of temperature and
humidity on dengue virus propagation in Aedes aegypti mosquitos. The Southeast Asian Journalof
Tropical Medicine and Public Health, 1998; 29(2): 280-84.
Figure 7. Cumulative periodogram of white noise for residuals
0.
0.00 0.10 0.20 0.30 0.40 0.50
Frequency Bartlett's (B) statistic = 0.72 Prob > B = 0.6745
Vu H, OkumuraJ, Hashizume M, Tran DN, Yamamoto T.Regional differences in the growing incidence of dengue Fever in Vietnam explained by weather variability.Tropical Medicine and Health, 2014; 42 (1): 25-33.
Watts DM, Burke DS, Harrison BA, Whitmire RE, NisalakA. Effect of temperature on the vector efficiency of Aedes aegypti for dengue 2 virus. The American Journalof Tropical Medicine and Hygiene, 1987; 36(1): 143-52.
World Bank.Climate change knowledge portal for development practitioners and policy makers [homepage on the Internet], 2015. [cited 2015 May 20]. Available from: http://sdwebx.worldbank.org/climate portal/index.cfm?page=global_map.
World Health Organization (WHO). Dengue: guidelines for diagnosis, treatment, prevention and control-New edition, 2009.
World Health Organization (WHO). Action against dengue: dengue day campaigns across Asia, 2011.
World Health Organization (WHO). Dengue vaccine research[homepage on the Internet], 2016. [cited 2016 April 2]. Available from:http://www.who.int/ immunization/research/development/dengue_ vaccines/en/.
Received 22 April 2016 Accepted 27 May 2016
Correspondence to
Dr. Nguyen P. Toai
Department of Research and International relations, Can Tho Medical College,
340 Nguyen van Cu street, Can Tho city,
Vietnam