VISUALIZATION AND ANALYSIS OF LIGHT POLLUTION: A CASE STUDY
IN HONG KONG
B. Wu*, H. Wong
Dept. of Land Surveying & Geo-Informatics, The Hong Kong Polytechnic University, Hung Hom, Kowloon, Hong
Kong – [email protected]
Commission II, WG II/6
KEY WORDS: Light Pollution, Visualization, Analysis, Environment, Social-Economic factor
ABSTRACT:
The effects of light pollution problems in metropolitan areas are investigated in this study. Areas of Hong Kong are used as the source of three typical study cases. One case represents the regional scale, a second represents the district scale, and a third represents the street scale. Two light pollution parameters, Night Sky Brightness (NSB) and Street Light Level (SLL), are the focus of the analyses. Light pollution visualization approaches in relation to the different scales include various light pollution maps. They provide straightforward presentations of the light pollution situations in the study areas. The relationship between light pollution and several social-economic factors such as land use, household income, and types of outdoor lighting in the scale areas given, are examined. Results show that: (1) Land use may be one factor affecting light pollution in the regional scale; (2) A relatively strong correlation exists between light pollution and household income in the district scale; (3) The heaviest light pollution in the street scale is created by spotlights and also the different types of lighting from shops. The impact of the latter is in relation to the shop profile and size.
* Corresponding author.
1. INTRODUCTION
The use of artificial electric lighting has been increasing rapidly since the invention of light bulbs approximately 150 years ago. Artificial lighting allows humans to adapt to 24-hours activity and dramatically facilitates both social and industrial progresses. Artificial lighting has become an indispensable element of modern civilized societies for safety, recreation, decorating, and many other purposes. However, due to such factors as inappropriate design in some lighting systems, the impact of artificial light can sometimes negatively affect the people and situations it was intended to benefit. Such negative effects, can impact human health, the environment and also through wastage, inhibit worldwide sustainable development (Roach and Gordon, 1973; HCN, 2000; Salmon, 2003; Rich and Longcore, 2005; Chu and Chan, 2008; Pun and So, 2009; Chu et al., 2009; Zhang, 2011). Light pollution is getting more concerns nowadays, especially in metropolitan areas.
Light pollution refers to any adverse effect of artificial light and has many varieties. It includes sky glow, glare, light trespass, and light clutter (IDSA, 2010). These features not only can impact health but often can decrease night-time visibility. Energy wastage is another effect. Sky glow is evident as a haze in the atmosphere above towns and cities and is caused by moonlight or artificial lighting directly shining towards the sky,
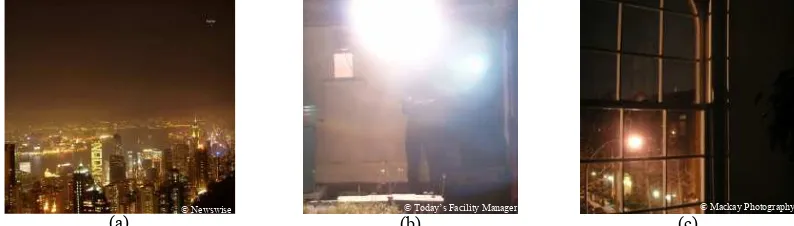
blocking natural appearance of the night sky. Figure 1(a) gives an example of sky glow in Hong Kong. Light, described as “glare”, is that light which is found to be too bright, causing discomfort and a decrease in the ability to identify specific features. An example is provided by Figure 1(b) which shows light that is so bright that the face of the man in the picture cannot be determined. Light trespass describes light, such as street lighting, that passes through neighbouring properties and enters such as a neighbouring flat. This situation is illustrated in Figure 1(c) which shows the streetlight shining into, and partly illuminating the interior of a home.
Thus, it is seen that lighting systems, designed and positioned inappropriately can become a source of light pollution. The main sources of light pollution are provided by artificial lighting such as street lamps, neon signs, and illuminated signboards (Pun and So, 2009), the greater the volume of light, the greater the pollution. As indicated above, some streetlights installed on walls are often too close to the windows of residential buildings and such light negatively impacts people living in those buildings. Another disturbing example of light pollution is provided by shop owners who, in order to attract more customers, increase the light levels of signboards. There are indications that light pollution is at the root of many problems. Firstly, such pollution is thought to have an adverse impact on humans, both physically and mentally (HCN, 2000).
(a) (b) (c)
Figure 1. Examples of light pollution. (a) Sky glow in Hong Kong, (b) glare, and (c) light trespass
© Newswise © Today’s Facility Manager © Mackay Photography
For instance when people cannot achieve a satisfactory sleeping environment through the intrusion of light at night, irritability, tiredness and nervousness may be evident in their demeanour and behaviour during the following day and more significantly their immunity to disease may decrease. Secondly, light pollution may have adverse effects on the environment and ecosystems (Salmon, 2003). Excessive outdoor lighting may disorientate physiological cycles and the movement of animals (Rich and Longcore, 2005). Thirdly light pollution may negatively affect the study of astronomy (Chu and Chan, 2008), as artificial lighting and the resulting glare and sky glow may decrease the contrast between the dark sky and the stars and planets to be investigated (Chu and Chan, 2008). Lastly, worthless lighting wastes energy and money and as such, negatively affects the sustainable development, for which civilised societies are striving.
Various light pollution studies have been carried out worldwide over the past two decades. Previous studies have revealed that Night Sky Brightness (NSB) is the key environmental indicator of large scale light pollution (Benn and Ellison, 1998; Cinzano, 2005). Kosai et al. (1992) used unaided eye estimates and astronomical photographs to measure the NSB level of Japan, and produced a detailed light pollution map. Burton and Gural (1996) presented an unaided-eye limited visual magnitude contour map of the Washington, D.C. area in the United States (US), using a similar method. The Island Astronomy Institute produced a 2D map showing the degree of light pollution above and on Mount Desert Island in the US (IAI, 2008), derived from 140 field measurements of NSB values using a Sky Quality Meter. This study found that light pollution is serious in the commercial district of the island. Spatial analysis techniques have been used to examine the relationship between light pollution and other factors such as land use. Zhang (2011) presented a light pollution study in the Macau casino regions. The light pollution in these areas came from the casino advertising boards was investigated and the impact was shown in 3D building models.
Previous light pollution studies were mostly focused on regional or sub-regional areas. Past research works have rarely emphasized on light pollution in small scale areas (e.g., district or street levels). This study investigates the light pollution problem across different spatial scales including regional scale, district scale, and street scale in metropolitan areas, which has not been systematically studied before.
2. OVERVIEW OF LIGHT POLLUTION IN HONG
KONG
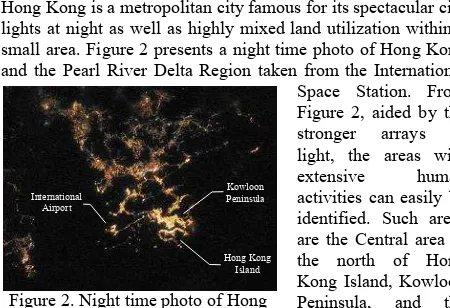
Hong Kong is a metropolitan city famous for its spectacular city lights at night as well as highly mixed land utilization within a small area. Figure 2 presents a night time photo of Hong Kong and the Pearl River Delta Region taken from the International Space Station. From Figure 2, aided by the stronger arrays of light, the areas with extensive human activities can easily be identified. Such areas are the Central area in the north of Hong Kong Island, Kowloon Peninsula, and the International Airport.
The implication of this finding is that sky brightness is closely related to centres of population.
Currently, in Hong Kong, there are no regulations to restrain light pollution. However, an increase in the trend of light pollution complaints from citizens has been recorded by the Hong Kong Environmental Protection Department (Figure 3). The number of recorded complaints in 2008 was 82, which is over twice the number (40) recorded in 2007. The number in 2009 increased to 213, which is 2.6 times that of 2008. The light pollution problem in Hong Kong, on the basis of these statistics, appears to have become more serious in recent years.
Ye
N
e
Figure 3. Complaints about light pollution in Hong Kong (Source: Environmental Protection Department of Hong Kong)
Friends of the Earth (Hong Kong), stimulated by the complaints from the general public regarding lighting abuse, produced a light pollution map of Hong Kong (FoE, 2009). The general public, through the internet, can complain for specific black spots of heavily light polluted areas. After investigation, once the black spots have been confirmed, they are displayed on a dedicated map. Thus, the general public, by this means, can be made aware of the location and descriptive density of the light pollution situation in specific areas. This map shows that the most heavily light polluted sites are located in urban area or new towns.
In May 2009, the first systematic investigation of light pollution in Hong Kong was conducted by Pun and So (2009). The NSB (Night Sky Brightness) values over Hong Kong at different sites were measured over the period of a year. The investigative results show the light pollution in Hong Kong to be severe. Urban night skies were, on average, 100 times brighter than those of the darkest rural sites. The likely indication is that high population and subsequent high lighting densities in densely urbanized areas are responsible for the severe light, for instance, on the Kowloon Peninsula and in Wan Chai on Hong Kong Island, the night sky can be over 500 times brighter than the darkest sites in Hong Kong, such as eastern Sai Kung and southern Lantau. Given the already recorded anecdotal evidence of the negative impact of unfettered light on society, this huge difference in the brightness or glow in the night sky between urban and rural locations, provides strong evidence and impetus, to support the development of regulations on the usage of external lighting in Hong Kong (Pun and So, 2009).
The evidence offered by previous research is of great value in establishing a basic understanding of light pollution conditions in Hong Kong. However, there is little study of small scale light pollution as well as a detailed analysis of the light pollution and its relationship with social-economic factors in Hong Kong. Findings relating to the latter are critical as regards the development of regulations to alleviate light pollution and related negative effects in Hong Kong.
Figure 2. Night time photo of Hong Kong (Credit: NASA)
Hong Kong Island Kowloon Peninsula International
Airport
3. VISUALIZATION AND ANALYSIS OF LIGHT POLLUTION IN HONG KONG
This paper studies light pollution in Hong Kong, in relation to different spatial scales (i.e., regional scale, district scale, and street scale), through analytical and visualization techniques. The relationship between light pollution and several social-economic factors (see Table 1), are examined. The analysis factors are selected by referring to previous research works (IAI, 2008; Pun and So, 2009; Zhang, 2011) and from those social-economic factors which are instinctively most relevant and important ones related to different scales. The light levels in this study are measured during the typical time periods in the night, which are considered to be able to represent the most significant light pollution situations.
Regional scale District scale Street scale Land use Building height Types of shops Household
income
Floor areas of the buildings
Types of outdoor lightings Household income Types of streets Table 1. Factors analysed at different spatial scales
3.1 Regional Scale
3.1.1 Study Area and Light Pollution Measurement
In order to investigate light pollution levels in the Hong Kong region, three typical areas were selected for detailed analysis. They are: Mong Kok which is the most commercialized area on the Kowloon Peninsula, Whampoa Garden in the south of Kowloon Peninsula which is a typical residential community in the coastal area, and Chai Wan in the northeast of Hong Kong Island which is a residential area at the hill foot. Figure 4 shows the distribution of the study areas.
Figure 4. Locations of study areas and NSB measurements for regional scale analysis
Night Sky Brightness (NSB) is used in this study to represent the night brightness of the sky. The unit of NSB is Magnitude per Arc Second Square (mag/arcsec2). A Sky Quality Meter – L is employed to measure the NSB values in the three selected areas. The specific locations of NSB measurements in each study area were sampled based on street blocks. In each street block, one sample site was randomly selected. A total of 27 sites were selected for the three areas. Field measurements at the 27 sites were conducted on nights with clear sky and less Moonlight since heavy cloud coverage and moonlight affect NSB readings. Four NSB readings were taken at each measurement site. They were then averaged and used as to give
the sky brightness of that site. Figure 4 presents the NSB values at these measurement sites: dark yellow indicates small NSB readings (heavy light pollution) and light yellow large NSB readings (low light pollution).
3.1.2 Light Pollution and Land Use in Regional Scale
A comparison of the three areas (Figure 4) reveals that light pollution in the Mong Kok area to be the worst, and less than that in Whampoa Garden. Light pollution in Chai Wan was found to be the lightest. In general, these variations can be explained by the area’s land use patterns. The map of Land Utilization in Hong Kong (1:75,000) released by the Planning Department of Hong Kong Government was used here to show the land use patterns in the study areas.
Mong Kok is a heavily commercialised area, with many light sources, such as neon signboards, shop lights, and spots-lights from the shopping malls and hence heavy light pollution. Whampoa Garden and Chai Wan are residential areas near the sea or hills, light sources in these areas are less and human activities are insignificant at night-time. The highest NSB (lowest light pollution) in Whampoa Garden was recorded from the waterfront promenade, an area designated as recreational land. The highest NSB in Chai Wan was also collected from this type of land designated for this type of use (Chai Wan Park). Besides, the light pollution is heavier in residential area than in recreational area in both Whampoa Garden and Chai Wan. The NSB readings are lower (stands for higher light pollution) in residential buildings in Whampoa Garden located near the waterfront promenade and housing estate located around 200-300m from coastline in Chai Wan than the recreational areas in the two places. This means the sky is darker in recreational areas and there is less light pollution when compared with residential areas.
From the analysis above, there appears to be certain relationship between the land use pattern and light pollution in regional scale. More light pollution is evident in commercial areas, followed by that in residential areas. The light pollution in residential areas is higher than that in recreational areas. This study also investigated the influences of household income on light pollution in the regional scale. But no obvious relationships have been found between the light pollution and household income for the three study areas mentioned above.
3.2 District Scale
3.2.1 Study Area and Light Pollution Measurement
Mong Kok on the Kowloon Peninsula, one of the most commercialized areas in Hong Kong was, selected for a detailed investigation and analysis of light pollution on a district scale. The district of Mong Kok is characterized by a mixture of old and new multi-story buildings, with shops and restaurants at street level and commercial or residential units on the floors above. The major industries in Mong Kok are retail, restaurants and entertainment. According to the Guinness World Records, Mong Kok has the highest population density in the world (mean 130,000 per km2). It is one of the most highly illuminated areas in Hong Kong (Figure 2).
Figure 5 illustrates the map of the Mong Kok study area. A regular grid sampling method was applied to select sites for NSB measurement, using the Sky Quality Meter – L. Since the light level in the study area is relatively high at night, field
Legend NSB g e
Kowloon Peninsula
Hong Kong Island
Whampoa Garden
Chai Wan Mong Kok
measurements were conducted after 23:00 hours. A total of 45 field measurements were collected, 39 sites which were used to generate a NSB map and 6 were selected for accuracy checking in the generation of a light pollution map. The location of each site is shown in Figure 5 using respective circles and triangles.
Figure 5. Sites for NSB measurement in Mong Kok
3.2.2 Light Pollution Map Generation and Visualization
A light pollution map was interpolated from the NSB measurements and is shown in Figure 6. A triangulated irregular network method was employed for the interpolation since the measurement locations are irregularly distributed (Chang, 2006). Figure 6 shows the 2D view of the map. In Figure 6, the high NSB value indicates less light pollution.
The six checking sites were used to evaluate the accuracy of the light pollution map. The values of the six checking sites, interpolated from the map were compared with the values directly from the Sky Quality Meter – L results. The results are shown in Table 2.
Site Interpolated value (mag/arcsec2)
Measured value
(mag/arcsec2) Difference
1 14.49 14.60 +0.11
2 14.77 14.55 -0.22
3 13.84 14.29 +0.45
4 13.88 13.99 +0.11
5 14.18 14.52 +0.34
6 14.32 14.24 -0.08
Table 2. Differences between the interpolated values and the measured values from the checking sites
From Table 2, it is seen that the differences between the interpolated values from the map and the directly measured values are relatively small. The maximum difference is 0.45 mag/arcsec2 and the minimum difference is -0.22. The mean and median of the difference are 0.12 and 0.11, respectively, and the standard deviation is 0.23. This indicates that the generated light pollution map is worthy of further analysis.
Legend
Study area NSB E e i
Figure 6. Light pollution map in Mong Kok district
3.2.3 Analysis of District Scale Light Pollution
(1) Relationship between NSB and building height
The centroids of each building in the study area were first identified. The NSB values associated with these centroids were then interpolated from the pre-generated light pollution map. These values were used to represent the light pollution associated with each building. Regression analysis was applied to further examine the relationship between the light pollution of each building and the layout specifications (building height, floor perimeter, gross floor area) of the buildings.
The analysis identified almost no relationship between light pollution and the floor perimeter or the gross floor area of the buildings. A weak relationship was found between the light pollution and building height (number of floors) (Figure 7).
Figure 7. Relationship between NSB and building height (number of floors) in district scale (R2 = 0.16)
Figure 7 shows a weak correlation (R2
= 0.16) between the light pollution and the building height. In general, the higher the building (more floors), the lower the NSB values (more light pollution). A possible explanation is that a greater number of lighting sources shine towards the sky.
(2) Relationship between NSB and household income
Household income data from the 2006 Population By-Census were used for light pollution analysis. The average household income data was provided for each street block and there are total 18 street blocks involved in the analysis. Figure 8 gives examples of the street block partition (by dashed lines) and the associated average household income in the study area. The average NSB value of the buildings composing each street block was adopted as the light pollution of the street block. A regression analysis was again applied to find the relationship between light pollution and district scale household incomes. Figure 9 shows the results.
Figure 8. Street block partition (by dashed lines) and the associated average household income data
Figure 9 shows that there is a relatively strong correlation (R2 = 0.68) between light pollution and household income in the district scale region than that in the regional scale as discussed in the previous section. In general, the greater the household
Number of Floors
BSN
Checking sites Measurement
sites
Mong Kok
income, the larger the NSB values (less light pollutions). In the field survey when measuring the light levels, it is observed that there are more open spaces and less commercial places in the high income areas, which may lead to less population density and outdoor lighting sources in these areas.
14.00 14.20 14.40 14.60 14.80 15.00
0 10000 20000 30000 40000 50000 60000 70000 80000
Median monthly domestic household income
NS
B
Figure 9. Relationship between NSB and household income in district scale (R2 = 0.68)
3.3 Street Scale
3.3.1 Study Area and Light Pollution Measurement
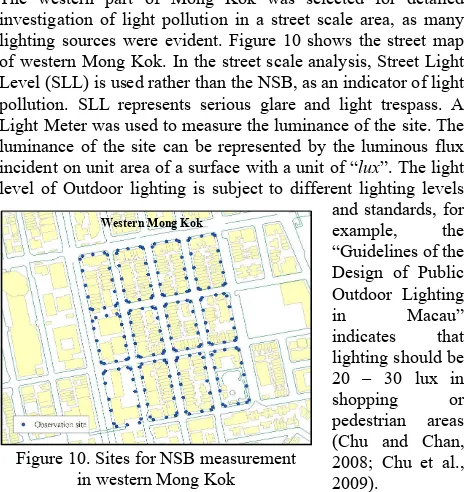
The western part of Mong Kok was selected for detailed investigation of light pollution in a street scale area, as many lighting sources were evident. Figure 10 shows the street map of western Mong Kok. In the street scale analysis, Street Light Level (SLL) is used rather than the NSB, as an indicator of light pollution. SLL represents serious glare and light trespass. A Light Meter was used to measure the luminance of the site. The luminance of the site can be represented by the luminous flux incident on unit area of a surface with a unit of “lux”. The light level of Outdoor lighting is subject to different lighting levels and standards, for example, the “Guidelines of the Design of Public Outdoor Lighting in Macau” indicates that lighting should be 20 – 30 lux in shopping or pedestrian areas (Chu and Chan, 2008; Chu et al., 2009).
Since street light levels vary in relatively small regions, thus SLL data has to be collected by dense sampling. A total of 192 sites were identified and are shown as dots in Figure 10. At each site, four SLL readings were taken and the average of four readings was used for the SLL site value. The measurements were conducted in a time slot from 20:00 to 22:15. This is because this time period is normally within the opening hours for all types of shops, and it is the busiest period for commercial activities in the night which may lead to the most serious light pollution problem.
3.3.2 Light Pollution Visualization in the Street Scale
As the measurement sites in this study area are digitized as points, the bar chart symbol was used to indicate the light level at each site. The height of the bar symbol represents the light level. Figure 11 gives a 2D view of the SLL map of western
Mong Kok. The area with highest SLL is located near the intersection of Sai Yeung Choi Street South and Nelson Street.
3.3.3 Analysis of
Street Scale Light Pollution
(1) Relationship between SLL and types of shops
The shop selected as a factor for analysis
was dependent upon the shops commercial type, bearing in mind that the street light level varies in accordance with the goods sold, for example the street light level of a Jewellery shop is very bright as the shop owners want to show the jewellery to its best advantage, while the light level of a café is low as customers prefer a comfortable and private place.
When measuring the street light level of each site, the types of shops on or near that site were recorded. Field investigations found that the light in shops selling jewels, electronic devices, glasses, cosmetics, and sport shoes was very bright and such shops were classified as one type in terms of light level. Other types of shops such as cafés, drug stores, and restaurants are classified as the second type. Other shops close to facilities such as parks or schools are classified as the third type. Figure 12 shows, in boxplot form, the statistics of the street light level of these three types.
Figure 12. Statistics of SLL for the three types of shops
The significant difference between the third type and the other two types is clearly seen in Figure 12. On average, the SLL values of the first type “Jewel, electronic device, and glass shops” are larger than those of the second type “Cafés and restaurants”.
(2) Relationship between SLL and types of outdoor lightings
According to the Green Sense Press Release in 2007, spotlights were one of the lighting sources that caused light pollution. When taking measurements in the field, both the various types of outdoor lighting and the street light level were recorded. Spotlights were classified as the first type. Other outdoor lighting sources were classified as the second type, and no outdoor lighting source was classified as the third type. Figure 13 shows, in boxplot form, the statistics of the street light level of these three types.
Jewel, electronic device & glass shops Cafés &
restaurants Types of shop Other shops
Max: 2810
Min: 35 Med: 468
Min: 116 Med: 824 Max: 2036
Max: 998
Med: 28 Min: 0 Figure 10. Sites for NSB measurement
in western Mong Kok Western Mong Kok
Figure 11. The 2D SLL map measured in western Mong Kok
Figure 13. Statistics of SLL for the types of outdoor lightings
It is seen from Figure 13 that the light level of these three types of lighting is different. The light level of the third type is the lowest of the three. The 75th quartile of the data is lower than the minimum value of the first and second types. The data value, larger than the 75th quartile may be due to the high light level trespassing from indoor lighting. The second type lighting is in the middle of these three types. The value of the 75th quartile is lower than the 25th quartile of the first type lighting (spotlights). This means that the value of the majority of the sample data is lower than first type lighting. The first type lighting, is obviously the highest, and was achieved only on sites where spot lights shone directly onto the pavement. The value range of the data is relatively large, quite probably due to the strength of the brightness of the spot lights.
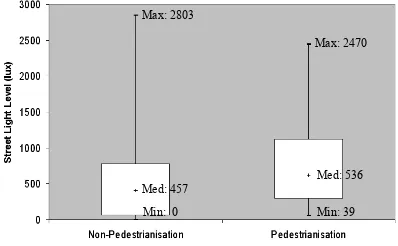
(3) Relationship between SLL and types of streets
It is believed that street light level is higher in areas of high pedestrian flow as light will be used to attract customers for commercial benefits and also for safety reasons. The streets in the study area were classified into two types: pedestrianized streets and non-pedestrianized streets. Among the 192 measurement sites in the study area, 78 sites were identified as pedestrianized and the other 114 sites were identified as non-pedestrianized. Figure 14 shows, in boxplot form, the statistics of the street light level of these two street types.
Figure 14. Statistics of SLL for the two street types
From Figure 14, the 25th and 75th percentile together with the medium of the data collected in pedestrian areas are higher than those in non-pedestrian areas, indicating that the street light level in pedestrianized street is generally higher than in non-pedestrianized streets.
4. CONCLUSIONS AND DISCUSSION
Light pollution in relation to different spatial scales has not been systematically studied in the past. This study demonstrates the application of visualization techniques and analysis of light
pollution in Hong Kong in different scale areas. The following conclusions are drawn from the experiments and analysis.
(1) In regional scale areas, land use may be one of the factors affecting the light pollution level. Commercial areas are responsible for more light pollution than residential areas, while residential areas produce greater light pollutions than recreational areas.
(2) In district scale areas, a relatively strong correlation between the light pollution and household income exists. Areas with larger household incomes create less light pollution. There is a weak correlation between light pollution and building height. Tall buildings, in general, cause more light pollutions.
(3) In street scale areas, the type of outdoor lighting may be the key factor in causing light pollution. Spotlights create the heaviest light pollution. Different types of shops also influence the extent of light pollution. The light level in streets frequented by pedestrians is generally higher than non-pedestrian roads.
The work presented in this paper is helpful for understanding the light pollution problem in Hong Kong and the research results will be helpful for the development of regulations about light pollution prevention and remediation. They will also benefit similar investigations of light pollution problem in other metropolitan areas worldwide. It should be noted that all the data analysed in this study is raw data. The quality of the data may be affected by the field environments. Future works will collect more light pollution data in different time period for a comprehensive study.
References
Benn, C., and S. Ellison, 1998. La Palma night-sky brightness, La Palma Technical Note 115.
Burton, W., and P. Gural, 1996. Sky and Telescope, 91, 82. Chu, H. K., and H. L. Chan, 2008. Dim It. Hong Kong: Enrich
Publishing Ltd.
Chu, H. K., O. C. Yuen, M. C. So, and S. L. Cheng, 2009. Day Light - Night Light. Hong Kong: Enrich Publishing Ltd. Cinzano, P., 2005. Night Sky Photometry with Sky Quality
Meter, Tech. rep., ISTIL Internal Report.
FoE (Friends of the Earth), 2009. Light Pollution Penalty-Free Record High Complaints.
HCN (Health Council of the Netherlands), 2000. Impact of outdoor lighting on man and nature, The Hague: Health Council of the Netherlands, publication no. 2000/25E. IAI (Island Astronomy Institute), 2008. Light Pollution Map of
Mount Desert Island.
IDSA (International Dark-Sky Association), 2010. Light Pollution and Safety.
Kosai, H., S. Isobe, and H. Nakayama, 1992. Sky and Telescope, 84, 564.
Pun, C. S., and C. W. So, 2009. Report of a survey of light pollution in Hong Kong. Hong Kong: Department of Physics, The University of Hong Kong.
Rich, C., and T. Longcore, 2005. Ecological consequences of articial night lighting, Island Press: Washington, US Roach, F. E., and J. L. Gordon, 1973. The light of the night sky,
Springer Science & Business, 125 p.
Salmon M., 2003. Artificial night lighting and sea turtles. Biologist, 50, 163–168.
Zhang, J., 2011. A Study of 3D GIS for Light Pollution Analysis. Master Thesis, The Hong Kong Polytechnic University. 55 p.
Max: 2803
Med: 457 Min: 0
Max: 2470
Med: 536 Min: 39
Spotlights
Type of Lighting No outdoor
lighting
Max: 2816
Min: 96 Med: 890 Max: 952
Min: 91 Med: 471 Max: 460
Med: 33 Min: 0
Other outdoor lighting sources