ANALYSIS OF LIGHT INTENSITY DATA BY THE DMSP/OLS SATELLITE IMAGE
USING EXISTING SPATIAL DATA FOR MONITORING HUMAN ACTIVITY IN JAPAN
Y. Akiyama a, *
a
Earth Observation Integration & Fusion Research Institute, The University of Tokyo,
Institute of Industrial Science Cw-503, 4-6-1, Komaba, Meguro-ku, Tokyo 153-8505, Japan [email protected]
Commission II, WG II/3
KEY WORDS: GIS, Land Use, Urban, Classification, Data mining, Comparison, Building, Vector
ABSTRACT:
The main objective of this research is to show how much can be monitored various human activities using night light images by the DMSP/OLS from NOAA/NGDC. In Japan, various human activities can be monitored easily without satellite images because we can use many kinds of detailed spatial dataset and statistics. On the other hand detailed spatial data are not developed adequately especially in developing countries. Night light images by the DMSP/OLS can help to monitor them in such countries.
Therefore we discuss how to use night light images of the DMSP/OLS for this objective in Tohoku region, Japan. Human activates were explained by 3 factors, i.e. road distribution, accumulation of buildings and dynamic population. These data and light images of the DMSP/OLS were resampled into the same aggregate unit and compared with a light intensity of the DMSP/OLS. In addition it is shown which factor of human activates explains the light intensity more clear than other factors by multiple regression analyses using all factors. Results of multiple regression analyses show that impacts by road distribution are strong in urban and suburban areas and impacts by building are strong in rural areas. Impacts by dynamic population are weak in all areas.
Finally estimated images of light intensities were developed using results of multiple regression analysis and they were compared with the actual image of light intensity. The compared result shows that tendency of spatial distribution of the light intensity by the estimated result agrees rather well with tendency by the DMSP/OLS.
* Corresponding author. [email protected]; Tel/Fax: +81 3-5452-(6417/6414); http://shiba.iis.u-tokyo.ac.jp/member/akiyama/ 1. INTRODUCTION
Monitoring for location and shape of urban areas are very significant task for planning of urban development, disaster prevention, crime prevention and environmental problems in broad metropolitan areas. However, it is often the case that developments of basic spatial data, e.g., distributions of population or infrastructures are poor especially in developing countries (Takashima and Hayashi, 2001). Paucity of basic data is one of the major obstacles to address above problems. 1.1 Previous Studies
There are many previous studies to try to monitor locations and shapes of urban areas without dependence on existing spatial data or statistics. One of such method is to use night light images by the Defense Meteorological Satellite Program’s Operational Linescan System (DMSP/OLS) from the National
Oceanic and Atmospheric Administration’s National
Geophysical Data Center (NOAA/NGDC). For example, Imhoff et al. (1997a) and Small et al. (2005) showed distribution and expansion of urban areas in United States and some major cities around the world using DMSP/OLS images. Some studies also tried to monitor various human activities using them. For example, Elvidge et al. (1997b) showed a relationship between spatial distribution of light intensity with business activity or electricity consumption. Likewise, Dobson et al. (2000a) showed a relationship with population distribution and Ghosh et al. (2009) showed with GDP. In addition there are some studies to estimate present state of
urban areas using DMSP/OLS images. For example, Takahashi and Hayashi (2001) estimated population distribution and the number of buildings and Kohiyama et al (2000b) estimated distributions of damaged areas by earthquakes.
1.2 Objective
As stated above, many studies have monitored distributions of urban areas and estimate human activities using DMSP/OLS images. On the other hand, there are a few studies to show which kind of human activities are especially reflected in the DMSP/OLS images because of paucity of spatial data which can be used for such verifications adequately especially in developing countries. On the other hand there are many kinds of micro-accurate spatial data in Japan. It was expected to be showed that the DMPS/OLS images reflect which kinds of human activities to compare existing spatial data in Japan with DMSP/OLS images to aggregate by same spatial units. Therefore we have developed data of human activities by distributions of people, buildings and roads using existing spatial data of Japan and showed correlations between light intensity of DMSP/OLS images with them. In addition we have showed which the most affected factor for light intensity by multiple regression analyses with the light intensity and these 3 factors not only in whole study area, but also in urban, suburban and rural areas. We have already developed same kind of analyses in limited areas (Akiyama et al. (2011a), Sengoku et al. (2010)). In this paper, we have improved data of human activates and expanded study areas.
2. DATA DEVELOPMENT
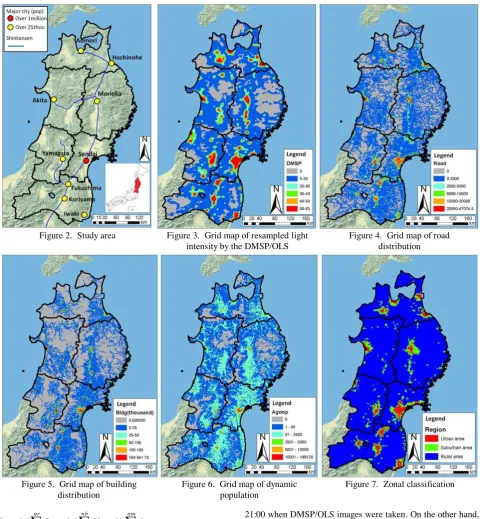
Night light images of the DMSP/OLS, road data (lines), building data (polygons) and grid data of dynamic population were aggregated into same spatial units (1km square grid). 2.1 Study Area
A study area is whole area of Tohoku region, Japan (Figure 2). Tohoku region is located in northeast part of Japan. The total area is about 6.69km2 and population is about 9.2 million. The largest city is Sendai city (population is about 1.05million) and many major cities are connected by the Shinkansen (bullet train). There are relatively broad suburban areas adjoined major cities. In addition there are many small cities (under 10 thousand population). On the other hand, there are broad depopulated rural areas and mountain forest areas. As a result we decided that this area is an appropriate area for our study. 2.2 Aggregate Unit
An aggregate unit is the 1km-square grids called Japanese standard regional mesh (Hyojun Chiiki Mesh in Japanese; It is
described the “Regional Mesh” in following text.). Many statistical grid data in Japan are aggregated into this grid. There are 69,814 grids in Tohoku region.
2.3 Resampling of DMPS/OLS Images degree of longitude and latitude around the centroid of Tohoku region (E140.62, N39.17, wgs1984) is approximately 98784.40m, and 30 arcseconds is approximately 823.20m. The pixel size and the pixel shape of the DMSP/OLS discord the Figure 3 shows a grid map of resampled light intensity by NVi.
2.4 Development of Road Grid Data
Road line data of highway, main road and other road in Tohoku region was developed by the national census map data in 2005 provided by Center for Spatial Information Science, The University of Tokyo. Total road length of 3 kind of road in each Regional Mesh was calculated to divide all road line data by the Regional Mesh polygons. Average luminance of road surface in Japan is set as Table 1 by Japan Road Association (2007). RA in table 1 means road with continuous light,
Figure 1. Spatial gap between DMSP/OLS pixels and the Regional Meshes
RB means with intermittent light, and RC means with few light
affecting road traffic. Values in parentheses are road with light blocking structures on median zone. Values in Table 2 are decided by Table 1. In urban area, this value set as large as possible and in rural area, it set as small as possible.*1 in Table 2 are 0 in Table 1, however they are set 0.1 in this study because it is expected that they emit a weak light from street lamps in some intersections. Estimated light intensity by road in each Regional Mesh is defined as equation 3 based on road length in each Regional Mesh and values in Table 2.
Road type External condition (cd/m2)
RA RB RC
Highway (RH) 1.0 1.0 (0.7) 0.7 (0.5)
Main road(RM) 1.0 (0.7) 0.7 (0.5) 0.5 (0)
Other road(RO) 0.7 (0.5) 0.5 (0) 0.5 (0)
Table 1. Average luminance of road surface in Japan
Road type Region type
Urban Suburban Rural
Highway (RH) 1.0 1.0 0.5
Main road(RM) 1.0 0.7 - (*1)
Other road(RO) 0.7 - (*1) - (*1)
Table 2. Luminance of road in this study 2.5 Development of Building Grid Data
Digital residential maps in 2008 (ZmapTOWN II, by ZENRIN CO., LTD) were used as building distribution data. Locations, shapes, areas and kinds of building everywhere in Japan can be collected using this data. The kinds of building means an application which contains residential buildings, multi-tenant buildings, shop and office buildings, warehouses and car garages. In addition, we can monitor applications of each floor or room (shops and offices, residential rooms and others which contain vacant rooms) in the case of multi-tenant buildings. At first, point data of all building centroids in Tohoku region were developed. Secondly, warehouses and car garages were removed because it is considered that these kinds of buildings are not illuminant. Finally areas of illuminant building in each grid are defined as Equation 4.
(4)
where Srk is an area of residential buildings, nr is the number
of residential buildings, Sbk and nb are shop and office
buildings, Smk and nm are multi-tenant buildings, and Sn is an
estimate light intensity by illuminant buildings of grid n. In addition, Vk is defined as equation 5.
(5) where Rk is the number of rooms in building k, Rrk is the
number of residential rooms, and Rbk is the number of shop
and office rooms.
Residential buildings and rooms (Srk and Rrk) are multiplied by
0.5 because it is considered that light intensity by residential uses is smaller than other kinds of uses between 20:00 and
21:00 when DMSP/OLS images were taken. On the other hand, shops and offices (Sbk and Rbk) are multiplied by 2.0 because it
is considered that these kinds of uses are in business and light intensity is larger than other kinds of uses in this time. Figure 5 shows a grid map of building distribution in Tohoku region. 2.6 Development of Dynamic Population Grid Data
The Agoop Data in 2009 (AGOOP Corp.) were used as distribution data of dynamic population. Estimated dynamic populations in each month and each hour can be monitored by the unit of the Regional Mesh using this data. The estimated fluid population means the average hourly number of people located in each Regional Mesh. In this study the Agoop Data between 20:00 and 21:00 were used because image opportunities of the DMSP/OLS are also between 20:00 and 21:00. In addition, another kind of data which can monitor
nr
k
nb
k
nm
k k k k k
n Sr Sb V Sm
S
1 1 1
0 . 2 5
. 0
k k k
k
R Rb Rr
V 0.5 2.0
Figure 4. Grid map of road distribution
Figure 7. Zonal classification Figure 2. Study area Figure 3. Grid map of resampled light
intensity by the DMSP/OLS
Figure 5. Grid map of building distribution
Figure 6. Grid map of dynamic population
dynamic population of Japan is the Person Trip Data. Source data of them were acquired between October and November because this season is regarded as best season for explorations of person flow (Hukumoto and Nakamura, 2011b). Therefore we also used the Agoop Data in October. Figure 6 shows a grid map of dynamic population in Tohoku region.
2.7 Zonal Classification of the Regional Mesh
Finally all grids were classified into urban areas, suburban areas and rural areas using polygon data of urban areas from the Digital National Land Information of Japan in 2006. Distributions of urban area which means urbanization promoting area, suburban area which contains urbanization control area and areas of some small cities, and other area, i.e., rural and mountainous areas defined by the National Land Use Planning Act of Japan can be monitored using them. Zonal classifications of all grids were realized shown as Figure 7 to integrate these polygon data with the Regional Mesh.
3. RESULTS OF CORRELATION ANALYSIS shows in suburban areas and Table 6 shows in rural areas. On whole area of Tohoku region, road and building distributions have relatively strong correlation with the DMSP/OLS light intensity. However a correlation between dynamic population and light intensity is weak.
On the other hand, region-by-region characteristics can be shown by Table 4, Table 5, and Table 6. Though urban areas show same tendency in whole area, correlation coefficients of each 3 factor with the DMSP/OLS are smaller than them in whole area. This is because light intensity by the DMSP/OLS on urban areas tends to be homogeneously-large and it cannot monitor actual distributions of road and building adequately. On the other hand, correlation coefficients of each 3 factor with the DMSP/OLS are relatively large especially in road and building distributions in suburban areas. Light intensity of the DMSP/OLS can monitor road and building distributions in suburban areas with relatively high reliability. Rural areas also show the same tendency as suburban areas without dynamic poopulation. Correlation coefficient of dynamic population decreases. This is because night time dynamic population is very small in rural areas (Figure 6 also shows there are many grids which have less than 50 persons in rural areas).
4. RESULTS OF MULTIPLE REGRESSION ANALYSIS
We made multiple regression analyses. A dependent variable is night light intensity of the DMSP/OLS and independent variables are 3 factors. There are some previous studies to use the multiple regression analysis for processing and analyses of satellite images. Many of them used the multiple regression analysis to obtain significant objective variables to integrate satellite images with other spatial data (e.g., Nakamura and Kawashima, 1999a and Schneider et al., 2003). On the other hand, this study evaluates performance of satellite images using other spatial data. Especially there are a few studies to evaluate the performance of DMSP/OLS images by multiple regression analyses to use detailed spatial data as independent variables.
Population 0.3615 0.4733 0.6659 1.0000 Table 3. Correlation table in whole area of Tohoku region Number of
Population 0.2584 0.3690 0.6003 1.0000 Table 4. Correlation table in urban area of Tohoku region Number of
Population 0.5336 0.3424 0.8382 1.0000 Table 5. Correlation table in suburban area of Tohoku region Number of
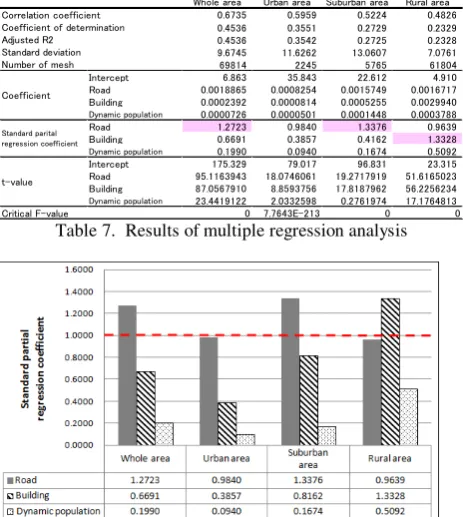
Population 0.3552 0.2618 0.7499 1.0000 Table 6. Correlation table in rural area of Tohoku region Table 7 shows results of multiple regression analysis and Figure 8 shows standard partial regression coefficients of 3 factors in each area. Significance levels of all analyses are 95%. Without rural area, road distributions have the strongest impact on the light intensity significantly and impacts by dynamic population are weak in whole area. In addition, urban areas denote the same tendency of whole area. On the other hand, impacts by building distribution increase with translation to suburban areas and they become the strongest factor in rural areas.
As a result, impacts by road distribution are strong in urban and suburban areas. It means that lights from cars and night illuminations on road affect the light intensity of DMSP/OLS. Impacts by building distribution become strong in suburban and rural areas. This is because lights from large-scale factories in suburban areas, rural areas, and waterfront areas and large-scale commercial facilities in suburban areas affect the light intensity and impacts by building become relatively large. There are few affects by dynamic populations. It means that there are not necessarily many people in areas with strong light intensity.
This result need to be improved because some standard partial regression coefficients are over 1.0 (values in pink cells in Table 7). This is because correlation between independent variables is strong (i.e. multicollinearity). For example, road value in whole area is over 1.0 (1.2723) because correlation between road and building value is strong shown as Table 3. It is expected that this problem will be resolved to improve calculation methods of independent variables, to remove variables which have strong correlation with other variables, and to use other new variables.
Whole area Urban area Suburban area Rural area 0.6735 0.5959 0.5224 0.4826 0.4536 0.3551 0.2729 0.2329 0.4536 0.3542 0.2725 0.2328 9.6745 11.6262 13.0607 7.0761
69814 2245 5765 61804
Intercept 6.863 35.843 22.612 4.910
Road 0.0018865 0.0008254 0.0015749 0.0016717 Building 0.0002392 0.0000814 0.0005255 0.0029940
Dynamic population 0.0000726 0.0000501 0.0001448 0.0003788
Road 1.2723 0.9840 1.3376 0.9639
Building 0.6691 0.3857 0.4162 1.3328
Dynamic population 0.1990 0.0940 0.1674 0.5092 Intercept 175.329 79.017 96.831 23.315 Road 95.1163943 18.0746061 19.2717919 51.6165023 Building 87.0567910 8.8593756 17.8187962 56.2256234
Dynamic population 23.4419122 2.0332598 0.2761974 17.1764813
Critical F-value 0 7.7643E-213 0 0
Standard deviation Number of mesh
Coefficient
Standard parital regression coefficient
t-value
Correlation coefficient Coefficient of determination Adjusted R2
Table 7. Results of multiple regression analysis
Figure 8. Standard partial regression coefficients in each area 5. COMPARISON RESULT BETWEEN ACTUAL AND
ESTIMATED LIGHT INTENSITIES
Estimated light intensities in all Regional Meshes were calculated using results of multiple regression analysis in whole, urban, suburban and rural areas of Tohoku region, and they were compared with the light intensity of the DMSP/OLS. Estimated light intensities calculated by the result of whole area and urban (or suburban and rural) areas were developed in each grid and the estimated light intensity which has smaller residual error was employed.
Figure 9 shows the result of estimated light intensity. Tendency of spatial distribution of the light intensity by the estimated result agrees rather well with tendency by
DMSP/OLS to compare Figure 9 to Figure 3. Figure 10 shows correlative relationship between actual light intensity by DMSP/OLS with estimated intensity in each grid. The light intensity of DMSP/OLS can be reproduced to a large extent based on the road distribution, building distribution and dynamic population data.
In addition, a result of comparison between actual light intensity with estimated intensity shows interesting characteristics of DMSP/OLS images. Figure 11 shows a distribution map of the rate of residual error in each Regional Mesh. The rate of residual error is calculated by equation 6.
(6) where Vi is actual light intensity by DMSP/OLS in Regional
Mesh i, REi is the residual error between actual light intensity
and estimated light intensity, NVi is estimated light intensity
calculated by equation 1, and RREi is the rate of residual error.
There are many toroidal regions where light intensity of the DMSP/OLS is much larger than estimated intensity in suburban outskirts neighbouring of city centers. It is believed that phenomenon which the light intensity of the DMSP/OLS was saturated over sensitive ranges in urban areas was happened. Elvidge et al. (1999b) also pointed out this phenomenon. This phenomenon is especially prominent around geographically-isolated cities where there are no other cities
Figure 10. Correlation between light intensity of DMSP and estimated light intensity
Figure 9. Estimated light intensity Figure 11. Rate of residual error Figure 12. Large residual errors around cities like toroidal shape i
i i
i i i
V NV V V RE
RRE
close to them. Figure 12 shows areas where this phenomenon is clearly prominent. To monitor distributions of urban areas using DMSP/OLS images, they extract urban areas in excessive amounts in such suburban outskirts.
In addition, Figure 11 shows that there are areas where the DMSP/OLS light intensity is large though there are little distributions of road, building and dynamic population. They are distributed as dots without relying on the distribution of cities. In these areas, there are facilities which produce strong luminescence although they do not locate in urban areas. Number 1, 2, 3 and 4 in Figure 11 are examples of them. Number 1 and 2 are massive power plants (1: Fukushima Daiichi Nuclear Plant 2: Higashidori Nuclear Plant), number 3 are ski resorts, and number 4 is some golf fields with night-time illumination. Night light effect by these facilities must be considered to monitor the distribution of urban areas by the DMSP/OLS light intensity.
6. CONCLUSIONS
In this study we showed how much can be monitored various human activities using night light images of the DMSP/OLS in Tohoku region, Japan. The relationship between light intensity by the DMSP/OLS and human activities, i.e. distributions of road, building and dynamic population were analyzed. Light intensity by the DMSP/OLS correlates strongly with road distribution in urban and suburban areas and building distribution in rural areas. The correlation with dynamic population is weak in all areas. Results of multiple regression analysis showed that road distribution has a major effect on the light intensity of the DMSP/OLS in urban and suburban areas and building distribution has it in rural areas.
In addition, it was also shown that the estimated light intensity based on 3 factors can explain actual light intensity by the DMSP/OLS relatively well. It means that the light intensity by the DMSP/OLS can monitor various kinds of lights radiated by human activities appropriately. However, effects of saturated light in suburban areas near city centers and facilities which radiate strong light, e.g. massive power plants and ski resorts in rural areas should be considered.
There are some future works. We should have a review of dependent variables in multiple regression analyses and should detect new dependent variables with no multicollinearity in each area. It is also expected to solve this problem to improve methods to develop dependent variables, i.e. resampleing methods of road, building and dynamic population data into the Regional Mesh. In addition, it is needed to improve a reliability of light intensity to calibrate images of DMSP (e.g., Elvidge et al., 1999b). It is also an important challenge to make same kinds of analyses in regions which have megacities, e.g., Kanto region which contains Tokyo metropolitan area where it is suspected that the effect of saturated light is strong.
7. ACNOWLEDGEMENTS
We are contributed the digital residential maps in 2008 (ZmapTOWN II) by ZENRIN CO., LTD and the Agoop data in 2009 by Agoop Corp. We would like to thank ZENRIN CO., LTD. and Agoop Corp..
8. REFERENCE
Akiyama, Y. and Ryosuke, S., 2011a, Analysis of Light Data on the DMSP/OLS Satellite Image Using Existing Spatial Data for Monitoring Human Activity in Japan. The 32nd Asian
Conference on Remote Sensing, PS-3, 3-7.
Dobson, J. E., Bright, E. A., Coleman, P. R., Durfee, R. C. and Worley, B. A., 2000a, LandScan : a global population database for estimating populations at risk. Photogrammetric
Engineering and Remote Sensing, 66(7), pp. 849-857.
Elvidge, C. D., Baugh, K. E., Dietz, J. B., Bland, T., Sutton, P. C. and Kroehl, H. W., 1999b, Radiance calibration of DMSP-OLS low-light imaging data of human settlements. Remote
Sensing and Environment, 68, pp. 77-88.
Elvidge, C. D., Baugh, K. E., Kihn. E. A., Kroehl, H. W., Davis, E. R. and Davis, C. W., 1997b, Relation between satellite observed visible-near infrared emissions, population, economic activity and electric power consumption.
International Journal of Remote Sensing, 18(6), pp. 1373-1379.
Ghosh, T., Sutton, P., Powell, R., Anderson, S. and Elvidge, C. D., 2009, Estimation of Mexico’s informal economy using DMSP nighttime lights data. Remote Sens. 1(3), pp. 418-444. Hukumoto, H. and Nakamura, Y., 2011b, The 5th nationwide person trip survey in 2010. Traffic Engineering, 46(2), pp. 12-15 (in Japanese) .
Imhoff, M.L., Lawrence, W. T., Stutzer, D. C. and Elvidge, C. D., 1997a. A technique for using composite DMSP/OLS “city lighs” satellite data to map urban area. Remote Sensing of
Environment, 61, pp. 361-370.
Japan Road Association., 2007. Installation Criterion of Road Illumination and Discussion. Japan Road Association, pp.26-43 (in Japanese).
Kohiyama. M., Hayashi, H., Maki, N., Hashitera, S., Matsuoka, M., Kroehl, H. W., Elvidge, C. D. and Hobson, V. R., 2000b, Development of early damaged area estimation system (EDES) using DMSP/OLS nighttime imagery. Journal of Social Safety
Science, 2, pp. 79-86.
Nakamura, N. and Kawashima, S., 1999a, Relation between tea quality and environmental characteristics obtained from satellite images in a tea plantation area. Journal of Crop
Science of Japan, 68(3), pp. 424-432.
Schneider, A., Friedl, M. A. and Woodcock, C. E., 2003, Mapping urban areas by fusing multiple sources of coarse resolution remotely sensed data. Geoscience and Remote
Sensing Symposium 2003 IGARSS '03 Proceedings, 4, pp.
2623-2625.
Sengoku, H., Akiyama, Y. and Ryosuke, S., 2010, The Analysis of City Lights on DMSP/OLS Data Using Digital Telephone Data. The 31st Asian Conference on Remote
Sensing, TS15-3.
Small, C., Pozzi, F. and Elvidge, C. D., 2005. Spatial analysis of global urban extent from DMSP-OLS night lights. Remote
Sensing of Environment, 96, pp. 277-291.
Takashima, M. and Hayashi, H., 2001. Measurement model of city light distribution for the estimation of earthquake damage potential using DMSP/OLS night-time imagery: application for population estimation. Journal of Social Safety Science, 3, pp. 101-108.