LAMPIRAN I:
Pengantar Kuesioner,
Petunjuk Pengisian,
Kuesioner Penelitian
Pengantar Rotisioner
ANALISIS KUALITAS PRODUK, KUALITAS PELAYANAN, DAN HARGA TERHADAP KEPUASAN PELANGGAN
(Studi Pada Roti John Jember)
Kepada Yth.
Sdr. Pelanggan Roti John di tempat
Berkaitan dengan kegiatan penelitian yang saya lakukan dengan judul “Analisis Kualitas Produk, Kualitas Pelayanan, Dan Harga Terhadap Kepuasan Pelanggan (Studi Pada Roti John Jember” sebagai salah satu syarat untuk memperoleh gelar Sarjana Ekonomi pada Universitas Muhammadiyah Jember, maka dengan ini saya mengharapkan bantuan saudara untuk untuk mengisi daftar pertanyaan yang saya sertakan di bawah ini.
Agar memperoleh masukan yang berarti, saya berharap rotisioner ini diisi dengan keadaan yang sebenarnya. Semua sumber dan data yang diperoleh dijamin kerahasiaannya.
Atas perhatian dan bantuannya saya mengucapkan banyak terima kasih.
SAIFUL RIZAL
15.1041.1261
Petunjuk Pengisian:
Berilah tanda chek list (√) pada jawaban yang dipilih.
1. Pendapat anda sangat setuju (SS) 2. Pendapat anda setuju (S)
3. Kurang setuju (KS) 4. Tidak setuju (TS)
5. Sangat tidak setuju (STS)
Identitas responden
1. Usia : ...
2. Jenis Kelamin : ...
3. Lama Berlangganan : ...
Petunjuk Pengisian:
Berilah tanda chek list (√) pada jawaban yang dipilih.
1. Bila pendapat anda sangat setuju (SS) 2. Bila pendapat anda setuju (S)
3. Bila kurang setuju (KS) 4. Bila tidak setuju (TS)
5. Bila sangat tidak setuju (STS)
Identitas responden
1. Usia : ...
2. Jenis Kelamin : ...
3. Lama Mejadi Pelanggan : ...
4. Pendapatan Per Bulan : ...
(X1) Kualitas Produk
No Pernyataan Pilihan Jawaban
STS TS KS S SS 1 Saya berpendapat bahwa jenis roti yang dijual
di Roti John beragam/lengkap.
2 Saya berpendapat Roti John awet dan tidak mudah jamur.
3 Saya merasa bahwa bahan baku yang digunakan dalam proses produksi roti di Roti John berkualitas baik.
4 Saya mengetahui bahwa proses pembuatan Roti John melalui alat modern.
5 Saya berpendapat bahwa bentuk Roti John menarik
(X2) Kualitas Pelayanan
No Pernyataan Pilihan Jawaban
STS TS KS S SS 1 Saya senang dengan karyawan Roti John
karena berpenampilan rapi (Bukti Fisik)
2 Menurut saya karyawan Roti John handal dalam melayani pelanggan (Kehandalan) 3 Setiap keinginan/keluhan pelanggan ditanggapi
dengan baik oleh karyawan Roti John (Daya Tanggap).
4 Menurut saya karyawan Roti John memberikan jaminan yang positif kepada pelanggan (Jaminan).
5 Saya merasa karyawan Roti John lebih
mementingkan kepentingan dan keperluan
pelanggan (Empati).
(X3) Harga
No Pernyataan Pilihan Jawaban
STS TS KS S SS 1 Menurut saya harga Roti John sesuai dengan
kualitas
2 Saya berpendapat bahwa harga Roti John terjangkau oleh semua kalangan masyarakat.
3 Saya berpendapat bahwa harga produk Roti John yang ditawarkan bersaing dengan harga roti yang lain
4 Menurut saya harga produk Roti John sudah sesuai dengan nilai yang diperoleh pelanggan 5 Saya mendapatkan diskon dari Roti John
karena saya pelanggan tetap Roti John.
(Y) Kepuasan Pelanggan
No Pernyataan Pilihan Jawaban
STS TS KS S SS 1 Saya merasa sangat puas setelah
mengkonsumsi Roti John.
2 Rasa penasaran saya terbayarkan setelah mengkonsumsi Roti John
3 Saya akan mereferensikan Roti John kepada calon pelanggan lain
4 Saya akan selalu membeli roti di Roti John 5 Saya tidak pernah mengeluh tentang rasa Roti
John Keterangan:
Berilah tanda chek list (√) pada jawaban yang dipilih.
1. Bila pendapat anda sangat setuju (SS) 2. Bila pendapat anda setuju (S)
3. Bila Kurang Setuju (KS) 4. Bila tidak setuju (TS)
5. Bila sangat tidak setuju (STS)
LAMPIRAN II:
Frekuensi Pernyataan
Responden
Frekuensi Penyataan Responden Kualitas Produk (X1)
Statistics
X1.1 X1.2 X1.3 X1.4 X1.5
N Valid 100 100 100 100 100
Missing 0 0 0 0 0
X1.1
Frequency Percent Valid Percent Cumulative Percent
Valid
2 1 1.0 1.0 1.0
3 8 8.0 8.0 9.0
4 44 44.0 44.0 53.0
5 47 47.0 47.0 100.0
Total 100 100.0 100.0
X1.2
Frequency Percent Valid Percent Cumulative Percent
Valid
3 5 5.0 5.0 5.0
4 61 61.0 61.0 66.0
5 34 34.0 34.0 100.0
Total 100 100.0 100.0
X1.3
Frequency Percent Valid Percent Cumulative Percent
Valid
3 8 8.0 8.0 8.0
4 58 58.0 58.0 66.0
5 34 34.0 34.0 100.0
Total 100 100.0 100.0
X1.4
Frequency Percent Valid Percent Cumulative Percent
Valid
3 11 11.0 11.0 11.0
4 45 45.0 45.0 56.0
5 44 44.0 44.0 100.0
Total 100 100.0 100.0
X1.5
Frequency Percent Valid Percent Cumulative Percent
Valid
3 9 9.0 9.0 9.0
4 54 54.0 54.0 63.0
5 37 37.0 37.0 100.0
Total 100 100.0 100.0
Kualitas Layanan (X2)
Statistics
X2.1 X2.2 X2.3 X2.4 X2.5
N Valid 100 100 100 100 100
Missing 0 0 0 0 0
X2.1
Frequency Percent Valid Percent Cumulative Percent
Valid
3 17 17.0 17.0 17.0
4 58 58.0 58.0 75.0
5 25 25.0 25.0 100.0
Total 100 100.0 100.0
X2.2
Frequency Percent Valid Percent Cumulative Percent
Valid
3 15 15.0 15.0 15.0
4 54 54.0 54.0 69.0
5 31 31.0 31.0 100.0
Total 100 100.0 100.0
X2.3
Frequency Percent Valid Percent Cumulative Percent
Valid
2 1 1.0 1.0 1.0
3 8 8.0 8.0 9.0
4 71 71.0 71.0 80.0
5 20 20.0 20.0 100.0
Total 100 100.0 100.0
X2.4
Frequency Percent Valid Percent Cumulative Percent
Valid
3 9 9.0 9.0 9.0
4 62 62.0 62.0 71.0
5 29 29.0 29.0 100.0
Total 100 100.0 100.0
X2.5
Frequency Percent Valid Percent Cumulative Percent
Valid
3 11 11.0 11.0 11.0
4 54 54.0 54.0 65.0
5 35 35.0 35.0 100.0
Total 100 100.0 100.0
Harga (X3)
Statistics
X3.1 X3.2 X3.3 X3.4 X3.5
N Valid 100 100 100 100 100
Missing 0 0 0 0 0
X3.1
Frequency Percent Valid Percent Cumulative Percent
Valid
3 17 17.0 17.0 17.0
4 52 52.0 52.0 69.0
5 31 31.0 31.0 100.0
Total 100 100.0 100.0
X3.2
Frequency Percent Valid Percent Cumulative Percent
Valid
2 1 1.0 1.0 1.0
3 16 16.0 16.0 17.0
4 49 49.0 49.0 66.0
5 34 34.0 34.0 100.0
Total 100 100.0 100.0
X3.3
Frequency Percent Valid Percent Cumulative Percent
Valid
3 12 12.0 12.0 12.0
4 62 62.0 62.0 74.0
5 26 26.0 26.0 100.0
Total 100 100.0 100.0
X3.4
Frequency Percent Valid Percent Cumulative Percent
Valid
3 8 8.0 8.0 8.0
4 63 63.0 63.0 71.0
5 29 29.0 29.0 100.0
Total 100 100.0 100.0
X3.5
Frequency Percent Valid Percent Cumulative Percent
Valid
2 1 1.0 1.0 1.0
3 6 6.0 6.0 7.0
4 62 62.0 62.0 69.0
5 31 31.0 31.0 100.0
Total 100 100.0 100.0
Kepuasan Pelanggan (Y)
Statistics
Y.1 Y.2 Y.3 Y.4 Y.5
N Valid 100 100 100 100 100
Missing 0 0 0 0 0
Y.1
Frequency Percent Valid Percent Cumulative Percent
Valid
3 13 13.0 13.0 13.0
4 58 58.0 58.0 71.0
5 29 29.0 29.0 100.0
Total 100 100.0 100.0
Y.2
Frequency Percent Valid Percent Cumulative Percent
Valid
3 5 5.0 5.0 5.0
4 74 74.0 74.0 79.0
5 21 21.0 21.0 100.0
Total 100 100.0 100.0
Y.3
Frequency Percent Valid Percent Cumulative Percent
Valid
3 4 4.0 4.0 4.0
4 72 72.0 72.0 76.0
5 24 24.0 24.0 100.0
Total 100 100.0 100.0
Y.4
Frequency Percent Valid Percent Cumulative Percent
Valid
3 12 12.0 12.0 12.0
4 52 52.0 52.0 64.0
5 36 36.0 36.0 100.0
Total 100 100.0 100.0
Y.5
Frequency Percent Valid Percent Cumulative Percent
Valid
3 16 16.0 16.0 16.0
4 45 45.0 45.0 61.0
5 39 39.0 39.0 100.0
Total 100 100.0 100.0
LAMPIRAN III:
Hasil Uji Validitas
Kualitas Produk (X1)
Correlations
X1.1 X1.2 X1.3 X1.4 X1.5 X1
X1.1
Pearson Correlation 1 .464** .335** .308** .112 .645**
Sig. (2-tailed) .000 .001 .002 .269 .000
N 100 100 100 100 100 100
X1.2
Pearson Correlation .464** 1 .593** .393** .260** .754**
Sig. (2-tailed) .000 .000 .000 .009 .000
N 100 100 100 100 100 100
X1.3
Pearson Correlation .335** .593** 1 .543** .183 .745**
Sig. (2-tailed) .001 .000 .000 .068 .000
N 100 100 100 100 100 100
X1.4
Pearson Correlation .308** .393** .543** 1 .482** .786**
Sig. (2-tailed) .002 .000 .000 .000 .000
N 100 100 100 100 100 100
X1.5
Pearson Correlation .112 .260** .183 .482** 1 .582**
Sig. (2-tailed) .269 .009 .068 .000 .000
N 100 100 100 100 100 100
X1
Pearson Correlation .645** .754** .745** .786** .582** 1
Sig. (2-tailed) .000 .000 .000 .000 .000
N 100 100 100 100 100 100
**. Correlation is significant at the 0.01 level (2-tailed).
Kualitas Layanan (X2)
Correlations
X2.1 X2.2 X2.3 X2.4 X2.5 X2
X2.1
Pearson Correlation 1 .607** .397** .251* .247* .731**
Sig. (2-tailed) .000 .000 .012 .013 .000
N 100 100 100 100 100 100
X2.2
Pearson Correlation .607** 1 .365** .255* .267** .733**
Sig. (2-tailed) .000 .000 .010 .007 .000
N 100 100 100 100 100 100
X2.3
Pearson Correlation .397** .365** 1 .339** .357** .689**
Sig. (2-tailed) .000 .000 .001 .000 .000
N 100 100 100 100 100 100
X2.4
Pearson Correlation .251* .255* .339** 1 .465** .651**
Sig. (2-tailed) .012 .010 .001 .000 .000
N 100 100 100 100 100 100
X2.5
Pearson Correlation .247* .267** .357** .465** 1 .672**
Sig. (2-tailed) .013 .007 .000 .000 .000
N 100 100 100 100 100 100
X2
Pearson Correlation .731** .733** .689** .651** .672** 1
Sig. (2-tailed) .000 .000 .000 .000 .000
N 100 100 100 100 100 100
**. Correlation is significant at the 0.01 level (2-tailed).
*. Correlation is significant at the 0.05 level (2-tailed).
Harga (X3)
Correlations
X3.1 X3.2 X3.3 X3.4 X3.5 X3
X3.1
Pearson Correlation 1 .591** .369** .156 .143 .694**
Sig. (2-tailed) .000 .000 .120 .157 .000
N 100 100 100 100 100 100
X3.2
Pearson Correlation .591** 1 .412** .211* .264** .761**
Sig. (2-tailed) .000 .000 .035 .008 .000
N 100 100 100 100 100 100
X3.3
Pearson Correlation .369** .412** 1 .294** .189 .661**
Sig. (2-tailed) .000 .000 .003 .060 .000
N 100 100 100 100 100 100
X3.4
Pearson Correlation .156 .211* .294** 1 .650** .645**
Sig. (2-tailed) .120 .035 .003 .000 .000
N 100 100 100 100 100 100
X3.5
Pearson Correlation .143 .264** .189 .650** 1 .633**
Sig. (2-tailed) .157 .008 .060 .000 .000
N 100 100 100 100 100 100
X3
Pearson Correlation .694** .761** .661** .645** .633** 1
Sig. (2-tailed) .000 .000 .000 .000 .000
N 100 100 100 100 100 100
**. Correlation is significant at the 0.01 level (2-tailed).
*. Correlation is significant at the 0.05 level (2-tailed).
Kepuasan Pelanggan (Y)
Correlations
Y.1 Y.2 Y.3 Y.4 Y.5 Y
Y.1
Pearson Correlation 1 .574** .221* .371** .391** .759**
Sig. (2-tailed) .000 .027 .000 .000 .000
N 100 100 100 100 100 100
Y.2
Pearson Correlation .574** 1 .371** .164 .156 .616**
Sig. (2-tailed) .000 .000 .103 .122 .000
N 100 100 100 100 100 100
Y.3
Pearson Correlation .221* .371** 1 .258** .156 .538**
Sig. (2-tailed) .027 .000 .010 .120 .000
N 100 100 100 100 100 100
Y.4
Pearson Correlation .371** .164 .258** 1 .534** .726**
Sig. (2-tailed) .000 .103 .010 .000 .000
N 100 100 100 100 100 100
Y.5
Pearson Correlation .391** .156 .156 .534** 1 .719**
Sig. (2-tailed) .000 .122 .120 .000 .000
N 100 100 100 100 100 100
Y
Pearson Correlation .759** .616** .538** .726** .719** 1
Sig. (2-tailed) .000 .000 .000 .000 .000
N 100 100 100 100 100 100
**. Correlation is significant at the 0.01 level (2-tailed).
*. Correlation is significant at the 0.05 level (2-tailed).
LAMPIRAN IV:
Hasil Uji Reliabilitas
Kualitas Produk (X1)
Case Processing Summary
N %
Cases
Valid 100 100.0
Excludeda 0 .0
Total 100 100.0
a. Listwise deletion based on all variables in the procedure.
Reliability Statistics Cronbach's Alpha N of Items
.739 5
Kualitas Layanan (X2)
Case Processing Summary
N %
Cases
Valid 100 100.0
Excludeda 0 .0
Total 100 100.0
a. Listwise deletion based on all variables in the procedure.
Reliability Statistics Cronbach's Alpha N of Items
.733 5
Harga (X3)
Case Processing Summary
N %
Cases
Valid 100 100.0
Excludeda 0 .0
Total 100 100.0
a. Listwise deletion based on all variables in the procedure.
Reliability Statistics Cronbach's Alpha N of Items
.709 5
Kepuasan Pelanggan (Y)
Case Processing Summary
N %
Cases
Valid 100 100.0
Excludeda 0 .0
Total 100 100.0
a. Listwise deletion based on all variables in the procedure.
Reliability Statistics Cronbach's Alpha N of Items
.701 5
LAMPIRAN V:
Hasil Uji Uji Regresi, Uji Asumsi Klasik Dan Uji
Hipotesis
Variables Entered/Removeda Model Variables
Entered
Variables Removed
Method
1 X3, X1, X2b . Enter
a. Dependent Variable: Y
b. All requested variables entered.
Model Summaryb
Model R R Square Adjusted R
Square
Std. Error of the Estimate
1 .898a .807 .801 .905
a. Predictors: (Constant), X3, X1, X2 b. Dependent Variable: Y
ANOVAa
Model Sum of Squares df Mean Square F Sig.
1
Regression 328.287 3 109.429 133.480 .000b
Residual 78.703 96 .820
Total 406.990 99
a. Dependent Variable: Y
b. Predictors: (Constant), X3, X1, X2
Coefficientsa
Model Unstandardized
Coefficients
Standardized Coefficients
t Sig. Collinearity Statistics
B Std.
Error
Beta Tolerance VIF
1
(Cons
tant) 2.427 .939 2.584 .011
X1 .211 .083 .227 2.527 .013 .249 4.010
X2 .255 .094 .271 2.727 .008 .204 4.911
X3 .418 .089 .447 4.670 .000 .220 4.551
a. Dependent Variable: Y
Coefficient Correlationsa
Model X3 X1 X2
1
Correlations
X3 1.000 -.374 -.546
X1 -.374 1.000 -.451
X2 -.546 -.451 1.000
Covariances
X3 .008 -.003 -.005
X1 -.003 .007 -.004
X2 -.005 -.004 .009
a. Dependent Variable: Y
Collinearity Diagnosticsa
Model Dimension Eigenvalue Condition Index Variance Proportions
(Constant) X1 X2 X3
1
1 3.990 1.000 .00 .00 .00 .00
2 .007 23.836 .99 .02 .03 .03
3 .002 47.165 .01 .91 .05 .40
4 .001 52.885 .00 .07 .92 .57
a. Dependent Variable: Y
Residuals Statisticsa
Minimum Maximum Mean Std. Deviation N
Predicted Value 15.64 23.59 20.99 1.821 100
Std. Predicted Value -2.939 1.428 .000 1.000 100
Standard Error of Predicted
Value .095 .357 .172 .056 100
Adjusted Predicted Value 15.59 23.66 20.99 1.817 100
Residual -2.447 2.553 .000 .892 100
Std. Residual -2.703 2.820 .000 .985 100
Stud. Residual -2.803 2.925 .002 1.007 100
Deleted Residual -2.632 2.747 .004 .934 100
Stud. Deleted Residual -2.910 3.048 .003 1.021 100
Mahal. Distance .096 14.412 2.970 2.832 100
Cook's Distance .000 .162 .012 .025 100
Centered Leverage Value .001 .146 .030 .029 100
a. Dependent Variable: Y
Case Processing Summary Cases
Included Excluded Total
N Percent N Percent N Percent
Y * X1 100 100.0% 0 0.0% 100 100.0%
Y * X2 100 100.0% 0 0.0% 100 100.0%
Y * X3 100 100.0% 0 0.0% 100 100.0%
Report Y
X1 Mean N Std. Deviation
15 17.00 1 .
16 15.50 2 .707
17 18.00 1 .
18 17.75 4 1.500
19 19.14 14 1.834
20 20.14 7 1.952
21 20.58 12 1.084
22 21.50 22 .802
23 22.00 18 .907
24 22.79 14 .579
25 23.60 5 .894
Total 20.99 100 2.028
ANOVA Table Sum of Squares
df Mean
Square
F Sig.
Y * X1
Between Groups
(Combined) 285.195 10 28.519 20.840 .000
Linearity 277.913 1 277.913 203.081 .000
Deviation from
Linearity 7.281 9 .809 .591 .801
Within Groups 121.795 89 1.368
Total 406.990 99
Measures of Association
R R Squared Eta Eta Squared
Y * X1 .826 .683 .837 .701
Report Y
X2 Mean N Std. Deviation
14 16.00 1 .
16 17.20 5 .447
17 17.40 5 1.517
18 18.29 7 .756
19 19.75 4 1.500
20 20.80 10 1.229
21 21.45 22 1.011
22 21.88 26 1.177
23 22.71 17 .920
24 22.67 3 .577
Total 20.99 100 2.028
ANOVA Table Sum of Squares
df Mean
Square
F Sig.
Y * Between Groups (Combined) 302.907 9 33.656 29.102 .000
X2 Linearity 292.986 1 292.986 253.344 .000 Deviation from
Linearity 9.921 8 1.240 1.072 .390
Within Groups 104.083 90 1.156
Total 406.990 99
Measures of Association
R R Squared Eta Eta Squared
Y * X2 .848 .720 .863 .744
Report Y
X3 Mean N Std. Deviation
14 15.00 1 .
15 16.00 1 .
16 18.00 1 .
17 17.62 8 .744
18 18.50 6 1.517
19 19.60 10 1.265
20 21.00 3 1.000
21 21.13 15 1.125
22 21.85 34 1.077
23 22.78 18 .548
24 23.00 3 1.000
Total 20.99 100 2.028
ANOVA Table Sum of Squares
df Mean Square F Sig.
Y * X3
Between Groups
(Combined) 312.106 10 31.211 29.275 .000
Linearity 307.678 1 307.678 288.597 .000
Deviation from
Linearity 4.428 9 .492 .462 .897
Within Groups 94.884 89 1.066
Total 406.990 99
Measures of Association
R R Squared Eta Eta Squared
Y * X3 .869 .756 .876 .767
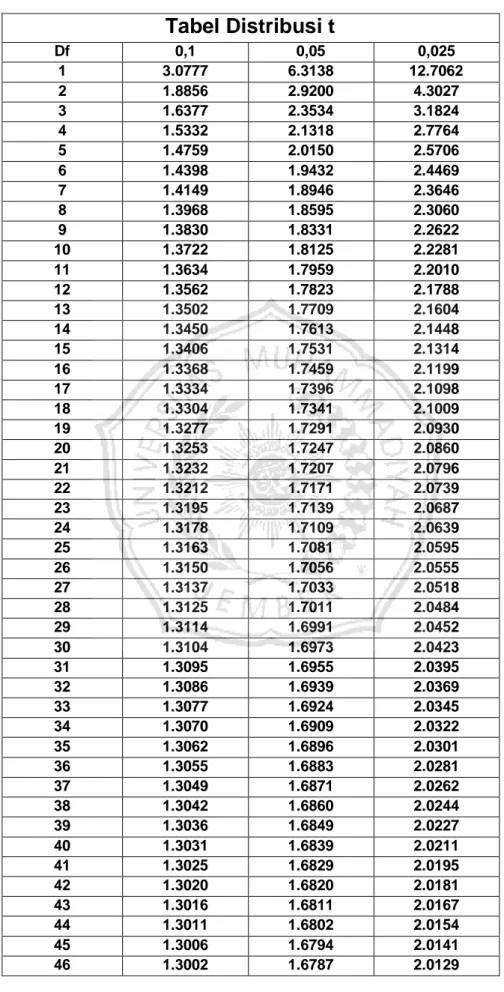
LAMPIRAN VI:
Tabel r Product Moment, Tabel Distribusi F, dan
Tabel Distribusi t
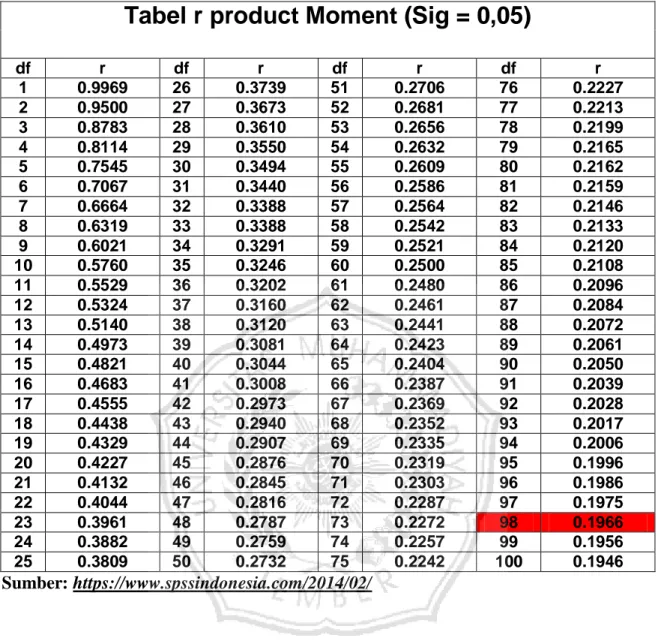
Tabel r product Moment (Sig = 0,05)
df r df r df r df r
1 0.9969 26 0.3739 51 0.2706 76 0.2227
2 0.9500 27 0.3673 52 0.2681 77 0.2213
3 0.8783 28 0.3610 53 0.2656 78 0.2199
4 0.8114 29 0.3550 54 0.2632 79 0.2165
5 0.7545 30 0.3494 55 0.2609 80 0.2162
6 0.7067 31 0.3440 56 0.2586 81 0.2159
7 0.6664 32 0.3388 57 0.2564 82 0.2146
8 0.6319 33 0.3388 58 0.2542 83 0.2133
9 0.6021 34 0.3291 59 0.2521 84 0.2120
10 0.5760 35 0.3246 60 0.2500 85 0.2108
11 0.5529 36 0.3202 61 0.2480 86 0.2096
12 0.5324 37 0.3160 62 0.2461 87 0.2084
13 0.5140 38 0.3120 63 0.2441 88 0.2072
14 0.4973 39 0.3081 64 0.2423 89 0.2061
15 0.4821 40 0.3044 65 0.2404 90 0.2050
16 0.4683 41 0.3008 66 0.2387 91 0.2039
17 0.4555 42 0.2973 67 0.2369 92 0.2028
18 0.4438 43 0.2940 68 0.2352 93 0.2017
19 0.4329 44 0.2907 69 0.2335 94 0.2006
20 0.4227 45 0.2876 70 0.2319 95 0.1996
21 0.4132 46 0.2845 71 0.2303 96 0.1986
22 0.4044 47 0.2816 72 0.2287 97 0.1975
23 0.3961 48 0.2787 73 0.2272 98 0.1966
24 0.3882 49 0.2759 74 0.2257 99 0.1956
25 0.3809 50 0.2732 75 0.2242 100 0.1946
Sumber: https://www.spssindonesia.com/2014/02/
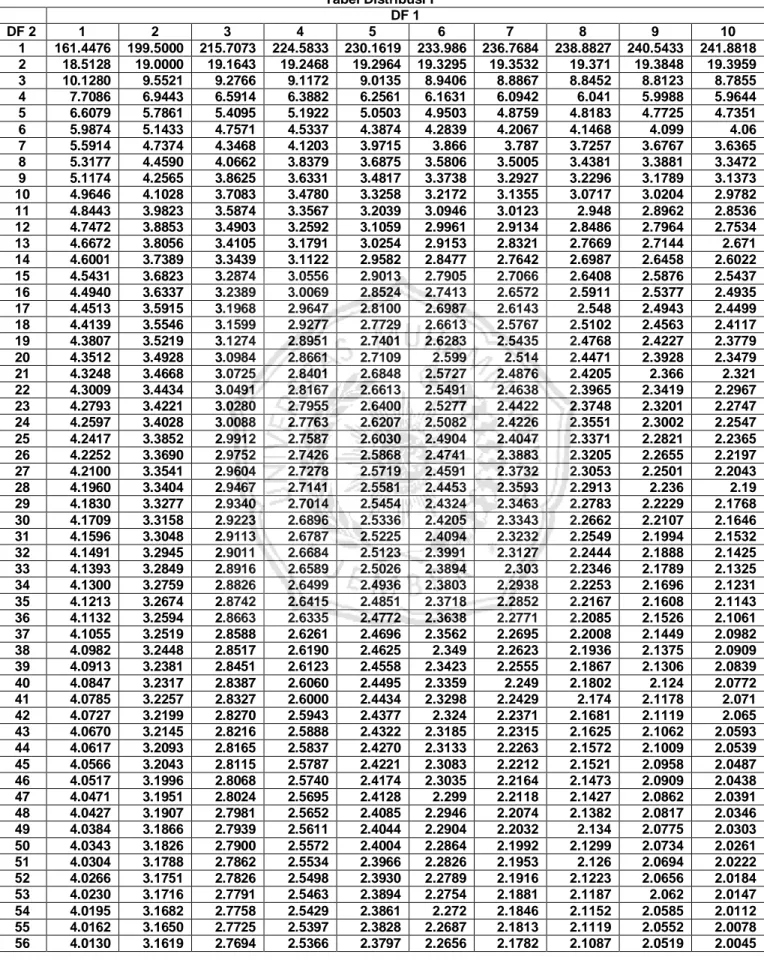
Tabel Distribusi F
DF 1
DF 2 1 2 3 4 5 6 7 8 9 10
1 161.4476 199.5000 215.7073 224.5833 230.1619 233.986 236.7684 238.8827 240.5433 241.8818 2 18.5128 19.0000 19.1643 19.2468 19.2964 19.3295 19.3532 19.371 19.3848 19.3959 3 10.1280 9.5521 9.2766 9.1172 9.0135 8.9406 8.8867 8.8452 8.8123 8.7855 4 7.7086 6.9443 6.5914 6.3882 6.2561 6.1631 6.0942 6.041 5.9988 5.9644 5 6.6079 5.7861 5.4095 5.1922 5.0503 4.9503 4.8759 4.8183 4.7725 4.7351 6 5.9874 5.1433 4.7571 4.5337 4.3874 4.2839 4.2067 4.1468 4.099 4.06 7 5.5914 4.7374 4.3468 4.1203 3.9715 3.866 3.787 3.7257 3.6767 3.6365 8 5.3177 4.4590 4.0662 3.8379 3.6875 3.5806 3.5005 3.4381 3.3881 3.3472 9 5.1174 4.2565 3.8625 3.6331 3.4817 3.3738 3.2927 3.2296 3.1789 3.1373 10 4.9646 4.1028 3.7083 3.4780 3.3258 3.2172 3.1355 3.0717 3.0204 2.9782 11 4.8443 3.9823 3.5874 3.3567 3.2039 3.0946 3.0123 2.948 2.8962 2.8536 12 4.7472 3.8853 3.4903 3.2592 3.1059 2.9961 2.9134 2.8486 2.7964 2.7534 13 4.6672 3.8056 3.4105 3.1791 3.0254 2.9153 2.8321 2.7669 2.7144 2.671 14 4.6001 3.7389 3.3439 3.1122 2.9582 2.8477 2.7642 2.6987 2.6458 2.6022 15 4.5431 3.6823 3.2874 3.0556 2.9013 2.7905 2.7066 2.6408 2.5876 2.5437 16 4.4940 3.6337 3.2389 3.0069 2.8524 2.7413 2.6572 2.5911 2.5377 2.4935 17 4.4513 3.5915 3.1968 2.9647 2.8100 2.6987 2.6143 2.548 2.4943 2.4499 18 4.4139 3.5546 3.1599 2.9277 2.7729 2.6613 2.5767 2.5102 2.4563 2.4117 19 4.3807 3.5219 3.1274 2.8951 2.7401 2.6283 2.5435 2.4768 2.4227 2.3779 20 4.3512 3.4928 3.0984 2.8661 2.7109 2.599 2.514 2.4471 2.3928 2.3479 21 4.3248 3.4668 3.0725 2.8401 2.6848 2.5727 2.4876 2.4205 2.366 2.321 22 4.3009 3.4434 3.0491 2.8167 2.6613 2.5491 2.4638 2.3965 2.3419 2.2967 23 4.2793 3.4221 3.0280 2.7955 2.6400 2.5277 2.4422 2.3748 2.3201 2.2747 24 4.2597 3.4028 3.0088 2.7763 2.6207 2.5082 2.4226 2.3551 2.3002 2.2547 25 4.2417 3.3852 2.9912 2.7587 2.6030 2.4904 2.4047 2.3371 2.2821 2.2365 26 4.2252 3.3690 2.9752 2.7426 2.5868 2.4741 2.3883 2.3205 2.2655 2.2197 27 4.2100 3.3541 2.9604 2.7278 2.5719 2.4591 2.3732 2.3053 2.2501 2.2043 28 4.1960 3.3404 2.9467 2.7141 2.5581 2.4453 2.3593 2.2913 2.236 2.19 29 4.1830 3.3277 2.9340 2.7014 2.5454 2.4324 2.3463 2.2783 2.2229 2.1768 30 4.1709 3.3158 2.9223 2.6896 2.5336 2.4205 2.3343 2.2662 2.2107 2.1646 31 4.1596 3.3048 2.9113 2.6787 2.5225 2.4094 2.3232 2.2549 2.1994 2.1532 32 4.1491 3.2945 2.9011 2.6684 2.5123 2.3991 2.3127 2.2444 2.1888 2.1425 33 4.1393 3.2849 2.8916 2.6589 2.5026 2.3894 2.303 2.2346 2.1789 2.1325 34 4.1300 3.2759 2.8826 2.6499 2.4936 2.3803 2.2938 2.2253 2.1696 2.1231 35 4.1213 3.2674 2.8742 2.6415 2.4851 2.3718 2.2852 2.2167 2.1608 2.1143 36 4.1132 3.2594 2.8663 2.6335 2.4772 2.3638 2.2771 2.2085 2.1526 2.1061 37 4.1055 3.2519 2.8588 2.6261 2.4696 2.3562 2.2695 2.2008 2.1449 2.0982 38 4.0982 3.2448 2.8517 2.6190 2.4625 2.349 2.2623 2.1936 2.1375 2.0909 39 4.0913 3.2381 2.8451 2.6123 2.4558 2.3423 2.2555 2.1867 2.1306 2.0839 40 4.0847 3.2317 2.8387 2.6060 2.4495 2.3359 2.249 2.1802 2.124 2.0772 41 4.0785 3.2257 2.8327 2.6000 2.4434 2.3298 2.2429 2.174 2.1178 2.071 42 4.0727 3.2199 2.8270 2.5943 2.4377 2.324 2.2371 2.1681 2.1119 2.065 43 4.0670 3.2145 2.8216 2.5888 2.4322 2.3185 2.2315 2.1625 2.1062 2.0593 44 4.0617 3.2093 2.8165 2.5837 2.4270 2.3133 2.2263 2.1572 2.1009 2.0539 45 4.0566 3.2043 2.8115 2.5787 2.4221 2.3083 2.2212 2.1521 2.0958 2.0487 46 4.0517 3.1996 2.8068 2.5740 2.4174 2.3035 2.2164 2.1473 2.0909 2.0438 47 4.0471 3.1951 2.8024 2.5695 2.4128 2.299 2.2118 2.1427 2.0862 2.0391 48 4.0427 3.1907 2.7981 2.5652 2.4085 2.2946 2.2074 2.1382 2.0817 2.0346 49 4.0384 3.1866 2.7939 2.5611 2.4044 2.2904 2.2032 2.134 2.0775 2.0303 50 4.0343 3.1826 2.7900 2.5572 2.4004 2.2864 2.1992 2.1299 2.0734 2.0261 51 4.0304 3.1788 2.7862 2.5534 2.3966 2.2826 2.1953 2.126 2.0694 2.0222 52 4.0266 3.1751 2.7826 2.5498 2.3930 2.2789 2.1916 2.1223 2.0656 2.0184 53 4.0230 3.1716 2.7791 2.5463 2.3894 2.2754 2.1881 2.1187 2.062 2.0147 54 4.0195 3.1682 2.7758 2.5429 2.3861 2.272 2.1846 2.1152 2.0585 2.0112 55 4.0162 3.1650 2.7725 2.5397 2.3828 2.2687 2.1813 2.1119 2.0552 2.0078 56 4.0130 3.1619 2.7694 2.5366 2.3797 2.2656 2.1782 2.1087 2.0519 2.0045
57 4.0099 3.1588 2.7664 2.5336 2.3767 2.2625 2.1751 2.1056 2.0488 2.0014 58 4.0069 3.1559 2.7636 2.5307 2.3738 2.2596 2.1721 2.1026 2.0458 1.9983 59 4.0040 3.1531 2.7608 2.5279 2.3710 2.2568 2.1693 2.0997 2.0429 1.9954 60 4.0012 3.1504 2.7581 2.5252 2.3683 2.2541 2.1665 2.097 2.0401 1.9926 61 3.9985 3.1478 2.7555 2.5226 2.3657 2.2514 2.1639 2.0943 2.0374 1.9899 62 3.9959 3.1453 2.7530 2.5201 2.3631 2.2489 2.1613 2.0917 2.0348 1.9872 63 3.9934 3.1428 2.7505 2.5177 2.3607 2.2464 2.1588 2.0892 2.0322 1.9847 64 3.9909 3.1404 2.7482 2.5153 2.3583 2.244 2.1564 2.0868 2.0298 1.9822 65 3.9886 3.1381 2.7459 2.5130 2.3560 2.2417 2.1541 2.0844 2.0274 1.9798 66 3.9863 3.1359 2.7437 2.5108 2.3538 2.2395 2.1518 2.0821 2.0251 1.9775 67 3.9840 3.1338 2.7416 2.5087 2.3517 2.2373 2.1497 2.0799 2.0229 1.9752 68 3.9819 3.1317 2.7395 2.5066 2.3496 2.2352 2.1475 2.0778 2.0207 1.973 69 3.9798 3.1296 2.7375 2.5046 2.3475 2.2332 2.1455 2.0757 2.0186 1.9709 70 3.9778 3.1277 2.7355 2.5027 2.3456 2.2312 2.1435 2.0737 2.0166 1.9689 71 3.9758 3.1258 2.7336 2.5008 2.3437 2.2293 2.1415 2.0717 2.0146 1.9669 72 3.9739 3.1239 2.7318 2.4989 2.3418 2.2274 2.1397 2.0698 2.0127 1.9649 73 3.9720 3.1221 2.7300 2.4971 2.3400 2.2256 2.1378 2.068 2.0108 1.9631 74 3.9702 3.1203 2.7283 2.4954 2.3383 2.2238 2.136 2.0662 2.009 1.9612 75 3.9685 3.1186 2.7266 2.4937 2.3366 2.2221 2.1343 2.0644 2.0073 1.9594 76 3.9668 3.1170 2.7249 2.4920 2.3349 2.2204 2.1326 2.0627 2.0055 1.9577 77 3.9651 3.1154 2.7233 2.4904 2.3333 2.2188 2.131 2.0611 2.0039 1.956 78 3.9635 3.1138 2.7218 2.4889 2.3317 2.2172 2.1294 2.0595 2.0022 1.9544 79 3.9619 3.1123 2.7203 2.4874 2.3302 2.2157 2.1278 2.0579 2.0007 1.9528 80 3.9604 3.1108 2.7188 2.4859 2.3287 2.2142 2.1263 2.0564 1.9991 1.9512 81 3.9589 3.1093 2.7173 2.4844 2.3273 2.2127 2.1248 2.0549 1.9976 1.9497 82 3.9574 3.1079 2.7159 2.4830 2.3259 2.2113 2.1234 2.0534 1.9961 1.9482 83 3.9560 3.1065 2.7146 2.4817 2.3245 2.2099 2.122 2.052 1.9947 1.9468 84 3.9546 3.1052 2.7132 2.4803 2.3231 2.2086 2.1206 2.0506 1.9933 1.9454 85 3.9532 3.1038 2.7119 2.4790 2.3218 2.2072 2.1193 2.0493 1.9919 1.944 86 3.9519 3.1026 2.7106 2.4777 2.3205 2.2059 2.118 2.048 1.9906 1.9426 87 3.9506 3.1013 2.7094 2.4765 2.3193 2.2047 2.1167 2.0467 1.9893 1.9413 88 3.9493 3.1001 2.7082 2.4753 2.3181 2.2034 2.1155 2.0454 1.988 1.94 89 3.9481 3.0989 2.7070 2.4741 2.3169 2.2022 2.1143 2.0442 1.9868 1.9388 90 3.9469 3.0977 2.7058 2.4729 2.3157 2.2011 2.1131 2.043 1.9856 1.9376 91 3.9457 3.0966 2.7047 2.4718 2.3145 2.1999 2.1119 2.0418 1.9844 1.9364 92 3.9445 3.0954 2.7036 2.4707 2.3134 2.1988 2.1108 2.0407 1.9833 1.9352 93 3.9434 3.0943 2.7025 2.4696 2.3123 2.1977 2.1097 2.0395 1.9821 1.9341 94 3.9423 3.0933 2.7014 2.4685 2.3113 2.1966 2.1086 2.0384 1.981 1.9329 95 3.9412 3.0922 2.7004 2.4675 2.3102 2.1955 2.1075 2.0374 1.9799 1.9318 96 3.9402 3.0912 2.6994 2.4665 2.3092 2.1945 2.1065 2.0363 1.9789 1.9308 97 3.9391 3.0902 2.6984 2.4655 2.3082 2.1935 2.1054 2.0353 1.9778 1.9297 98 3.9381 3.0892 2.6974 2.4645 2.3072 2.1925 2.1044 2.0343 1.9768 1.9287 99 3.9371 3.0882 2.6965 2.4636 2.3063 2.1915 2.1035 2.0333 1.9758 1.9277 100 3.9361 3.0873 2.6955 2.4626 2.3053 2.1906 2.1025 2.0323 1.9748 1.9267