INTERNATIONAL JOURNAL OF CLIMATOLOGY
Int. J. Climatol.(2014)
Published online in Wiley Online Library (wileyonlinelibrary.com) DOI: 10.1002/joc.3939
Observation of spatial patterns on the rainfall response
to ENSO and IOD over Indonesia using TRMM
Multisatellite Precipitation Analysis (TMPA)
Abd. Rahman As-syakur,
a,b* I Wayan Sandi Adnyana,
cMade Sudiana Mahendra,
bI Wayan
Arthana,
dI Nyoman Merit,
cI Wayan Kasa,
eNi Wayan Ekayanti,
a,fI Wayan Nuarsa
band I Nyoman Sunarta
gaCenter for Remote Sensing and Ocean Science (CReSOS), Udayana University, Bali, Indonesia bEnvironmental Research Center (PPLH), Udayana University, Bali, Indonesia
cFaculty of Agriculture, Udayana University, Bali, Indonesia dFaculty of Oceanography and Fisheries, Udayana University, Bali, Indonesia
eFaculty of Science, Udayana University, Bali, Indonesia fPhysic Department, Technical High School of Tampaksiring, Bali, Indonesia
gFaculty of Tourism, Udayana University, Bali, Indonesia
ABSTRACT: Remote sensing data of Tropical Rainfall Measuring Mission (TRMM) Multisatellite Precipitation Analysis for 13 years have been used to observe the spatial patterns relationship of rainfall with El Ni˜no-Southern Oscillation (ENSO) and Indian Ocean Dipole (IOD) over Indonesia. Linear correlation was measured to determine the relationship level by the restriction analysis of seasonal and monthly relationship, while the partial correlation technique was utilized to distinguish the impact of one phenomenon from that of the other. Application of remote sensing data can reveal an interaction of spatial-temporal relationship of rainfall with ENSO and IOD between land and sea. In general, the temporal patterns relationship of rainfall with ENSO confirmed fairly similar temporal patterns between rainfall with IOD, which is high response during JJA (June–July–August) and SON (September–October–November) and unclear response during DJF (December–January–February) and MAM (March–April–May). Spatial patterns relationship of both phenomena with rainfall is high in the southeastern part of Sumatra Island and Java Island during JJA and SON. During the SON season, IOD has a higher relationship level than ENSO in this part. In the spatial-temporal pattern seen, a dynamic movement of the relationship between IOD and ENSO with rainfall in Indonesia is indicated, where the influence of ENSO and IOD started during JJA especially in July in the southwest of Indonesia and ended in the DJF period especially in January in the northeast of Indonesia.
KEY WORDS rainfall; remote sensing; ENSO; IOD; TMPA; partial correlation
Received 23 March 2011; Revised 29 November 2013; Accepted 7 January 2014
1. Introduction
Indonesia is an equator-crossed country surrounded by two oceans and two continents. This location makes Indonesia a region of confluence of the Hadley cell circulation and the Walker circulation, two circulations that greatly affect the diversity of rainfall in Indonesia (Aldrianet al., 2007). The annual movement of the sun from 23.5◦N to 23.5◦S produces the monsoon activity, and it also plays a role in influencing the diversity of the rainfall. Local influence of rainfall variability also cannot be ignored because Indonesia is an archipelago with a varied topography (Haylock and McBride, 2001; Aldrian and Djamil, 2008). On the other hand, complex distribution of land and sea results in significant local
* Correspondence to: A. R. As-syakur, Center for Remote Sensing and Ocean Science (CReSOS), Udayana University, Bali 80232, Indonesia. E-mail: [email protected]
variations in the annual rainfall cycle (Changet al., 2005; Qian, 2008), and affects the rainfall quantities (Sobel et al., 2011; As-syakur et al., 2013). Furthermore, the differential solar heating between different surface types such as between land and sea, or highland and lowland, causes strong local pressure gradients (Qian, 2008). These conditions result in sea-breeze convergence over islands and orographic precipitation (Qianet al., 2010), causing diurnal cycle of rainfall over islands. Overall, rain is the most important climate element in Indonesia because precipitation varies both with respect to time and space. Therefore, this study about climate in Indonesia focused more on the rain factor.
Indonesian rainfall is coherent and strongly correlated with ENSO variations in the Pacific basin (Ropelewski and Halpert, 1987; Nicholls, 1988; Aldrian and Susanto, 2003; Hendon, 2003; Aldrianet al., 2007; Hamadaet al., 2012) and also correlated with IOD events (Saji et al., 1999; Saji and Yamagata, 2003b; Bannu et al., 2005). ENSO is a recurring pattern of climate variability in the eastern equatorial Pacific, which is characterized by anomalies in both sea surface temperature (SST; referred to as El Ni˜no and La Ni˜na for warming and cooling periods, respectively) and sea-level pressure (Southern Oscillation; Philander, 1990; Trenberth, 1997; Naylor et al., 2001; Meyers et al., 2007). An IOD event refers to strong zonal SST gradients in the equatorial Indian Ocean regions, phase-locked to the boreal summer and autumn (Saji et al., 1999; Saji and Yamagata, 2003a, 2003b).
Moreover, Indonesian rainfall is also influenced by intra-seasonal (30–90 days) Madden–Julian oscillation (MJO; e.g. Madden and Julian, 1971), a dominant component of intra-seasonal variability over the Trop-ics (Wheeler and Hendon, 2004). Large-scale tropi-cal convection– circulation phase of MJO significantly affects the rainfall variability over Indonesia (Hidayat and Kizu, 2010; Ohet al., 2012). Extreme high and low precipitation events were associated with the MJO phase and causes floods and droughts in some places of Indone-sia. However, spatial characteristics and manifestations of MJO are affected and modified by the ENSO and IOD conditions (Hendon et al., 2007; Rao et al., 2007; Tang and Yu, 2008; Waliseret al., 2012). During El Ni˜no, the number of intra-seasonal days decreases and the opposite tends to occur in the La Ni˜na event (Pohl and Matthews, 2007). On the other hand, during negative IOD, the MJO propagation is slightly stronger than normal and relatively weak during positive IOD (Wilsonet al., 2013).
El Ni˜no (La Ni˜na) conditions result in a decrease (enhance) in rainfall in Indonesia (Ropelewski and Halpert, 1987; Philander, 1990; Hendon, 2003; Bannu et al., 2005; Susiloet al., 2013); on the other hand, pos-itive (negative) IOD is also decreasing (enhancing) the rainfall in Indonesia (Saji et al., 1999; Saji and Yama-gata, 2003b; Bannu et al., 2005; Aldrian et al., 2007). Decrease in rainfall during El Ni˜no and positive IOD resulted in longer dry season than the normal condi-tions (Philander, 1990; Saji et al., 1999; Hamadaet al., 2002; Hendon, 2003). On the other hand, the La Ni˜na event creates wet condition during the dry season and also increases rainfall at the beginning of the rainy sea-son (Bell et al., 1999, 2000; Hendon, 2003), which cre-ates a high risk of flood (Kishore and Subbiah, 2002). Meanwhile, in El Ni˜no and positive IOD-related rain-fall deficits, significantly below-normal rainrain-fall from June through December resulted in extreme drought that con-tributes to large forest and peat fires, air pollution and haze from biomass burning (Bell and Halpert, 1998; Gut-manet al., 2000; Waple and Lawrimore, 2003; Chrastan-sky and Rotstayn, 2012) and causes extreme low stream-flow in basins (Sahu et al., 2012); at the same time,
El Ni˜no and positive IOD also influence a decline in crop productivity (Irawan, 2003; D’Arrigoa and Wilson, 2008).
Precipitation displays high space–time variability that requires frequent observations for adequate representa-tion (Hong et al., 2010). Previous estimates of tropical precipitation were usually made on the basis of climate prediction models and the occasional inclusion of very sparse surface rain gauges and/or relatively few measure-ments from satellite sensors (Feidas, 2010). Rain gauge observations yield relatively accurate point measurements of precipitation but suffer from sampling errors in rep-resenting areal means and are not available over most oceanic and unpopulated land areas (Xie and Arkin, 1996; Petty and Krajewski, 1996). However, nowadays, rainfall data required for a wide range of scientific applications can be achieved through meteorological satellites (Petty, 1995). Meteorological satellites expand the coverage and time span of conventional ground-based rainfall data for a number of applications by which all hydrology and weather forecasting are made (Levizzani et al., 2002). Furthermore, combining information from multiple satel-lite sensors as well as gauge observations and numer-ical model outputs yields analyses of global precipita-tion with stable and improved quality (Xieet al., 2007). In Indonesia, precipitation is represented as rain gauge data throughout the country. However, rain gauges have incomplete coverage over remote and undeveloped land areas and particularly over the sea, where such instru-ments are virtually not available. Data that have better spatial-temporal resolutions of rainfall will allow a more quantitative understanding of the causal links of Indone-sian rainfall to larger scale climate features. The use of remote sensing, which has better spatial and temporal resolution data, in a study about rainfall and its spatial relationship to ENSO and IOD in Indonesia, thus offers an exciting opportunity.
RAINFALL RESPONSE TO ENSO AND IOD OVER INDONESIA
Figure 1. Spatial cover of research.
determined the climatic characteristics of rainfall over Bangladesh. On the other hand, Vernimmenet al.(2012) and Prasetiaet al.(2013) have validated for other types of TRMM in Indonesia. Vernimmenet al.(2012) compared and used real-time TRMM 3B42 to monitor drought in Indonesia, and Prasetiaet al.(2013) validated TRMM PR over Indonesia. The results have underscored the superi-ority of the TMPA or TRMM 3B43 product and the goal of the algorithm has been achieved to a large extent. Nonetheless, the satellite data display a few drawbacks for tropical regions as bias error against ground base in situ observation. Limitations of the TRMM are that the data are affected by several factors such as causes of non-Sun-synchronous satellite orbit, narrow swath of satellite data, rainfall types (convective and stratiform), and insuf-ficient sampling time intervals, which result in loss of information about rainfall values (Fleming et al., 2011; Vernimmenet al., 2012; As-syakur et al., 2013; Prasetia et al., 2013).
Based on these conditions, in this work we attempt to use the rainfall data from TMPA products to know the spatial patterns relationship of rainfall with ENSO and IOD over Indonesia. Previous studies on the relationship between rainfall with ENSO and IOD in Indonesia were carried out in many locations that have rain gauge data or model utilizations where the data come only from the rain gauge (e.g. Ropelewski and Halpert, 1987; Nicholls, 1988; Hamada et al., 2002; Hendon, 2003; Saji and Yamagata, 2003b; Aldrian et al., 2007). So with the existence of satellite data that have a better spatial-temporal resolution, useful information about the spatial patterns relationship between rainfalls with both types of index can be expected. In this study, the ENSO condition is defined by the Southern Oscillation Index (SOI; Ropelewski and Jones, 1987; Ropelewski and Halpert, 1989, 1996; K¨onnenet al., 1998; Hamadaet al.,
2002), and the IOD condition is defined by Dipole Mode Index (DMI) values (Sajiet al., 1999; Saji and Yamagata, 2003a, 2003b). Main analyses are carried out by using seasonal and monthly spatial correlations.
2. Data and Methods
2.1. Data
2003), as well as DMI values (e.g. Sajiet al., 1999; Saji and Yamagata, 2003b; Bannuet al., 2005).
The TRMM is cosponsored by the National Aeronau-tics and Space Administration (NASA) of the United States, and the Japan Aerospace Exploration Agency (JAXA, previously known as the National Space Devel-opment Agency, or NASDA) has collected the data since November 1997 (Kummerow et al., 2000). TRMM is a long-term research programme designed to study the Earth’s land, oceans, air, ice, and life as a total system (Islam and Uyeda, 2007). TMPA is a calibration-based sequential scheme for combining precipitation estimates from multiple satellites, gauge analyses where feasible, as well as providing a global coverage of precipita-tion above the 50◦S–50◦N latitude belt at 0.25◦
×0.25◦ spatial and 3-hourly temporal resolutions for 3B42 and monthly temporal resolution for 3B43 (Huffman et al., 2007). The TMPA estimates are produced in four stages: (1) the microwave estimates of precipitation are cali-brated and combined, (2) infrared precipitation estimates are created using the calibrated microwave precipitation, (3) the microwave and infrared estimates are combined, and (4) rescaling to monthly data is applied (Huffman et al., 2007, 2010). The TMPA retrieval algorithm used for this product is based on the technique by Huff-man et al. (1995, 1997) and Huffman (1997). In this paper, TMPA data types used are of 3B43 version 6 (V6).
Furthermore, the version 4 (V4) of SST from the TMI is used to determine the environmental factors that affect the spatial-temporal variations of ENSO–rainfall (IOD–rainfall) relations. The inclusion of the 10.7 GHz channel in the TMI provides the additional capability to accurately measure SST through clouds (Wentzet al., 2000).
The TMPA 3B43 V6 can be referred to from the web-site ftp://disc2.nascom.nasa.gov/data/s4pa/ TRMM_L3/. The SOI and DMI data are obtained from the websites http://www.bom.gov.au/ and http://www.jamstec.go.jp/, respectively. In addition, the V4 of SST data from TMI can be referred to from the website ftp://ftp.ssmi.com/tmi.
2.2. Methods
Statistical score can be used to analyse the relationship of TMPA to the SOI and DMI values. The proximity of the satellite estimates to the index values are measured by the linear correlation coefficient. In the statistical lexicon, the correlation is used to describe a linear statistical relationship between two random variables that vary together precisely, one variable being related to the other by means of a positive (negative) scaling factor (von Storch and Zwiers, 1999). Positive (negative) correlation between rainfall and SOI indicates that the warm event in the Pacific Basin can lead to decreased (increased) rainfall, whereas the opposite tends to occur during the cold event. Meanwhile, negative (positive) correlation between rainfall and DMI indicates that the cold event in the eastern tropical Indian Ocean can lead to decreased
(increased) rainfall, whereas the opposite tends to occur during the warm event. Confidence levels of 95% and 99% are used to determine the significance level of correlation.
The main analysis in this research is about the monthly relationship, but similar measures have been applied to the seasonal analysis as well. Analysis carried out in each pixel is with the coordinates as identity. Data extracted from the TMPA in each pixel are used to generate point-by-point data. The point gives the coordinate, month, year, and rainfall values. The data are then sorted in accordance with the purposes of analysis. The same sorting process is also carried out on index values (SOI and DMI), and followed by calculations with the linear correlation. After obtaining the correlation value, the point data is converted into a raster data format that has the same spatial resolution as the original data (0.25◦
×0.25◦).
Monthly analysis is carried out by correlating the monthly data of the same month from the yearly obser-vation. Seasonal analysis are carried out based on the monsoon activity, where the seasons are divided into four groups: December–January–February (DJF), March–April–May (MAM), June–July– August (JJA), and September–October–November (SON). DJF repre-sents the peak of the northwest Australia– Asia mon-soon, and JJA represented the peak of the southeast Australia– Asia monsoon, while both MAM and SON represent monsoon transitions (Aldrian and Susanto, 2003). Seasonal analysis will be carried out by correlat-ing the monthly data of the same season from the yearly observation.
RAINFALL RESPONSE TO ENSO AND IOD OVER INDONESIA
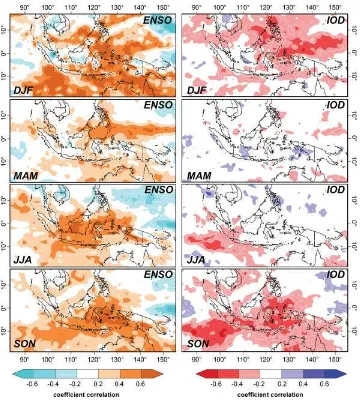
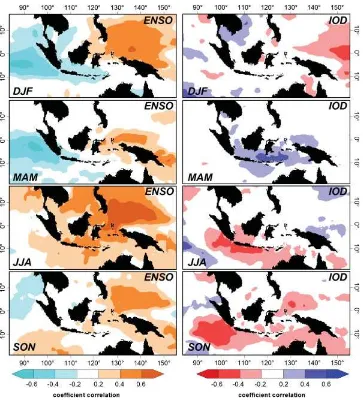
Figure 2. Spatial patterns seasonal analysis of the relationship between rainfall with ENSO and IOD. White dashed line and solid line indicate significant level of correlation under 95% and 99%, respectively.
(Blair, 1918):
r12,3 = r12−r13r23
1−r132 1−r 2 23
, (1)
wherer12,3is the partial correlation between two random
variables, 1 and 2, after removing the controlling effect of another random variable, 3. When the effect of IOD is removed, variables 1, 2, and 3 can be taken as rainfall, the SOI, and the DMI, respectively. In addition, if we reverse the roles of 2 and 3, r12,3 would become a measure of
the rainfall related to the IOD and the effect of ENSO is removed. In case the effect of IOD is removed,r12 and
r13 are the simple correlations between rainfall and SOI,
and rainfall and DMI, respectively. The opposite effect results when ENSO is removed. When the effect of IOD is removed, the square of the quantity,r12,3, answers the
question of how much of the rainfall variance that is not estimated by IOD in the equation is estimated by ENSO, whereas the opposite tends to occur when the effect of ENSO is removed.
3. Results
3.1. Seasonal analysis
During MAM season, ENSO effect is not as wide as other monsoon seasons; moreover, IOD phenomenon has very small effect concerning rainfall in Indonesia. ENSO effect is found only outside Indonesia, e.g. the northern and southern parts of Kalimantan except the eastern area of Kalimantan. Outside of Indonesia, regions affected by the ENSO phenomenon in MAM season are northern part of Sulawesi, northern part of Maluku, southern part of Nusa Tenggara island, and southern part of Papua. During this season, the IOD phenomenon is correlated only with the rainfall in the southern coast of Papua and Maluku Island. Meanwhile, the type of correlation is positive, which means in positive IOD, the rainfall increases.
Spatial patterns responses between rainfall with ENSO and IOD during JJA season can be seen clearly and are clustered. The widest ENSO effect on Indonesian rainfall can be found in JJA season. The rainfall shows insignificant correlation with ENSO in the western part of Sumatra, northeast of Kalimantan and northern part of Papua. Meanwhile, the IOD effect on rainfall fluctuation in Indonesia which is found as a cluster in the southwest of Indonesia is in the small part of southeast of Sumatra and in the western part of Java. During the SON period, the widest spatial distribution of correlation between rainfall with ENSO and IOD in the Indonesian area was found. The ENSO effect has been seen to decrease in the west and move to the eastern part of Indonesia. Relationship between rainfall and ENSO in Kalimantan, Sumatra, and Java islands has smaller correlation compared to JJA season. Meanwhile, Sulawesi and Maluku Island have strong correlation with ENSO. Influence of IOD on rainfall in this season is found to move to the eastern part of Indonesia. Besides the influence of rainfall in the southeast of Sumatra and Java, the IOD effect can also be found in Sulawesi, Nusa Tenggara, Maluku Island, and part of Papua.
Figure 3 shows the seasonal patterns of spatial partial correlation between TMPA rainfall with ENSO when the effect of IOD is removed, and with IOD when the effect of ENSO is removed. Generally, the spatial distributions of the partial correlation between rainfall with ENSO and IOD are similar to the spatial patterns of seasonal linear correlation except in ENSO during the SON season and in IOD during the DJF and SON seasons (compare Figures 2 and 3). Removal of the effects of IOD (ENSO) weakens the positive (negative) correlation with rainfall. However, IOD affects the spatial patterns of ENSO during SON season to reduce the spatial distributions of the ENSO effect. On the other hand, the spatial distributions of IOD are influenced by the ENSO phenomenon in DJF and SON seasons. In DJF season, the spatial patterns of partial correlation between rainfall and IOD are wider than the linear correlation (compare Figures 2(e) and 3(e)) which reduces negative correlation in the northern part of Maluku Island and produces positive correlation in the southeastern part of Indonesia. In SON season, the smallest spatial distribution of partial correlation was found as a cluster in the southwest of Indonesia and was not seen in the mainland of Indonesia.
3.2. Monthly analysis
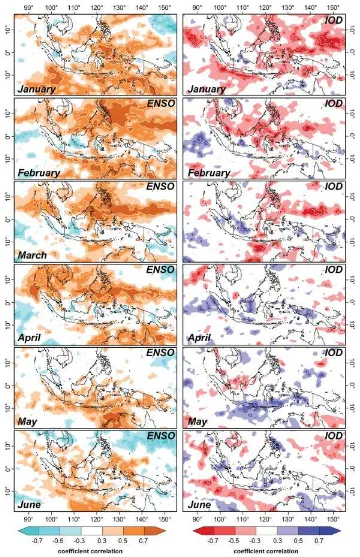
The second result in this study is the monthly spatial pat-terns relationship between rainfall and ENSO and IOD, which are presented in Figures 4 and 5. During January, the ENSO and IOD influence is obvious, particularly in the eastern part of Indonesia. In general, during February and June, the influences of both climate phenomena are not that clear in the mainland area. Influence of ENSO during February to May is seen outside the Indonesian archipelago, that is, the southern and northern parts. Dur-ing February to April, the positive correlation between rainfall and ENSO could be seen clustered outside the Indonesian archipelago, that is, the northern part. How-ever, during April to June, the positive correlation value is seen outside of the Indonesian archipelago, that is, the southern part.
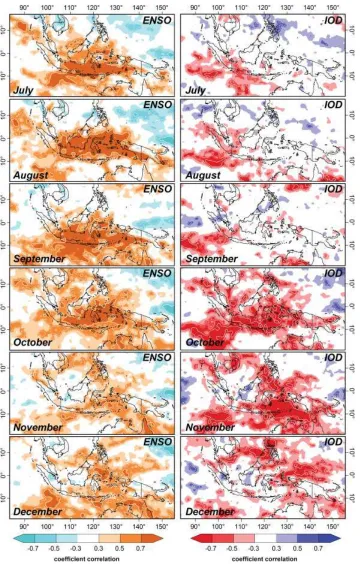
Strong response of ENSO during July occurred in the centre part of Indonesia, particularly in Java, Nusa Tenggara, Kalimantan, Sulawesi, and Maluku. On the other hand, a strong response of IOD occurred in the southern part outside of Indonesia, especially in Java. During August, the strong responses of ENSO remain in the centre part of Indonesia, but move slightly to the north (Kalimantan) and move out from Nusa Tenggara. Meanwhile, the strong influences of IOD are still found in the southern part outside of Indonesia which also occurred in September. The influences of ENSO in September are weaker than in August with a narrow distribution in the mainland area. During October, the influences of ENSO occur again in the mainland area of Indonesia, but with a lower response than in September. At the same time, the strong responses of IOD occurred in the southern part outside of Indonesia and in the centre part of Indonesia, especially in Java, Nusa Tenggara, Sulawesi, and Maluku. During November, ENSO effects begin to weaken and continue to occur until December, while the IOD effect moved slightly to the east and continue to the northeast of Indonesia in December. Influence of both climate phenomena during November is higher in the eastern part of Indonesia. The ENSO influence persists during December, whereas, at the same time, the IOD influence is not so clear in the mainland of Indonesia.
RAINFALL RESPONSE TO ENSO AND IOD OVER INDONESIA
Figure 3. Seasonal patterns of spatial partial correlation between TMPA rainfall with (a) ENSO when the effect of IOD is removed and (b) IOD when the effect of ENSO is removed. White dashed line and solid line indicate significant level of correlation under 95% and 99%, respectively.
February, May, September, and December that are similar to the linear correlation (compare Figures 4 and 5 with Figure 7). The dominant influence of ENSO on rainfall in Indonesia when the effect of IOD is removed occurred in July and October, whereas that of IOD when the effect of ENSO is removed occurred in July, August, and September.
During January, March, and October, the partial cor-relation distributions of both climate phenomena’s influ-ence on rainfall are smaller than the liner correlation. Responses of rainfall on ENSO and IOD are disappear-ing in the mainland of Indonesia and reduced in the area of high partial correlation. In February, September, and December, partial correlations of both climate phenom-ena are similar to the linear correlation. This is shown by ENSO and IOD that are not affected by each other. Dif-ferent spatial patterns have been seen in June and July, where the partial correlation of both indices is wider than the total correlation. When the effect of IOD is removed, the ENSO partial correlation distribution is wider to the
south that appears to have a large degree of indepen-dence from ENSO. However, when the effect of ENSO is removed, the partial correlation of IOD has a wider spatial distribution than the total correlation. In June, the positive partial correlation occurs in the southern part of Indonesia, and in July, the partial correlation distri-bution occurs in the southern part of Indonesia, e.g. in Java, southern part of Sulawesi, and western part of Nusa Tenggara. The same conditions occurred in August as well where the spatial distribution of partial correlation is smaller than that in July.
4. Discussion
Figure 4. Monthly analysis of spatial patterns relationship between rainfall with ENSO and IOD, during January to June. White dashed line and solid line indicate significant level of correlation under 95% and 99%, respectively.
ENSO and IOD over Indonesia, where the distribution of data was quite capable of providing different information about the ENSO and IOD effects on mainland and sea.
Using the TMPA data to investigate the relationship between rainfall with ENSO and IOD has given an interesting spatial pattern. The relationship between rain-fall and both indices not only describe land condition but also show spatial patterns interaction between both
RAINFALL RESPONSE TO ENSO AND IOD OVER INDONESIA
Figure 5. Same as Figure 4, but during July to December.
(Figure 2(b)), especially in March and April (Figure 4(c) and (d)). The spatial patterns distribution has shown that when most of the Indonesian land area is not corre-lated with ENSO, i.e. in the eastern part of Indone-sia, an agglomeration positive relationship zone between ENSO and rainfall could be found from the northeast of Kalimantan, northern part of Sulawesi, and Maluku to Papua. The findings are in general agreement with
Ropelewski and Halpert (1987, 1996) who state that the location of the ENSO effect occurs during October to May. On the other hand, TMPA data is not suitable to analyse the effects of local conditions on rainfall fluctua-tion because of low spatial resolufluctua-tion of the data, which is only 0.25◦.
Figure 6. Spatial patterns of monthly partial correlation between TMPA with ENSO when the effect of IOD is removed. White dashed line and solid line indicate significant level of correlation under 95% and 99%, respectively.
similar to linear correlation or different from smaller ones. However, during dry season the area of partial correlation is wider than that of linear correlation. This finding informs that during rainy season the effects of both indices are uneven. In addition to this situation, there is also an interesting phenomenon in the peak dry season (June and July), during which ENSO conditions
are strongly influenced by IOD, whereas the ENSO affected to IOD occur in the peak of dry season and in the beginning of rainy season.
RAINFALL RESPONSE TO ENSO AND IOD OVER INDONESIA
Figure 7. Same as Figure 6, but partial correlation with IOD when the effect of ENSO is removed.
in central Pacific region and lower SST in eastern Indian Ocean. On the other hand, decrease of SST in central Pacific and increase of SST in eastern Indian Ocean will cause increasing rainfall in most of the Indonesian area during dry season and advancing the rainy season. Meanwhile, during DJF season, ENSO and IOD have influenced only a small part of the Indonesian area, while during MAM monsoon season IOD does not influence
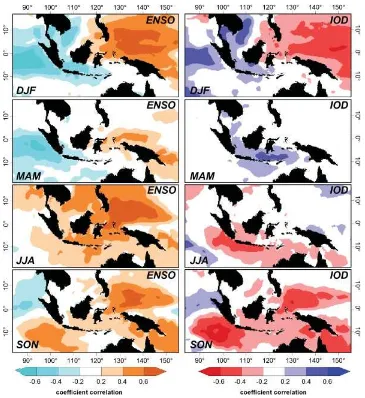
Figure 8. Seasonal analysis of the spatial patterns relationship between SST with ENSO and IOD.
High relationship between rainfall with ENSO and IOD in dry season could be a result of both those phenomena being influenced by SST in Indonesian seas and surroundings (Hendon, 2003). Further analysis on seasonal SST from TMI data through the period from 1998 to 2010 by using linear and partial correlation, respectively, are described in Figures 8 and 9. During JJA and SON seasons, the SST in inland sea of Indonesia has positive correlation with SOI and negative correlation with DMI (Figure 8(c), (d), (g), and (h)). However, for DJF and MAM, uneven correlations occur between SST and both indices in Indonesian inland sea, which ultimately affects unobvious correlations between rainfall with ENSO and IOD in rainy season (Figure 8 (a), (b), (e), and (f)). The seasonal spatial-temporal patterns of linear correlation between SST with both indices confirmed fairly similar patterns with rainfall–ENSO (rainfall–IOD) linear relationship (see Figure 2). In addition, the partial correlation analysis of SST with ENSO and IOD showed that both the phenomena interact in the peak dry season until the beginning of rainy season (Figure 9), where a similar phenomenon also
occurs in partial correlation between rainfall– ENSO and rainfall–IOD (see Figure 3). These observations indicate regional and local air–sea interaction and impacted the dynamic spatial-temporal relationship between rainfalls with both indices.
RAINFALL RESPONSE TO ENSO AND IOD OVER INDONESIA
Figure 9. Seasonal patterns of spatial partial correlation between SST rainfall with (a) ENSO when the effect of IOD is removed and (b) IOD when the effect of ENSO is removed.
correlation with DMI. Cool SST anomalies lead to less evaporation and less rain, and warm SST anomalies lead to enhanced evaporation and more rain. Furthermore, they are consistent with the atmospheric circulation anomalies: more rain happens when there is anomalous surface convergence and updrafts, and less rain happens when there is anomalous surface divergence and downdrafts (Saji and Yamagata, 2003b).
The above findings show that air–sea interaction in Indonesia and its surroundings plays an important role in the difference in the ENSO and IOD strength concern-ing rainfall fluctuation in the spatial-temporal case. The existence of clustering distributions in ENSO and IOD affects the rain in spatial-temporal distribution, indicat-ing that there are other effects, other than the previously described SST, which limit the ENSO and IOD effect in rainfall fluctuation in Indonesia and the surrounding area. Large clustering distributions indicate that local complex distribution of land terrain and intra-seasonal oscillation was not enough to influence the spatial-temporal cluster-ing. However, regional and global effects may lead to a
clustering zone relationship between rainfalls with both indices. For example, the existence of the Inter-Tropical Convergence Zone (ITCZ) which is the meeting area of Hedley circulation from north and south may create the clustering zone in this area. The ITCZ stripe fluctuates as a result of the movement of sun and the temperature on earth surface. The fluctuation of ITCZ and the differ-ence in the early process during SON and MAM probably could explain in detail the reason for a strong relation-ship between rainfall with ENSO and IOD during SON and unclear correlation during MAM. Meanwhile, fur-ther research regarding these correlations and integration to another process with ITCZ are needed to ensure the ITCZ effect concerning spatial-temporal correlation with rainfall and ENSO and IOD in Indonesia.
5. Conclusion
seasonal and monthly analysis. The results show that remote sensing data can provide good spatial-temporal clustering interactions information about the relationship between rainfall and ENSO and IOD in land and ocean area. The existence of spatial-temporal clustering zone gives the probability information on global climate which influences the difference in the ENSO and IOD strength, such as the SST and ITCZ effect.
Both ENSO and IOD have similar spatial-temporal pattern in influencing the rainfall in Indonesia. Both of those phenomena influence the rainfall fluctuation during the dry season. Meanwhile, during the rainy season, the effect is not explained clearly, especially in Indonesia. Spatial image shows that ENSO and IOD have a dynamic relationship that influences the rainfall in Indonesia. Generally, ENSO influences the rainfall fluctuation in most part of Indonesia, except the western and eastern parts. Meanwhile, IOD influences only the southern part of Indonesia especially the southeastern part of Sumatra and the western part of Java. Based on the spatial-temporal pattern that is produced, it can be concluded that the relationship between rainfall with ENSO begins in JJA, especially in July, in the southwest and central parts of Indonesia. During SON, the ENSO effect begins to move from the western part of Indonesia towards the north and a small part of south Indonesia. The ENSO effect during DJF begins to move from Indonesia towards the north and a small part of south Indonesia. Meanwhile, during MAM, especially in April, the ENSO effect moves from Indonesia and clusters to the east and southeast of Indonesia. A similar outcome also happens during the IOD phenomenon. The IOD effect begins in the southwest part of Indonesia in JJA, i.e. in July. The IOD effect begins to leave the southwest part and moves to the northeast part of Indonesia during DJF, especially in January. Also during MAM, the IOD effect moves away from Indonesia and its surrounding areas.
Acknowledgements
We gratefully acknowledge the data received from the following organizations: TMPA Satellite data from the National Aeronautics and Space Administration (NASA) Goddard Space Flight Centre (GSFC) Homepage; SOI data from the Bureau of Meteorology (BOM) Australian Government; DMI data from the Japan Agency for Marine-Earth Science and Technology (JAMSTEC); and TMI SST data from the Remote Sensing Systems (RSS) Homepage.
References
Aldrian E, Djamil YS. 2008. Spatio-temporal climatic change of rainfall in East Java Indonesia.Int. J. Climatol.28: 435–448. Aldrian E, Susanto RD. 2003. Identification of three dominant rainfall
regions within Indonesia and their relationship to sea surface temperature.Int. J. Climatol.23: 1435–1452.
Aldrian E, Gates LD, Widodo FH. 2007. Seasonal variability of Indonesian rainfall in ECHAM4 simulations and in the reanalyses: the role of ENSO.Theor. Appl. Climatol.87: 41–59.
Ashok K, Saji NH. 2007. On the impacts of ENSO and Indian Ocean Dipole events on sub-regional Indian summer monsoon rainfall.Nat. Hazards 42: 273–285.
Ashok K, Nakamura H, Yamagata T. 2007. Impacts of ENSO and Indian Ocean Dipole events on the Southern Hemisphere storm-track activity during austral winter.J. Clim.20: 3147–3163.
As-syakur AR, Tanaka T, Osawa T, Mahendra MS. 2013. Indonesian rainfall variability observation using TRMM multi-satellite data.Int. J. Remote Sens.34: 7723–7738.
As-syakur AR, Tanaka T, Prasetia R, Swardika IK, Kasa IW. 2011. Comparison of TRMM Multisatellite Precipitation Analysis (TMPA) products and daily-monthly gauge data over Bali Island. Int. J. Remote Sens.32: 8969–8982.
Bannu, KH, Takeuchi N, Suriamihardja DA. 2005. Impacts of the sea surface temperature anomaly in the Pacific and Indian Oceans on the Indonesian climate.Paper presented at the 11th CEReS International Symposium on Remote Sensing, 13–14 December 2005, Chiba University, Chiba, Japan.
Bell GD, Halpert MS. 1998. Climate assessment for 1997.Bull. Am. Meteorol. Soc.79: S1–S50.
Bell GD, Halpert MS, Ropelewski CF, Kousky VE, Douglas AV, Schnell RC, Gelman ME. 1999. Climate assessment for 1998.Bull. Am. Meteorol. Soc.80: S1–S48.
Bell GD, Halpert MS, Schnell RC, Higgins RV, Lawrimore J, Kousky VE, Tinker R, Thiaw W, Chelliah M, Artusa A. 2000. Climate assessment for 1999.Bull. Am. Meteorol. Soc.81: S1–S50. Blair AT. 1918. Partial correlation applied to Dakota data on weather
and wheat yield.Mon. Weather Rev.46: 71–73.
Cai W, Van Rensch P, Cowan T, Hendon HH. 2011. Teleconnection pathways of ENSO and the IOD and the mechanisms for impacts on Australian rainfall.J. Clim.24: 3910–3923.
Chang C-P, Wang Z, McBride J, Liu C-H. 2005. Annual cycle of Southeast Asia – Maritime Continent rainfall and the asymmetric monsoon transition.J. Clim.18: 287–301.
Chokngamwong R, Chiu LS. 2008. Thailand daily rainfall and com-parison with TRMM products.J. Hydrometeorol.9: 256–266. Chrastansky A, Rotstayn LD. 2012. The effect of ENSO-induced
rainfall and circulation changes on the direct and indirect radiative forcing from Indonesian biomass-burning aerosols. Atmos. Chem. Phys.12: 11395–11416.
Cramer D. 2003. A cautionary tale of two statistics: Partial correlation and standardised partial regression.J. Psychol.137: 507–511. D’Arrigoa R, Wilson R. 2008. El Ni˜no and Indian Ocean influences
on Indonesian drought: implications for forecasting rainfall and crop productivity.Int. J. Climatol.28: 611–616.
Delbanco SF, Parker ML, McIntosh M, Kannel S, Hoff T, Stewart FH. 1998. Missed opportunities: teenagers and emergency contraception.
Arch. Pediatr. Adolesc. Med.152: 727–733.
Feidas H. 2010. Validation of satellite rainfall products over Greece.
Theor. Appl. Climatol.99: 193–216.
Fleming K, Awange JL, Kuhn M, Featherstone W. 2011. Evaluating the TRMM 3B43 monthly precipitation product using gridded raingauge data over Australia. Aust. Meteorol. Oceanogr. J. 61: 171–184.
Gutman G, Csiszar I, Romanov P. 2000. Using NOAA/AVHRR products to monitor El Ni˜no impacts: focus on Indonesia in 1997–98.
Bull. Am. Meteorol. Soc.81: 1189–1205.
Hamada J-I, Yamanaka MD, Matsumoto J, Fukao S, Winarso PA, Sribimawati T. 2002. Spatial and temporal variations of the rainy season over Indonesia and their link to ENSO.J. Meteorol. Soc. Jpn
80: 285–310.
Hamada J-I, Mori S, Kubota H, Yamanaka MD, Haryoko U, Lestari S, Sulistyowati R, Syamsudin F. 2012. Interannual rainfall variability over northwestern Jawa and its relation to the Indian Ocean Dipole and El Ni˜no-Southern Oscillation events.SOLA8: 69–72. Haylock M, McBride JL. 2001. Spatial coherence and predictability of
Indonesian wet season rainfall.J. Clim.14: 3882–3887.
Hendon HH. 2003. Indonesian rainfall variability: impacts of ENSO and local air–sea interaction.J. Clim.16: 1775–1790.
Hendon HH, Wheeler MC, Zhang C. 2007. Seasonal dependence of the MJO-ENSO relationship.J. Clim.20: 531–543.
Hidayat R, Kizu S. 2010. Influence of the Madden–Julian oscillation on Indonesian rainfall variability in austral summer.Int. J. Climatol.
30: 1816–1825.
Hong Y, Adler RF, Huffman GJ, Pierce H. 2010. Applications of TRMM-Based Multi-Satellite Precipitation Estimation for global runoff prediction: prototyping a global flood modelling system. In
RAINFALL RESPONSE TO ENSO AND IOD OVER INDONESIA M, Hossain F (eds). Springer Verlag: Dordrecht, the Netherlands;
245–266.
Huffman GJ. 1997. Estimates of root-mean-square random error for finite samples of estimated precipitation. J. Appl. Meteorol. 36: 1191–1201.
Huffman GJ, Adler RF, Bolvin DT, Nelkin EJ. 2010. The TRMM Multi-satellite Precipitation Analysis (TMPA). InSatellite Rainfall Applications for Surface Hydrology, Gebremichael M, Hossain F (eds). Springer Verlag: Dordrecht, the Netherlands; 3–22. Huffman GJ, Adler RF, Rudolf B, Schneider U, Keehn PR. 1995.
Global precipitation estimates based on a technique for combining satellite-based estimates, rain gauge analysis, and NWP model precipitation information.J. Clim.8: 1284–1295.
Huffman GJ, Adler RF, Bolvin DT, Gu G, Nelkin EJ, Bowman KP, Hong Y, Stocker EF, Wolff DB. 2007. The TRMM Multisatellite Precipitation Analysis (TMPA): quasi-global, multiyear, combined-sensor precipitation estimates at fine scales. J. Hydrometeorol. 8: 38–55.
Huffman GJ, Adler RF, Arkin P, Chang A, Ferraro R, Gruber A, Janowiak J, McNab A, Rudolph B, Schneider U. 1997. The global precipitation climatology project (GPCP) combined precipitation dataset.Bull. Am. Meteorol. Soc.78: 5–20.
Islam MN, Uyeda H. 2007. Use of TRMM in determining the climatic characteristics of rainfall over Bangladesh. Remote Sens. Environ.
108: 264–276.
Irawan B. 2003. Multilevel impact assessment and coping strategies against El Ni˜no: case of food crops in Indonesia. CGPRT Centre Working Paper No. 75, Regional Co-ordination Centre for Research and Development of Coarse Grains, Pulses, Roots and Tuber Crops in the Humid Tropics of Asia and the Pacific: United Nations, 105 p.
Kishore K, Subbiah AR. 2002. 1998–99 La Ni˜na in Indonesia: forecasts and institutional responses. InLa Ni˜na and Its Impacts: Facts and Speculation, Glantz MH (ed). United Nations University Press: Tokyo, Japan; 179–185.
K¨onnen GP, Jones PD, Kaltofen MH, Allan RJ. 1998. Pre-1866 extensions of the Southern Oscillation Index using early Indonesian and Tahitian meteorological readings.J. Clim.11: 2325–2339. Kummerow C, Simpson J, Thiele O, Barnes W, Chang ATC, Stocker
E. 2000. The status of the Tropical Rainfall Measuring Mission (TRMM) after two years in orbit.J. Appl. Meteorol.39: 1965–1982. Levizzani V, Amorati R, Meneguzzo F. 2002. A review of satellite-based rainfall estimation methods. European Commission Project MUSIC Rep. EVK1-CT-2000-00058, 66 p.
Luo J-J, Zhang R, Behera SK, Masumoto Y, Jin FF, Lukas R, Yamagata T. 2010. Interaction between El Ni˜no and extreme Indian Ocean Dipole.J. Clim.23: 726–742.
Madden RA, Julian PR. 1971. Detection of a 40–50 day oscillation in the zonal wind in the tropical Pacific.J. Atmos. Sci.28: 702–708. McBride JL, Haylock MR, Nicholls N. 2003. Relationships between
the Maritime Continent heat source and the El Ni˜no–Southern Oscillation phenomenon.J. Clim.16: 2905–2914.
Mehta AV, Yang S. 2008. Precipitation climatology over the Mediter-ranean basin from ten years of TRMM measurements.Adv. Geosci. 17: 87–91.
Meyers G, McIntosh P, Pigot L, Pook M. 2007. The years of El Ni˜no, La Ni˜na, and interactions with the Tropical Indian Ocean.J. Clim.
20: 2872–2880.
Naylor LN, Falcon WP, Rochberg D, Wada N. 2001. Using El Ni˜no/Southern Oscillation climate data to predict rice production in Indonesia.Clim. Change50: 255–265.
Nicholls N. 1988. El Ni˜no-Southern Oscillation and rainfall variability.
J. Clim.1: 418–421.
Oh JH, Kim KY, Lim GH. 2012. Impact of MJO on the diurnal cycle of rainfall over the western Maritime Continent in the austral summer.
Clim. Dyn.38: 1167–1180.
Petty GW. 1995. The status of satellite-based rainfall estimation over land.Remote Sens. Environ.51: 125–137.
Petty GW, Krajewski WF. 1996. Satellite estimation of precipitation over land.Hydrol. Sci.41: 433–451.
Philander SG. 1990.El Ni˜no, La Ni˜na, and the Southern Oscillation. Academic Press, 289 p: San Diego, CA.
Pohl B, Matthews AJ. 2007. Observed changes in the lifetime and amplitude of the Madden-Julian oscillation associated with
interannual ENSO sea surface temperature anomalies.J. Clim.20: 2659–2674.
Prasetia R, As-syakur AR, Osawa T. 2013. Validation of TRMM Precipitation Radar satellite data over Indonesian region. Theor. Appl. Climatol.112: 575–587.
Qian J-H. 2008. Why precipitation is mostly concentrated over islands in the Maritime Continent.J. Atmos. Sci.65: 1428–1441. Qian J-H, Robertson AW, Moron V. 2010. Interactions among ENSO,
the monsoon, and diurnal cycle in rainfall variability over Java, Indonesia.J. Atmos. Sci.67: 3509–3524.
Rao SA, Masson S, Luo JJ, Behera SK, Yamagata T. 2007. Termination of Indian Ocean Dipole events in a coupled general circulation model.J. Clim.20: 3018–3035.
Ropelewski CF, Halpert MS. 1987. Global and regional scale precip-itation patterns associated with the El Ni˜no–Southern Oscillation.
Mon. Weather Rev.115: 1606–1626.
Ropelewski CF, Halpert MS. 1989. Precipitation patterns associated with the high index phase of the Southern Oscillation.J. Clim.2: 268–284.
Ropelewski CF, Halpert MS. 1996. Quantifying Southern Oscillation–precipitation relationships.J. Clim.9: 1043–1059. Ropelewski CF, Jones PD. 1987. An extension of the Tahiti-Darwin
Southern Oscillation Index.Mon. Weather Rev.115: 2161–2165. Sahu N, Behera SK, Yamashiki Y, Takara K, Yamagata T. 2012. IOD
and ENSO impacts on the extreme stream-flows of Citarum river in Indonesia.Clim. Dyn.39: 1673–1680.
Saji NH, Yamagata T. 2003a. Structure of SST and surface wind variability during Indian Ocean Dipole Mode years: COADS obser-vations.J. Clim.16: 2735–2751.
Saji NH, Yamagata T. 2003b. Possible impacts of Indian Ocean Dipole mode events on global climate.Clim. Res.25: 151–169.
Saji NH, Goswami BN, Vinayachandran PN, Yamagata T. 1999. A dipole mode in the tropical Indian Ocean.Nature401: 360–363. Semire FA, Mohd-Mokhtar R, Ismail W, Norizah M, Mandeep JS.
2012. Ground validation of space-borne satellite rainfall products in Malaysia.Adv. Space Res.50: 1241–1249.
Sobel AH, Burleyson CD, Yuter SE. 2011. Rain on small tropical islands.J. Geophys. Res.116: D08102.1–D08102.15.
Susilo GE, Yamamoto K, Imai T, Ishii Y, Fukami H, Sekine M. 2013. The effect of ENSO on rainfall characteristics in the tropical peatland areas of Central Kalimantan, Indonesia.Hydrol. Sci. J.58: 539–548. Tang Y, Yu B. 2008. MJO and its relationship to ENSO.J. Geophys.
Res.113: D14106.1–D14106.18.
Trenberth KE. 1997. The definition of El Ni˜no.Bull. Am. Meteorol. Soc.78: 2771–2777.
Vernimmen RRE, Hooijer A, Mamenun AE, van Dijk AIJM. 2012. Evaluation and bias correction of satellite rainfall data for drought monitoring in Indonesia.Hydrol. Earth Syst. Sci.16: 113–146. von Storch H, Zwiers FW. 1999. Statistical Analysis in Climate
Research. Cambridge University Press, 484 p: Cambridge, UK. Waliser DE, Moncrieff MW, Burridge D, Fink AH, Gochis D, Goswami
BN, Guan B, Harr P, Heming J, Hsu H-H, Jakob C, Janiga M, Johnson R, Jones S, Knippertz P, Marengo J, Nguyen H, Pope M, Serra Y, Thorncroft C, Wheeler M, Wood R, Yuter S. 2012. The “year” of tropical convection (May 2008–April 2010): climate variability and weather highlights. Bull. Am. Meteorol. Soc. 93: 1189–1218.
Waple AM, Lawrimore JH. 2003. State of the climate in 2002.Bull. Am. Meteorol. Soc.84: S1–S68.
Wentz FJ, Gentemann C, Smith D, Chelton D. 2000. Satellite mea-surements of sea surface temperature through clouds.Science288: 847–850.
Wheeler MC, Hendon HH. 2004. An all-season real-time multivariate MJO index: development of an index for monitoring and prediction.
Mon. Weather Rev.132: 1917–1932.
Wilson EA, Gordon AL, Kim D. 2013. Observations of the Madden Julian oscillation during Indian Ocean Dipole events.J. Geophys. Res.118: 2588–2599.
Xie P, Arkin PA. 1996. Analyses of global monthly precipitation using gauge observations, satellite estimates and numerical model predictions.J. Clim.9: 840–858.
Xie P, Yatagai A, Chen M, Hayasaka T, Fukushima Y, Liu C, Yang S. 2007. A gauge-based analysis of daily precipitation over East Asia.