Satisfaction and Engagement Modeling of PT. Garuda Indonesia
(Persero) Tbk Employee Using Second Order Confirmatory Factor
Analysis (CFA) and Structural Equation Modeling (SEM)
(1)Rusdi Hidayat N
(2)Bambang Widjanarko Otok and
(3)
Cristian Monang Pebrianto X. Lumbanbatu
(4)Lukman Arif
(1)
Departement of Business Administration, Faculty of Social and Politics Scince
UPN “Veteran” Jawa Timur
e-mail : [email protected]
(2) (3)
Department of Statistics, Faculty of Mathematics, Computing and Data Science, Institut Teknologi
Sepuluh Nopember (ITS)
Jl. Arief Rahman Hakim, Surabaya 60111 Indonesia
e-mail:
(2)[email protected] dan
(2)[email protected]
(4)
Departement of Public Administration, Faculty of Social and Politics Scince UPN “Veteran” Jawa Timur
Jl. Raya Rungkut Madya Gunung Anyar, Surabaya Indonesia
ABSTRACT
In order to analyze psychological relationship between employee and company, PT. Garuda Indonesia (Persero) Tbk conducts two types of survey: Satisfaction and Employee Engagement Survey. Both types of surveys have indicators that grouped into their respective latent variables. Normal multiva- riate assumption testing indicates that the data has followed a normal multivariate distribution. The First Order CFA results indicate that the indicators are valid, but there is one latent variable that is not reliable so can not be used in modeling. In Second Order CFA we found fit model that can explain the relationship between latent variable with Satisfaction and Enga- gement, where the latent variable of Satisfaction and Engage- ment give a significant positive effect. The latent variables that have the highest influence on Employee Satisfaction are Career Management System (0.982), Performance Management System (0.976), and Reward System (0.970). While latent variables that provide the highest influence on Employee Engagement are Mission & Goals (0.996), Basic (0.994), and Compensation (0.972). In addition, relationship between Satisfaction and Enga- gement obtained a structural model, where Employee Satisfac- tion give a significant positive effect on Employee Engagement (0.474).
Keywords— Employee, Engagement,First Order, Satisfaction, Second Order CFA, SEM
I. INTRODUCTION
Every company needs a good employee management sys-tem to create a balance between the needs of employees with the demands given by the company to create high producti-vity as well as companies and employees mutually benefit each other. Therefore, the company must build a good psy-chological relationship with its employees. There are four le-vels of employees' psychological relationships with the com-pany, ie satisfied, motivated, committed and engaged [1].
Making an engaged employess is a goal of the company be-cause it gives a very positive impact for the development of the company.
X(ξ)
Management System, Performance Management System, and Working Conditions. While the Employee Engagement survey is used to determine the employee's engagement to the company. The Employee Engagement survey has 16 indicators that are grouped into 7 dimensions, namely basic, mission & goals, recognition, development, compensation, leadership, and teamwork [2].
This study conducted modeling the effect of employee satisfaction on employee engagement in PT. Garuda Indone-sia (Persero) Tbk using Structural Equation Modeling (SEM) method. Structural Equation Modeling (SEM) is a statistical method used to combine several aspects of path analysis and Confirmatory Factor Analysis (CFA) to estimate some equa-tions thoroughly or simultaneously [3]. SEM involves varia-bles that can not be directly measured, requiring the indicator variable as a measurable variable. In this case, the variables that can not be measured are Employee Satisfaction and Em-ployee Engagement.
One of the steps in SEM is Confirmatory Factor Analysis (CFA). CFA is a method used to test the measurement model that describes the relationship between latent variables with the indicator. In CFA, latent variables are considered as causal variables (independent variables) underlying indicator variables. CFA consists of two types, namely first order CFA and high order / second order CFA. A problem allows latent variables can not be directly measured through the indicator variables. The latent variable need another variable that can explain the latent variable. In this case the First Order Con-fimatory Factor Analysis can not be used, so the higher order is used, ie the second order confirmatory factor analysis. This study uses Second Order CFA because the indicator variables on the employee satisfaction and engagement data can not be measured directly, thus requiring additional indicator varia-bles.
II. LITERATURE REVIEW A. Confirmatory Factor Analysis(CFA)
Confirmatory Factor Analysis (CFA) is a method that used to test a measurement model that illustrates the relation-ship between latent variables and their indicators [4]. In CFA, latent variables are considered as the underlying cause va-riable of the indicator vava-riable. CFA is divided into two types, namely First Order CFA and Second Order CFA.
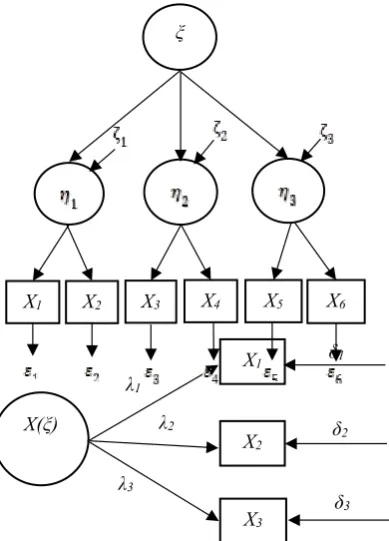
1.First Order Confrimatory Factor Analysis(CFA)
In the first order confirmatory factor analysis (CFA) a latent variable is measured based on several indicators that can be measured directly.
Figure 1.First OrderCFA
CFA first order model can be written as the following equation.
with,
is an indicator of the common factor is the loading factor of the model
is the single factor (unique factor) for each error term equation [5].
CFAs can also be used to test the questions in question-naires whether they are truly representative (valid) and com-pletely accurate or consistent (reliable). Variables are valid if they have a loading factor> 0.5 and p-value <0.05. While to measure the reliability is done by using construct reliability calculated using the following formula:
with = loading factor, dan is the indicator error variance, i = 1,2,… n. This measure is acceptable if the coefficient of construct reliability (CR)> 0.60 and indicates that the indicator on the model construct has been good [5].
2.Second Order Confirmatory Factor Analysis
The difference of first order CFA with second order CFA is that in second order CFA latent variable is not measured directly through the rating indicator, but through another latent variable.
Figure 2.Second OrderCFA
The equation of the relationship between the first order confirmatory analysis and the high order confirmatory ana-lysis is shown in the equation below [5].
ξ
where,
Bis the loading coefficient
ΓandΛis the loading factor of first and second order is the random vector of latent variables
is the residual
B. Structural Equation Modelling (SEM)
Structural Equation Modeling (SEM) is a statistical me-thod used to combine several aspects of path analysis and confirmatory factor analysis (CFA) to estimate some equation thoroughly or simultaneously. There are two approaches used in SEM, namely Covariance Based-Structural Equation Mo- deling (CB-SEM) and Variance Based-Structural Equation Modeling (VB-SEM). However, this research only uses CB-SEM approach.
CB-SEM is a covariance-based analysis and focuses on estimating a set of model parameters so that the covariant matrix constructed theoretically can be well implied by the system of structural equations obtained. In CB-SEM there are two models of measurement model and structural model. The measurement model serves to calculate the relationship bet-ween indepent and dependent latent variables, while the structural model is used to calculate the relationship between the indicator variable with latent variable.
C. SEM Parameter Estimation
The most commonly used method for estimating para-meters in SEM is Maximum Likelihood Estimation (MLE) [3]. Let N be the identical and dependent random sample Z of the variable random Z that is multinormal distributed with mean 0 and variance , then the probability density function is , where is a fixed parameter used to determine the probability of Z density:
The joint density is the multiplication of the marginal density of because are independent. If observed values for on a sample, then can write likelihood function as follows:
where is the value of . That equation is a likelihood function commonly abbreviated as . The probability density function becomes:
For a random sample of N independent observations of z, the joint density is shown in the following equation,
with likelihood function as follows:
So the likelihood function can be written as follows:
S is a sample of the maximum likelihood matrix of sample covariant variance, so can be written as the follo- wing equation:
1
log ( ) log ( )
L
tr
( )
Σ
SΣ
Maximizing likelihood function is equivalent to minimize FMLso that function is obtained [7]:
S is the sample variance and covariance matrix and is the variance and covariance matrix of the population parameter [3].
D. Normal Multivariate Asumption
To check whether a data follows a multivariate normal distribution or not, a multivariate normal distribution test is performed. Here is the hypothesis used:
H0 : The data has a normal multivariate distribution
H1 : The data does not have a normal multivariate
distri-bution
The test statistic used is rQ, by the formula:
The critical area of this test is to reject H0 at the
level α if ≤ r table obtained from Q-Q plot correlation coefficient [4].
E. Goodness of Fit
A good measure for model conformity tests and statistical tests is grouped into two ie:
- Absolute Fit Measure
Absolute fit measure is a way of measuring the overall fit model with several criteria as follows.
1. Chi-Square Statistic
The expected result is the smallest possible or p-value> α , where α equal to 0,05.
2. Goodness of Fit Index(GFI) The GFI formula is as follows:
When GFI ≥ 0,90 means a good fit, while, while 0,80 ≤ GFI ≤ 0,90 is called marginal fit.
3. Root Mean Square Error of Approximate(RMSEA) One formative index in SEM is given the following RMSEA formula
The RMSEA value ≤ 0.05 denotes close fit, whereas 0.05 ≤ RMSEA ≤ 0.08 indicates good fit.
- Increment Fit Measure
Increment Fit Measure is comparing the proposed model with the baseline model which is often referred to as the null model or independence model.
1. Adjusted Goodness of Fit(AGFI)
The recommended value is equal to or greater than 0.9.
2. Tucker-Lewis Index / Non Formed Fit Index(TLI) TLI value ranges from 0 to 1, with TLI value ≥ 0.90 indicates goodness if fit, whereas apabilai 0.80 ≤ TLI ≤ 0.90 is often called marginal fit.
3. Comparative Fit Index(CFI)
The CFI values also range from 0 to 1. For CFI values > 0,90 denotes goodness of fit, whereas 0.80 ≤ CFI ≤ 0.90 is often called marginal fit.
F. Employee Satisfaction and Employee Engagement Employee satisfaction can be defined as the feelings and reactions of employees to their work environment [6]. As-pects that shape employee satisfaction are psychological as-pects, physical asas-pects, social asas-pects, and financial aspects.
While employee engagement is a condition that illustra-tes the persistent and innovative commitment and effort of the employees to achieve organizational goals [2]. Employees who are tied to the company display the best quality work, creative in completing individual tasks as well as teams.
III. RESEARCH METHODOLOGY A. Data Source
The data that used in this study is secondary data obtain-ned from the database unit Human Capital PT. Garuda Indo-nesia (Persero) Tbk. The data analyzed is data from Emplo-yee Satisfaction and EmploEmplo-yee Engagement survey results in September 2017.
B. Research Variable
The variables used in this study is a questionnaire given to employees. The questionnaire was answered using the likert scale, one for the choice of answer strongly disagree, two for the choice of answer disagree, three for the choice of answer agreed, and four for the choice of answer strongly agree.
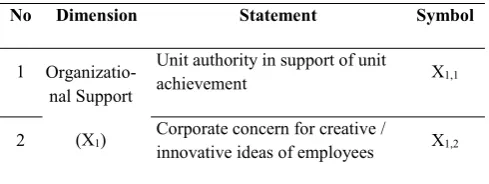
Table 1. Research Variable
EMPLOYEE SATISFACTION (ξ / X)
No Dimension Statement Symbol
1 Organizatio-nal Support
(X1)
Unit authority in support of unit
achievement X1,1
Table 1. Research Variable (Continous)
C. Step Analysis
Step analysis in this study as follows: 1. Describe the respondent's data
2. Testing the assumption of normal multivariate distribu-tion
3. Develop a theory-based model 4. Develop a path diagram
5. Convert the path diagram (a series of structural equa-tions and model specificaequa-tions) ie the conversion of the path diagram, the structural model into the mathematical model
6. Selecting input matrix and estimation technique on built model that is input data in SEM can be correlation matrix or covariance matrix
7. Evaluate the model of testing the result parameters, si-multaneous model test, structural model test, measure-ment model test, and model goodness test
8. Interpret and modify the model, if either model is in-terpreted and if not re-examination of the identification problem.
IV. RESULTS A. Data Characteristics
This research identifies the response of 122 employees who follow the Employee Satisfaction and Engagement Sur-vey.
Figure 3. Characteristic of Employee Satisfaction Response
The indicator that produces the most satisfied number of employees is found in indicator X5.2(satisfaction of the trust
given by the company in carrying out challenging new tasks). While the indicator that produces the lowest satisfied employee number is found in indicator X3.2 (satisfaction
toward career development system applied by the company).
Figure 4. Characteristic of Employee Engagement Response
Indicators that produce the highest number of emplo-yees agree on the Y6.2indicator (giving incentives that match
the performance achievement). While the indicators that produce the lowest number of employees agree on Y4.1
indicator (the use of resources, time, budget effectively and efficiently).
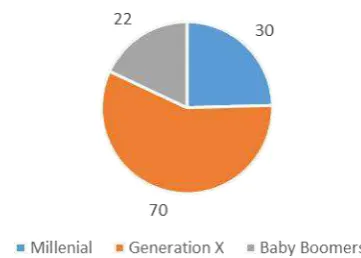
Figure 5. Characteristics of Respondents by Generation
Figure 5 above is characteristic of respondents based on Generation / Year of birth. Most of the respondents were 12 Working
Condition (X5)
Work diversity X5,3
13 Information received that cansupport the work X5,4
EMPLOYEE ENGAGEMENT (η / Y)
No Dimension Statement Symbol
1
Basic(Y1)
Use of the facilities provided
effectively Y1,1
2 Balance between work and lifethat can enhance morale Y1,2
15
Recognition
(Y7)
Engagement in decision making Y7,1
16 Appreciation of ideas andsuggestions for company
employees of Generation X, followed by Generation Y / Millenial and Baby Boomers. While there are no respondents who are members of Generation Z and Alpha.
B. Normal Multivariate Assumption Test
Normal multivariate testing was performed using statistical correlation coefficient test Q-Q Plot.
H0 : The data has a normal multivariate distribution
H1 : The data does not have a normal multivariate
distribu-tion
Table 2.Result of Normal Multivariate Assumption Test
Amount of Data
122 0,992 0,989
Reject H0if rQ< rtableorp-value> 0.05. Table 2 shows
the results of a normal multivariate test which results in a rQ
(0,992) greater than rtable(0,989). So it can be concluded that
the data have met the normal multivariate assumptions. C. Confirmatory Factor Analysis(CFA)
In this research will be conducted two types of CFA, the First Order CFA to test the validity and reliability of variables and Second Order CFA to confirm the factor forming variable Employee Satisfaction and Employee Engagement.
1. First Order CFA
An indicator is said to be valid if it yields a value of p-value< α (0,05). While a variable is said to be reliable if it yields value of Composite ReliabilityComposite Reliability (CR) ≥ 0,60.
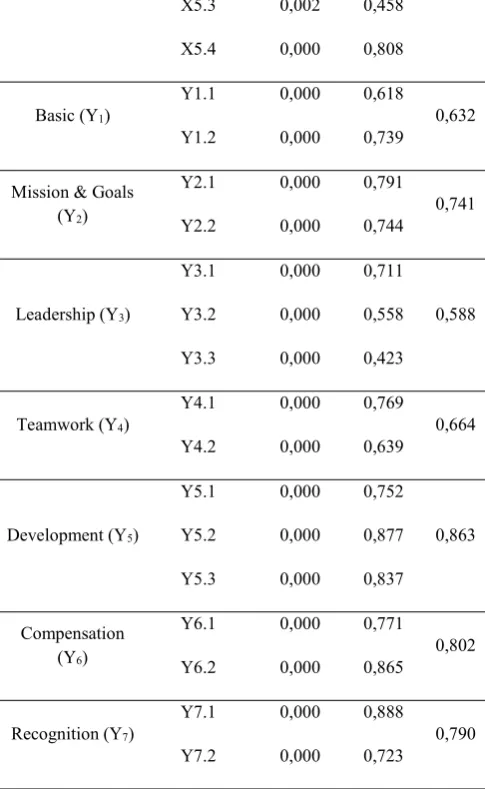
Table 3.Validity and Reliability
Variable
Leadership (Y3)
Y3.1 0,000 0,711
Development (Y5)
Y5.1 0,000 0,752
Recognition (Y7)
Y7.1 0,000 0,888
0,790
Y7.2 0,000 0,723
From Table 3 it can be seen that all indicator variables have been valid because it yields p-value <α (0,05). However reliability test results indicate that there is one latent variable that is not reliable, ie Leadership variable because it produces Composite Reliability value less than 0.60. So, Leadership variable can not be used in modeling.
2. Second Order CFA
CFA Second Order Modeling is done into two types of relationship patterns, namely Employee Satisfaction and En-gagement.
Table 4.Feasibility Test of Structural Model of Employee Satisfaction
No of Fit IndexGoodness Cut OffValue Result Info
1 Chi-Square ExpectedSmall 138,274 Not Fit
2 SignificanceProbability ≥ 0,05 0,000 Not Fit
3 GFI ≥ 0,90 0,844 Marginal Fit
4 RMSEA ≤ 0,08 0,104 Not Fit
6 CFI ≥ 0,90 0,913 Good Fit
7 TLI ≥ 0,90 0,887 Marginal Fit
From Table 4 it can be seen that the resulting model has been feasible. This is because there is one criterion of Ab-solute Fit Measure which shows the model has fit that is GFI of 0.844 (marginal fit). In addition, there are two criteria of Increment Fit Measure showing the model has fit, ie CFI of 0.913 (good fit) and TLI of 0.844 (marginal fit). So the Employee Satisfaction model does not require modification and can be used for further analysis.
Table 5.Path Model Coefficient Testing of Employee Satisfaction
Variable Coefficient p-value Conclusion
ξ → X1 0,892 0,000 Significant
ξ → X2 0,970 0,000 Significant
ξ → X3 0,982 0,000 Significant
ξ → X4 0,976 0,000 Significant
ξ → X5 0,860 0,000 Significant
*Significance Level (α) = 0,05
Based on the results of the path coefficient test in Table 5, with significance level (α) = 0.05, all the variables give a significant effect on Employee Satisfaction, because p-value is less than 0.05. Here is a measurement model that is formed. From the table above can also be seen that the largest con-tribution obtained by Career Management System (0.982), Performance Management System (0.976) and Reward Sys-tem (0.970).
In Second Order CFA Employee Engagement model occurs Heywood Case phenomenon. Heywood Case occurs because the number of latent variable formers is too small to cause the model can not be identified and results in a loading factor > 1 and a standard error of negative value. This phe-nomenon occurs in latent variables Basic and Mission & Goals. One way to overcome Heywood Case is to determine the value of the variance error term which is positive and very small value. So in this research, the determination of the value of variance error of 0.005 in order to overcome the pheno- nomenon of Heywood Case. The following is a feasibility test of the Employee Engagement model after overcoming Hey- wood Case.
Table 6.Feasibility Test of Structural Model of Employee
Engagement
No of Fit IndexGoodness Cut OffValue Result Info
1 Chi-Square ExpectedSmall 174,722 Not Fit
2 SignificanceProbability ≥ 0,05 0,000 Not Fit
3 GFI ≥ 0,90 0,818 Marginal Fit
4 RMSEA ≤ 0,08 0,123 Not Fit
5 AGFI ≥ 0,90 0,733 Not Fit
6 CFI ≥ 0,90 0,878 Marginal Fit
7 TLI ≥ 0,90 0,847 Marginal Fit
From Table 6 can be seen that the resulting model has been fit. This is because there is one criterion of Absolute Fit Measure that shows the model has fit that is GFI of 0.818 (marginal fit). In addition, there are two criteria of Increment Fit Measure showing the model has fit, ie CFI of 0.878 (marginal fit) and TLI of 0.847 (marginal fit). So the Engage-ment model does not require modification and can be used for further analysis.
Furthermore, the path coefficient is tested from the Em-ployee Engagement model to know which variables have significant effect on the model. Table 7 below is the result of the path coefficient test in the Employee Engagement model. Tabel 7.Path Model Coefficient Testing of Employee Engagement
Variable Coefficient p-value Conclusion
η → Y1 0,994 0,000 Significant
η → Y2 0,996 0,000 Significant
η → Y4 0,887 0,000 Significant
η → Y5 0,940 0,000 Significant
η → Y6 0,972 0,000 Significant
η → Y7 0,752 0,000 Significant
*Significance Level (α) = 0,05
Based on the results of the path coefficient test in Table 7, with the significance level (α) = 0.05, all the variables give significant influence to Employee Engagement. This is be-cause p-value is less than 0.05. From the table above also can be seen that the largest contribution obtained by the variables Mission & Goals (0.996), Basic (0.994), and Compensation (0.972).
D.Structural Equation Modelling
Figure 6. Model of Influence Employee Satisfaction on Employee Engagement
The following table is a feasibility test for the model of influence of Employee Satisfaction on Employee Engage-ment.
Tablel 8.Feasibility Test of Structural Model Influence Employee Satisfaction on Employee Engagement
No of Fit IndexGoodness Cut OffValue Result Info
1 Chi-Square ExpectedSmall 667,223 Not Fit
2 SignificanceProbability ≥ 0,05 0,000 Not Fit
3 GFI ≥ 0,90 0,710 Not Fit
4 RMSEA ≤ 0,08 0,104 Not Fit
5 AGFI ≥ 0,90 0,648 Not Fit
6 CFI ≥ 0,90 0,818 MarginalFit
7 TLI ≥ 0,90 0,795 Not Fit
From Table 8 can be seen that the resulting model is not feasible. This is because there is no Absolute Fit Measure cri-terion that shows the model has fit. While from Increment Fit Measure there is only one criterion indicating that model has fit that is CFI equal to 0,819 (marginal fit). So it is necessary to modify the model on the Employee Engagement Path dia-gram.
Figure 7. Model of Influence Employee Satisfaction on Employee Engagement (Modify)
The following table is a feasibility test of the model of influence of Employee Satisfaction with the Employee Enga-gement.
Table 9.Feasibility Test of Structural Model Influence Employee Satisfaction on Employee Engagement (Modify)
No of Fit IndexGoodness Cut OffValue Result Info
1 Chi-Square ExpectedSmall 647,518 Not Fit
2 SignificanceProbability ≥ 0,05 0,000 Not Fit
3 GFI ≥ 0,90 0,723 Not Fit
4 RMSEA ≤ 0,08 0,103 Not Fit
5 AGFI ≥ 0,90 0,659 Not Fit
6 CFI ≥ 0,90 0,826 Marginal Fit
7 TLI ≥ 0,90 0,801 Marginal Fit
From Table 9 can be seen the feasibility test results of modified model results. It appears that there is no Absolute Fit Measure criterion that shows the model has been fit. Ho-wever, there are two criteria of Increment Fit Measure that show that the model has fit ie CFI of 0.826 (marginal fit) and TLI of 0.801 (marginal fit). So it can be concluded that the modified model is better than the initial model.
Furthermore, the path coefficient is tested from the in-fluence model of Employee Satisfaction to Employee Enga-gement to know which variables have significant effect on the model.
Table 10.Structural Structure Path Coefficient Testing
ξ → η 0,474 0,000 Significance
*Significance Level (α) = 0,05
Based on the result of path coefficient test in Table 10, with significance level (α) = 0,05, Satisfaction variable give significant influence to Employee Engagement. This is be-cause p-value is less than 0.05. So get a model that can ex-plain the influence of Employee Satisfaction with Employee Engagement, ie:
Employee Engagement (η)= 0,474 Employee Satisfaction (ξ) In other words, every increase of one unit of Employee Satisfaction will raise the value of Employee Engagement by 0.474.
V. CONCLUSION A. Conclusion
Based on the results of the analysis and discussion, the following conclusions can be drawn.
1. First Order CFA indicates that all indicator variables are valid, but there is one latent variable that is not re-liable, that is Leadership. In processing using Second Order CFA for model of Employee Satisfaction and Em- ployee Engagement got fit model without modification. In addition, on processing using the CFA Second Order for the Employee Satisfaction and Engagement model shows that the Satisfaction and Conformity variable gives a significant influence. The latent variables that have the highest influence on Employee Satisfaction are Career Management System (0.982), Performance Ma- nagement System (0.976), and Reward System (0.970). While latent variables that provide the highest influence on Employee Engagement are Mission & Goals (0.996), Basic (0.994), and Compensation (0.972).
2. Modeling influence of Employee Satisfaction to Emplo-yee Engagement using Structural Equation Modeling require modification to meet model feasibility measure. Models are formed namely:
Engagement (η) = 0,474 Satisfaction (ξ) It means that, every increase of one unit of Employee Satisfaction will raise the value of Employee Engagement 0,477. The results of the processing also shows that the variable of Employee Satisfaction gives significant influence to Employee Engagement. B. Suggestion
Further research needs to be done by adding the new indicators to be expected be able to interpret the latent varia-bles better and able to produce a reliable latent variable. It is intended that all the variables considered to affect the Em-ployee Satisfaction and Engagement can be included into the modeling. In addition, the new indicators can minimize the possibility of the phenomenon of Heywood Case.
REFERENCES
[1] Mercer. 2007. Engaging Employees to Drive Global Bussines Success. London: MMC.
[2] Garuda Indonesia. 2014. "Garuda Indonesia Employee Engagement Version 2014," Garuda Indonesia, Jakarta. [3] K. Bollen. 1989. Structural Equation with Latent Variables, A Wiley Interscience Publication, New York: John Wiley & Sons.
[4] R. A. &. W. D. Johnson. 2007. Applied Multivariate Statistical Analysis, United States of America: Pearson Prentice Hall.
[5] Hair, JF., Black, W. C., Babin, W. J. & Anderson, R.E. 2010. Multivariate Data Analysis. Upper saddle River, New Jersey: Pearson Education International
[6] C.S. A. R. G. Dole. 2001. “The Impact of Varios Factors on the Personality, Job Satisfaction dan Turn Over Intentions of Profesional Accountants”. Managerial Auditing Journal, vol. 16, no.4, pp.234-245.
[7] Seber, G.A.F. 1984. Multivariate Observations. New York: Wiley
[8] Rusdi, Hidayat N, Edy, Poernomo, Minto, Waluyo, Bambang, Widjanarko Otok. 2018. The Model of risk of Travel Ticket Purchasing Decisions on Marketing Communication Mix in Online Site Using Structural Modeling. International Journal of Civil Engineering and Technology (IJCIET), Vol. 9, No. 5 pp. 847-856 [9] Rusdi , Hidayat N, Suhadak , Darminto and Siti Ragil ,