ISSN Online: 2327-5960 ISSN Print: 2327-5952
Where Is the Second Generation Nowadays?
Evidence from Former Transmigration Villages
in Jambi Province, Indonesia
Yulmardi Yulmardi, Amri Amir, Erfit Erfit, Junaidi Junaidi
Doctoral Program in Economics, The Graduate School, Jambi University, Jambi, Indonesia
Abstract
This study aimed to analyze the distribution of second generation settlements of transmigrants as well as the socio-economic factors that affect them. The results of the study found that the distribution of second generation settle-ments of transmigrants in Jambi Province were still large within the village. Only about one-fifth has left the village. The main reason of the second gen-eration still living in the village is the availability of relatively large land. On the contrary, the main reason the second generation came out of the village was to earn a better income. Furthermore, socio-economic factors which are signed by the decision of the second generation of transmigrants to choose between living in the village and outside the village are the factors of educa-tion, employment status, business field, parental-origin province, parental education and the main commodity of transmigration sites.
Keywords
Transmigration, Transmigrant, Second Generation, Settlement, Welfare
1. Introduction
Transmigration is one form of migration that takes place in Indonesia. Imple-mentation of the transmigration program has been going on for quite some time, beginning in the days of the Dutch colonial government, under the name of colonization until the time of reform at the moment [1][2].
The development of transmigration has succeeded in creating employment opportunities, equitable distribution of development in the regions, and has es-tablished new growth centers [3][4]. Based on the data from Pusdatin Ketrans-migrasian, since Pre-Pelita period until 2011, it has opened 4,537,034 hectares of How to cite this paper: Yulmardi, Y.,
Amir, A., Erfit, E. and Junaidi, J. (2018) Where Is the Second Generation Nowa-days? Evidence from Former Transmigra-tion Villages in Jambi Province, Indonesia. Open Journal of Social Sciences, 6, 282-293.
https://doi.org/10.4236/jss.2018.64024 This work is licensed under the Creative Commons Attribution International License (CC BY 4.0).
http://creativecommons.org/licenses/by/4.0/
new agricultural land as a field of business for 2.3 million families resettled or about 8.8 million people [5]. The types of businesses created such as trade, ser-vices, and home industries also grow in line with the growth of agricultural production in transmigration settlements. So far, transmigration has created 3325 definitive villages, some of which have grown rapidly and become centers of growth, such as the capital of the sub-district, the Integrated Independent City (KTM), the agropolitant area and the crop or plantation production center [6]. Especially in plantation commodity, transmigration program has been successful in establishing plantation-based growth poles in transmigration settlements (Na-jiyati, et al., 2006) [7].
At the beginning of the placement, transmigrants are provided by the gov-ernment with the average land allotment of 2 Ha each head of the family. There are 2 types of land that they receive. The first land is located around the house provided (known as yard land). This land is planted with short-lived crops such as corn, yams, peanuts, and soybeans. The second land is known as a land busi-ness planted with perennials and long-lived crops such as rubber and palm oil.
The transmigration program is only preparing land for a generation. Howev-er, as time gone by transmigrant children at this time, many of them enter the world of work and even suspected the second generation has formed a new household. If the transmigrant children are still in transmigration sites with de-pendence on first generation land (parents who become transmigrants), it will certainly have an impact on the distribution of land within the family. In the lat-er stages, if this continues it will have an impact on the emlat-ergence of povlat-erty in transmigration settlement areas. As Junaidi, Amir, Hardiani (2017) [8] point out that fragmentation of land or shrinkage of agricultural land ownership causes a decline in farmer’s business scale. The small land will be difficult to the use of technology. Some technologies are not efficient to use when it was applied to small land and business management becomes less economical.
Jambi Province is one of the transmigration placement areas in Indonesia. The placement of transmigration in the province had begun before indepen-dence in 1940, and continues to this day. The number of transmigrants placed in Jambi Province reached 83,641 families or 355,221 people [9], with the number positioning Jambi Province as one of the main areas of transmigrant placement in Indonesia. The transmigration program has also been well received by local residents in Jambi Province. It is also supported by Barter and Cote (2015) [10] who argued that the vast majority of Indonesian transmigrants were resettled in parts of Sumatra which have remained peaceful.
2. Methods
2.1. Location of the Study
The study was carried out in Jambi Province, Indonesia involved three sub-district locations within three selected districts (Tebo, Muaro Jambi, and Tanjung Jabung Barat).
2.2. Data Types and Sources
The survey has been employed in this research. There are two types of primary data. Those are primary data from first generation transmigrants (parents) and from second generation transmigrants (descendants/children of the first genera-tion of transmigrants).
The primary data were obtained directly by using questionnaire instruments. Furthermore, secondary data are also used other than primary data.
2.3. Population and Samples
The target of populations in this study was the first generation of transmigrant households derived (second generation) families in six selected villages. The second generation of transmigrants is defined as the second generation (trans-migrant children) both born in the origin and in transmigration settlements that have been above 20 years old and/or have married status.
From the target population, the number of samples of each sub-district was determined as 28 households of the first generation of transmigrants. In other words, the total number of samples was 168 households. We used the simple random sampling method based on the target population.
2.4. Analysis Methods
To analyze the distribution of the second generation settlements of transmi-grants is carried descriptively by using single tables and cross-frequency. Fur-ther, to analyze the factors affecting second generation transmigrant settlements, a binary logit regression model was used. The use of the binary regression model due to the dependent variables used is the categorization of second generation transmigrant settlements categorized into locations within the village and out-side the village. Binary logit regression model used is as follows:
( )
0 1 1 2 2 1 3 2 2 4 3 5 4 1 6 4 2 7 5 1g (xki) = the second generation transmigration type of settlement, note to the following conditions:
β1∙∙∙β9 = coefficients of variables in the model e = error term
X1 = age (in years)
X2 = formal educational level of children (school year). X2D1 1 = junior high scholl; 0 = other
X2D2 1 = senior high school and above; 0 = other X3 = children’s working status
1 = formal; 0 = informal.
X4 = children’s working type (employment status). X4D1 1 = semi skilled; 0 = other
X4D2 1 = skilled; 0 = other X5 = Field of children labor. X5D1 1 = industry; 0 = other X5D2 1 = services; 0 = other X6 = Local origin of parent. X6D1 1 = East Java; 0 = other X6D2 1 = Yogjakarta; 0 = other X6D3 1 = Central Java; 0 = other X6D4 1 = Jambi; 0 = other X7 = Parental education.
X7D1 1 = Junior high school; 0 = other
X7D2 1 = Senior high school and above; 0 = other X8 = Number of parental household members. X9 = Main commodity of plantation.
X9D1 1 = palm oil; 0 = other X9D2 1 = crops; 0 = other.
3. Findings and Discussions
3.1. Distribution of the Second Generation Transmigrant
Settlements
Based on the distribution of settlements, it can be argued that most (82.14%) of the second generation of transmigrants still live in transmigration villages. Of this number recorded, the proportion lives in the transmigration village while not at home with the parents of 55.95%. Meanwhile, those who still live in transmigration and home villages with their parents is about 26.19%.
Furthermore, the proportion of the second generation left the transmigration village, while still within the district is as 11.90%. Whereas, the second genera-tion come out of the district where his parents were first placed only 5.95%.
In detail, distribution of the second generation transmigrant settlement can be
seen at Table 1.
Table 1. Distribution of the Second Generation Transmigrant Settlements, Jambi Prov-ince, 2017.
Second Generation Transmigrant Settlements %
Living in transmigration villages, living in their parents’ homes 26.19
Living in transmigration villages, not living in their parents’ homes 55.95
Living outside the transmigration village, but still within the same district 11.90
Living outside the transmigration villages, in different districts 5.95
Total 100.00
Source: Field research, 2017.
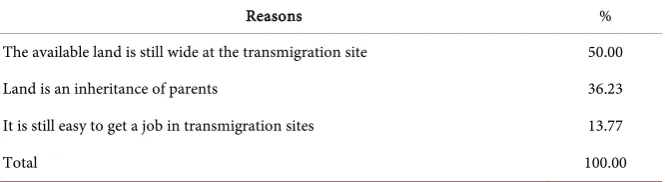
Table 2. The reasons for the second generation of transmigrants still living in the
trans-migration village, Jambi Province, 2017.
Reasons %
The available land is still wide at the transmigration site 50.00
Land is an inheritance of parents 36.23
It is still easy to get a job in transmigration sites 13.77
Total 100.00
Source: Field research, 2017.
transmigration site”. This is in line with the findings of research VanWey (2005) [11] that the size of landholdings has a negative effect on out-migration. Fur-thermore, the second generation gave the reason “land is an inheritance of par-ents” as 36.23% and as 13.77% stated the reason “it is still easy to get a job in transmigration sites”.
Various reasons also were put forward by the second generation of transmi-grants who chose to settle outside the transmigration village (Table 3). Most (70.00%) stated the reason for earning better. There are as 2000% of the second generation left transmigration village by reason of joining family. Only about 6.67% do not live in transmigration villages on the grounds of limited land in the villages of transmigration.
3.2. Second Generation Transmigrant Settlements and
Socioeco-nomic Characteristics
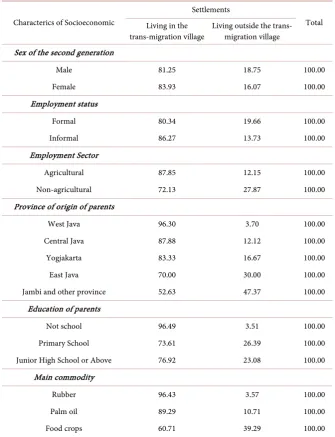
Based on sex of the second generation, it can be concluded that the proportion of female residing in the village was higher than male, where female were as 83.93%, while the second generation of male was 81.25%.
Table 3. The reasons for the second generation of transmigrants living outside the trans-migration village, Jambi Province, 2017.
Reasons Total
Limited land in transmigration village 6.67
To earn a better income 70.00
Limited availability of education and health facilities 3.33
Joining family 20.00
Total 100.00
Source: Field research, 2017.
There is a tendency for the second generation of transmigrants working in the agricultural sector to settle in the village. Only 12.15 percent of the second gen-eration with agricultural sector residing outside the village. In contrast, the pro-portion of the second generation with non-agricultural sector living outside the village reached 27.87%.
The second generation of parents originated from the provinces of Java (West Java, Central Java, Yogjakarta and East Java), Jambi, and other provinces. Based on the region of origin of parents, the second generation with parents from West Java Province occupied the largest proportion (96.30%) was in the village and followed by Central Java and Yogyakarta provinces respectively as 87.88% and 83.33%.
There is the second generation trend with poorly educated parents living in the village. Only 3.51% of the second generation with educated parents did not complete primary school living outside the village. In contrast, there were 23.08% of the second generation with parents with junior high education living outside the village.
The second generation in transmigration sites with the main commodity of plantations (rubber and palm oil) tends to settle within the village. Only 3.57% of the second generation was in the transmigration sites of rubber estates resid-ing outside the village and only 10.71 % of the second generation at the transmi-gration sites of palm oil plantations living outside the village. In contrast, more than one third (39.29 percent) of the second generation in transmigration sites of food crops lived outside the village.
The second generation tendency to settle in rubber and oil palm commodity villages is because these two commodities are relatively more prospective as a source of income compared to rice crops. This is in line with the findings of re-search Tachibana (2016) [12] at transmigration sites in Central Kalimantan.
In detail, settlements and characterics of socioeconomic second generation of transmigrants can be seen at Table 4.
3.3. Factors Affecting Distribution of the Second Generation
Settlements of Trasmigrants
Table 4. Settlements and characteristics of socioeconomic second generation of transmi-grants.
Characterics of Socioeconomic
Settlements
Total Living in the
trans-migration village
Living outside the trans-migration village
Sex of the second generation
Male 81.25 18.75 100.00
Female 83.93 16.07 100.00
Employment status
Formal 80.34 19.66 100.00
Informal 86.27 13.73 100.00
Employment Sector
Agricultural 87.85 12.15 100.00
Non-agricultural 72.13 27.87 100.00
Province of origin of parents
West Java 96.30 3.70 100.00
Central Java 87.88 12.12 100.00
Yogjakarta 83.33 16.67 100.00
East Java 70.00 30.00 100.00
Jambi and other province 52.63 47.37 100.00
Education of parents
Not school 96.49 3.51 100.00
Primary School 73.61 26.39 100.00
Junior High School or Above 76.92 23.08 100.00
Main commodity
Rubber 96.43 3.57 100.00
Palm oil 89.29 10.71 100.00
Food crops 60.71 39.29 100.00
Source: Field research, 2017.
Table 5. Overall fit model test for spreading of the second generation settlement.
Omnibus Test of Model Coefficients Chi-square df Sig.
Step 54,202 14 0.000
Block 54,202 14 0.000
Model 54,202 14 0.000
Hosmer and Lemeshow Test 3,825 8 0.873
Source: Processed data result.
of transmigrants to remain within the village and outside the village.
Based on Hosmer and Lemeshow test, it was obtained Chi-Square value of 3.825 with p value of 0.873. Since the value of Chi-Square is not significant where (p > 0.05), the conclusion obtained was the predicted probability corres-ponding to the observed probability. This showed that there was no difference between the model and the data, so the model can be said fit.
The following from the 2 × 2 classification table (Table 6) showed how well the model grouped the cases into two groups both inside and outside the village. The overall prediction accuracy was 83.90 percent, while the second-generation accuracy lived in the village of 93.50 percent and the second generation outside the village was 40.00 percent. In other words, the accuracy of this model in pre-dicting second-generation probabilities living within the village and outside the village was different. Thus, it can be said that the second generation probability living in the village more than twice than the second generation living outside the village.
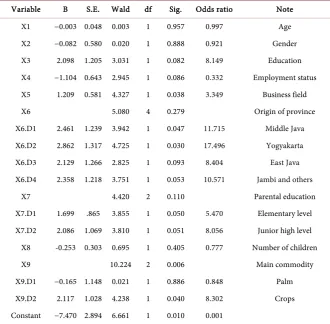
Parameter estimation and partial test in the binary logit model for the second generation settlement were presented at Table 7. Based on the estimation result, it showed that Age (X1) did not significantly affect the value (p > 0.05). There-fore, it can be concluded that there was no sifnificant effect of age from the second generation residing in the village and outside the village of migrants. Moreover, gender (X2) also showed an insignificant effect indicated by a value (p > 0.05). This meant that gender was also not significant, in other words there was no difference in the second generation preference between men and women to choose living within the village or outside the transmigration village.
Furthermore, education as a variable (X3) with the basic category of junior and under it can be argued that there was a difference in the probability of the second generation settlements between the second generation educated (X3D2) with the second generation educated (X3D1). This was indicated by the coeffi-cient in the model that was significant at α = 10% obtained the number Odds ra-tio of 8.20. This meant that the second generara-tion having senior educara-tional lev-el and above had a chance of 8.20 times to live outside the village compared with the second generation having junior educational level.
Employment Status (X4), where the value 0 = informal, and value 1 = formal.
At α = 10%, significant at the number 0.086 or 8 percent obtained negative
Table 6. Classification 2 × 2 for the second generation transmigrants settlement model.
Observation
Prediction
Categoty
Percentage Whithin village Outside village
Category Whithin village 129 9 93.5
Outside village 18 12 40.0
Total 83.9
Table 7. Estimation of parameters of the second generation settlement model.
Variable B S.E. Wald df Sig. Odds ratio Note
X1 −0.003 0.048 0.003 1 0.957 0.997 Age
X2 −0.082 0.580 0.020 1 0.888 0.921 Gender
X3 2.098 1.205 3.031 1 0.082 8.149 Education
X4 −1.104 0.643 2.945 1 0.086 0.332 Employment status
X5 1.209 0.581 4.327 1 0.038 3.349 Business field
X6 5.080 4 0.279 Origin of province
X6.D1 2.461 1.239 3.942 1 0.047 11.715 Middle Java
X6.D2 2.862 1.317 4.725 1 0.030 17.496 Yogyakarta
X6.D3 2.129 1.266 2.825 1 0.093 8.404 East Java
X6.D4 2.358 1.218 3.751 1 0.053 10.571 Jambi and others
X7 4.420 2 0.110 Parental education
X7.D1 1.699 .865 3.855 1 0.050 5.470 Elementary level
X7.D2 2.086 1.069 3.810 1 0.051 8.056 Junior high level
X8 -0.253 0.303 0.695 1 0.405 0.777 Number of children
X9 10.224 2 0.006 Main commodity
X9.D1 −0.165 1.148 0.021 1 0.886 0.848 Palm
X9.D2 2.117 1.028 4.238 1 0.040 8.302 Crops
Constant −7.470 2.894 6.661 1 0.010 0.001
Source: Processed data result.
coefficient. Odds ratio of = 0.332 meant that the second generation working in the informal sector, the chances for them to stay outside the village 0.332 times compared with those working in the formal sector.
For origin of parents (X6), where as the basic category is West Java Province. It can be argued that there was a difference in the probability of the second gen-eration settlements living within the village or outside the village. It can be ar-gued that there was a probability difference between the second generation living in the village and those outside the village based on the parents’ origin (X6D1). Further, Central Java obtained Odds ratio of 11,715. This showed that the second generation parents from Central Java had the opportunity to live outside the village 11,715 times compared to the second generation living in the village.
These conditions are possible due to the limited number of job opportunities in open informal sector at transmigration sites within Jambi Province. Business field variable (X5) was differentiated from category 0 = agriculture, and category 1 = non agriculture. Odds ratio was obtained by the number of 3.349. From that figure, it can be concluded that the second generation working in non-agricultural sector had opportunity as 3349 times from those working in agriculture to live outside transmigration village.
Odds ratio of 17,496 indicated that they had the opportunity to live outside the village as 17,496 times compared to living in the village. Then, for the second generation where the origin of parents of East Java (X6D3), the Odds ration val-ue was 8.044. The interpretation is the possibility of the second generation whose parents are from East Java having the opportunity to live outside the vil-lage was 8.044 times compared to the second generation living in the vilvil-lage. Then, the area of origin of parents of Jambi Province and surrounding areas (X6D4) obtained the number Odds ratio of 10,571. With the same conclusion, the second generation opportunity to spread outside the village was 10,571 times compared with the second generation to live in the village. In other words, the second generation mobility levels coming from Jambi Province and surrounding areas to leave their villages had a bigger chance.
Associated with parent education (X7), where by basic category = elementary level and not finished; 1 = Junior High level and above. Observing the Odds Ra-tio was seen that the second generaRa-tion with parental educaRa-tion (X7D1) with elementary and not finished had a probability of 5470 times to live in the village rather than outside the village. While for the second generation with parental education of junior high level and above (X7D2) with Odds ratio equal to 8056 can be concluded that the second generation had probability 8056 times higher to live outside village compared with the second generation living in village. This situation reinforces the descriptive analysis which shows that the greatest share of the second generation with low levels of parental education resides in the vil-lage. Higher parental education of the second generation means more chance for the second generation living outside the village.
Furthermore, the number of children in family (X8) did not significantly af-fect where the value (p > 0.05) was shown. Therefore, it can be concluded that there was no effect of the number of children in family on the second generation settlements. That is, large number of household members of parents unrelated to the second generation living in the village or outside the village. The Odds ratio of 0.777 meant that the second generation had a probability of 0.777 times to living outside the village compared to living in the village. The negative coeffi-cient indicated that greater the number of family members, the less possibility of the second generation living in the village.
4. Conclusions
The distribution of the second generation of transmigrant settlements was still largely within the village. Only about one-fifth has left the village. The main reason of the second generation still living in the village was the availability of relatively wide land. On the contrary, the main reason the second generation come out of the village was to earn a better income.
Furthermore, socio-economic factors significantly affected the decision of the second generation of transmigrants to choose between living in the village and outside the village were the education, employment status, business field, paren-tal-origin province, parental education, and the main commodities of transmi-gration sites.
Notice that majority of the second generation transmigrations was still within the village on the grounds that the available land was still wide, so it is necessary to embark on skills in order to further improve the use of more productive land. In addition, it is also necessary to increase the knowledge and skills of non-agricultural employment in the second generation of transmigrants, thus no longer relying on the source of income from the land of their parents (the first generation of transmigrants).
References
[1] Oostindie, G. (2008) Dutch Colonialism, Migration and Cultural Heritage. KITLV Press, Leiden.https://doi.org/10.1163/9789004253889
[2] Junaidi, J., Rustiadi, E., Sutomo, S. and Juanda, B. (2012) Pengembangan penye-lenggaraan transmigrasi di era otonomi daerah. Jurnal Visi Publik, 9.
[3] Fujikura, R. and Nakayama, M., Eds. (2015) Resettlement Policy in Large Develop-ment Projects. Routledge, New York.
[4] Van Lottum, J. and Marks, D. (2012) The Determinants of Internal Migration in a Developing Country: Quantitative Evidence for Indonesia, 1930-2000. Applied Economics, 44, 4485-4494.https://doi.org/10.1080/00036846.2011.591735
[5] Ketransmigrasian, P. (2012) Pengkajian informasi dan analisis tingkat perkemban-gan UPT dan tingkat kesejahteraan transmigrasi. Pusdatin Transmigrasi, Jakarta. [6] Widaryanto (2012) Analisis keragaan jenis usaha dan kelembagaan ekonomi di
Pu-sat Kota Terpadu (KTM). PuPu-sat Penelitian dan Pengembangan Ketransmigrasian, Jakarta.
[7] Najiyati, S., et al. (2006) Studi Kontribusi Transmigrasi Terhadap Ketahanan Pan-gan. Puslitbangtrans Depnakertrans, Jakarta.
[8] Junaidi, J., Amir, A. and Hardiani, H. (2017) Model for the Development of Planta-tion-Based Growth Poles Village. Paper. Presented at the Malaysia Indonesia Inter-national Conference on Economics, Management and Accounting (MIICEMA); Jambi-Indonesia, 24-25 October 2016
[9] BPS (2017) Jambi dalam Angka 2017. Jambi. BPS.
[10] Barter, S.J. and Cote, I. (2015) Strife of the Soil? Unsettling Transmigrant Conflicts in Indonesia. Journal of Southeast Asian Studies, 46, 60-85.
https://doi.org/10.1017/S0022463414000617
In-ternal Migration in Mexico and InIn-ternal Migration in Thailand. International Mi-gration Review, 39, 141-172.https://doi.org/10.1111/j.1747-7379.2005.tb00258.x