TESIS (RC-142501)
PENILAIAN APLIKASI PEMBEBANAN TERHADAP
PARAMETER MATERIAL SEDIMEN DI DAERAH HILIR
DAN MUARA SUNGAI BENGAWAN SOLO
FATIN ADRIATI 3114 201 001
PEMBIMBING
Ria Asih Aryani Soemitro Toshifumi Mukunoki
Dwa Desa Warnana
PROGRAM MAGISTER GEOTEKNIK
JURUSAN TEKNIK SIPIL
FAKULTAS TEKNIK SIPIL DAN PERENCANAAN INSTITUT TEKNOLOGI SEPULUH NOPEMBER SURABAYA
TESIS (RC-142501)
PENILAIAN APLIKASI PEMBEBANAN TERHADAP
PARAMETER MATERIAL SEDIMEN DI DAERAH HILIR
DAN MUARA SUNGAI BENGAWAN SOLO
FATIN ADRIATI
3114 201 001
PEMBIMBING
Ria Asih Aryani Soemitro Toshifumi Mukunoki
Dwa Desa Warnana
PROGRAM MAGISTER GEOTEKNIK
JURUSAN TEKNIK SIPIL
FAKULTAS TEKNIK SIPIL DAN PERENCANAAN INSTITUT TEKNOLOGI SEPULUH NOPEMBER SURABAYA
THESIS (RC-142501)
ASSESSMENT OF LOADING APPLICATION ON
SEDIMENT MATERIAL PROPERTIES OF BENGAWAN
SOLO RIVER IN DOWNSTREAM AND ESTUARY
FATIN ADRIATI 3114 201 001
SUPERVISORS
Ria Asih Aryani Soemitro Toshifumi Mukunoki
Dwa Desa Warnana
MASTER PROGRAM
GEOTECHNICAL ENGINEERING
DEPARTMENT OF CIVIL ENGINEERING
FACULTY OF CIVIL ENGINEERING AND PLANNING INSTITUT TEKNOLOGI SEPULUH NOPEMBER SURABAYA
THESIS (RC-142501)
ASSESSMENT OF LOADING APPLICATION ON
SEDIMENT MATERIAL PROPERTIES OF BENGAWAN
SOLO RIVER IN DOWNSTREAM AND ESTUARY
FATIN ADRIATI 3114 201 001
SUPERVISORS
Ria Asih Aryani Soemitro Toshifumi Mukunoki
Dwa Desa Warnana
MASTER PROGRAM
GEOTECHNICAL ENGINEERING CIVIL ENGINEERING DEPARTMENT
FACULTY OF CIVIL ENGINEERING AND PLANNING INSTITUT TEKNOLOGI SEPULUH NOPEMBER SURABAYA
i
PENILAIAN APLIKASI PEMBEBANAN TERHADAP
PARAMETER MATERIAL SEDIMEN DI DAERAH HILIR
DAN MUARA SUNGAI BENGAWAN SOLO
Nama Mahasiswa : Fatin Adriati
NRP : 3114 201 001
Pembimbing :
Institut Teknologi Sepuluh Nopember, Universitas Kumamoto,
Surabaya - Indonesia: Kumamoto - Jepang:
Dr. Ir. Ria Asih A. Soemitro, M.Eng. Dr. Toshifumi Mukunoki Dr. Dwa Desa Warnana, S.Si. M.Sc.
ABSTRAK
Sungai Bengawan Solo mengalami permasalahan yang diakibatkan oleh erosi dan deposisi sedimen. Ketidakseimbangan antara erosi dan deposisi menyebabkan sedimen berlebih di atas dasar sungai dan selanjutnya mengakibatkan banjir dan pembentukan sandbar. Satu solusi usulan untuk mengatasi permasalah sedimen berlebih di sungai Bengawan Solo adalah pengerukan yang mempunyai dampak negatif bagi lingkungan. Oleh karena itu diperlukan tindakan yang penuh perhatian serta memerlukan pengetahuan tentang parameter sedimen yang terdeposisi. Pengetahuan tentang parameter sedimen yang terdeposisi, seperti parameter fisik dan kuat geser, didapatkan melalui percobaan di laboratorium yang meliputi tes parameter fisik, tes konsolidasi dan test geser langsung. Dari hasil yang diperoleh, material sedimen dikelompokkan menjadi sedimen pasir yang ditemukan di daerah hilir dan sedimen lempung yang ditemukan di daerah muara. Distribusi parameter sedimen berdasarkan kedalaman adalah bervariasi yang disebabkan oleh erosi dan deposisi yang terjadi secara berulang. Sementara itu, distribusi parameter sedimen berdasarkan lokasi adalah sesuai dengan jenis tanah yang disebabkan oleh sifat dan perilaku jenis tanah dari material sedimen itu sendiri. Erosi lebih dominan terjadi di Lokasi 1, 2 dan 4, sementara deposisi lebih dominan di Lokasi 3 dan 5. Kuat geser sedimen mengalami perubahan yang disebabkan oleh perubahan aplikasi pembebanan yang berupa beban sendiri dari lapisan sedimen itu sendiri. Sebagian besar sedimen mempunyai kuat geser yang lebih besar dari batas penggunaan metode pengerukan dengan kapasitas kecil (>20 kPa), sehingga memerlukan metode pengerukan dengan kapasitas besar (grab dredger) untuk mengeruk sedimen berlebih. Di masa depan, jika diinginkan untuk menggunakan metode pengerukan dengan kapasitas kecil seperti ploughing atau plain suction dredger, sedimen harus mempunyai kuat geser kurang dari 20 kN/m2 dengan berat volume kering berkisar antara 10 kN/m3 hingga 13 kN/m3.
ii
ASSESSMENT OF LOADING APPLICATION
ON SEDIMENT MATERIAL PROPERTIES
OF BENGAWAN SOLO RIVER
IN DOWNSTREAM AND ESTUARY
Student Name : Fatin Adriati Student ID : 3114 201 001 Supervisors :
Institut Teknologi Sepuluh Nopember, Kumamoto University,
Surabaya - Indonesia: Kumamoto - Japan:
Dr. Ir. Ria Asih A. Soemitro, M.Eng. Dr. Toshifumi Mukunoki
Dr. Dwa Desa Warnana, S.Si. M.Sc.
ABSTRACT
Bengawan Solo River undergoes river stream problems which are inflicted by erosion and deposition of sediment. Unbalance between erosion and deposition leads to excessive sediment on top of river bed and further results in flooding and sandbar formation. One proposed solution to solve excessive sediment problem at Bengawan Solo River is dredging which has negative effect on the environment. Hence, considerate action is necessary which requires knowledge of deposited sediment properties. The knowledge of deposited sediment, such as physical properties and shear strength, was obtained by doing laboratory test including physical properties test, consolidation test and direct shear test. From the results, sediment material is broadly grouped into sand sediment which found at downstream areas and clay sediment which found at estuary area. The distribution of sediment properties based on the depth is varies due to subsequent erosion and deposition over times. Meanwhile, the distribution of sediment properties based on the location of sediment sampling is appropriate with the soil type which caused by the behavior of soil type of sediment material. Erosion is more dominant at Location 1, 2 and 4, while deposition is more dominant at Location 3 and 5. Shear strength of sediment experiences alteration which is caused by the alteration of loading application in the form of self-weight of sediment layer itself. Most of sediment has shear strength greater than the limitation of utilization of small capacity dredging method (> 20 kPa) and thus, requires dredging method with large capacity (grab dredger) to remove the excessive sediment. In the future, if preferable to use dredging method with small capacity such as ploughing or plain suction dredger, the sediment should has shear strength less than 20 kN/m2 with dry unit weight range from 10 kN/m3 to 13 kN/m3.
iii
PREFACE
All praises to The Almighty Allah SWT for giving His grace and blessings so that
I am able to accomplish the thesis entitled “Assessment of Loading Application
on Sediment Material Properties of Bengawan Solo River in Downstream and Estuary”, as one requirement to obtain Master’s degree.
I would like to express my sincere gratitude and appreciation to my Professors:
Dr. Ir. Ria Asih Aryani Soemitro, M.Eng., Dr. Toshifumi Mukunoki and Dr. Dwa
Desa Warnana, S.Si. M.Sc. for their endless guidance, support and
encouragement. I obtain precious knowledge, experience and advice thanks to
them.
I thank the laboratory members, both in ITS Surabaya and Kumamoto University,
for their help and time working on my research. And I also thank all my dearest
friends, whom I met in Indonesia and Japan, for their valuable time, love and
support. Lastly, my special thanks to my beloved family for their presence and
unconditional love in good times and bad times of my journey of life.
This thesis is still far from perfection. Nevertheless, I hope it may contribute in
science, especially Geotechnical Engineering, and provide benefits for the readers.
Surabaya, January 2017
Author,
iv
v
ACKNOWLEDGEMENT
The master degree program was taken within two years. The first year
started from September, 2014 to September, 2015 was taken at Institut Teknologi
Sepuluh Nopember (ITS), Surabaya – Indonesia and was financed by Beasiswa
Unggulan, Biro Perencanaan dan Kerjasama Luar Negeri (BU – BPKLN). The
second year started from October, 2015 to September, 2016 was taken at
Kumamoto University, Kumamoto – Japan, through JASSO Short-Term
Exchange Program provided by Japan Student Service Organization (JASSO).
The research work is fully supported by the following research funding:
- International Research Collaboration (managed by LPPM – ITS and
Directorate General of Higher Education Indonesia, DIKTI), in 2014 and
2015.
“Assessment to the River Embankment Stability with Respect to Rainfall and Seismic – Induced River Embankment Failures” - 2014
“Assessment to River Conditions Affected by River Profile, River Water Fluctuation and Sediment Rate” - 2015
- PEER (Partnerships for Engagement in Research) Science cycle 3 project by
USAID-NSF, in 2014.
“Sediment Transport Evaluation on Bengawan Solo River (downstream and estuary) to Minimize Sedimentation and Flood Combining Effect on Nearby
vi
vii
LIST OF CONTENTS
Cover Page
Legalization Page
Abstrak ... i
Abstract ... ii
Preface ... iii
Acknowledgement ... v
List of Contents ... vii
List of Tables ... ix
List of Figures ... x
Chapter 1 Introduction ... 1
1.1Research Background ... 1
1.2Research Objectives ... 5
1.3Research Limitation ... 6
Chapter 2 Literature Study ... 7
2.1Relation between Sampling Location and Properties of Sediment Material ... 7
2.2Erosion and Deposition Experienced by Sediment ... 9
2.3Shear Strength of Sediment as Indicator of Dredging Method in Bengawan Solo River ... 14
2.3.1 Excessive Sediment Suffered by Bengawan Solo River ... 14
2.3.2 Dredging as Proposed Solution for Bengawan Solo River ... 15
Chapter 3 Methodology ... 19
3.1Investigation of Sediment Properties ... 19
3.1.1 Sampling of Sediment Material ... 19
viii
3.2Analysis of Erosion and Deposition Experienced by Sediment Material
... 23
3.3 Analysis of Shear Strength and Critical Shear Stress of Sediment Material ... 24
Chapter 4 Results and Discussion ... 27
4.1 Physical Properties of Sediment Material at Five Different Locations ... 27
4.2 Relation between Properties of Sediment Material and Its Sampling Location ... 32
4.3 Erosion and Deposition Experienced by Sediment Material ... 40
4.4 Shear Strength of Sediment as Indicator of Dredging Method in Bengawan Solo River ... 46
a. Comparison of Shear Strength and Critical Shear Stress of Sediment Material ... 51
b. Dredging Method in Bengawan Solo River ... 52
Chapter 5 Conclusions and Recommendations ... 55
5.1 Conclusions ... 55
5.2 Recommendations for Future Research ... 56
References ... 57
Appendix A Locations of Sediment Material Sampling ... 61
Appendix B Properties of Sediment Material... 66
Appendix C Physical Properties Test Results ... 73
Appendix D Consolidation Test Results ... 76
Appendix E Direct Shear Tests Results ... 80
ix
LIST OF TABLES
Table 2.1 Coordinate of Study Location ... 7
Table 2.2 Excavation Guidance on Application of Shear Strength Classification
... 17
Table 3.1 Criteria of Sediment based on Shear Strength ... 25
x
LIST OF FIGURES
Figure 1.1 Illustration of excessive sediment on river bed ... 2
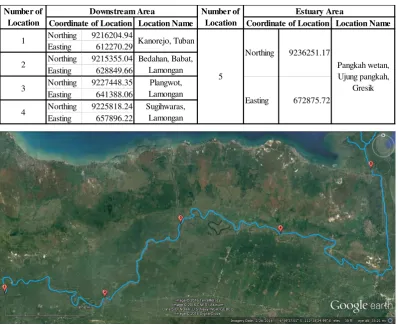
Figure 2.1 Locations of sediment material sampling at Bengawan Solo River ... 7
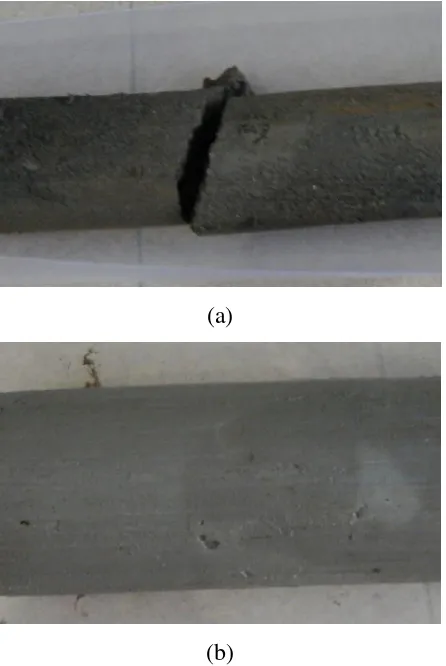
Figure 2.2 Sediment material (a) sandy sediment (b) clayey sediment ... 8
Figure 2.3 The illustration of erosion and deposition ... 14
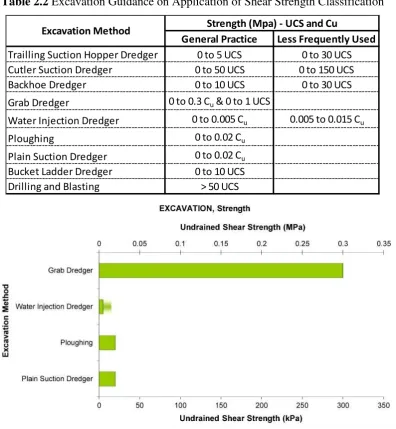
Figure 2.4 Strength versus excavation method graph... 17
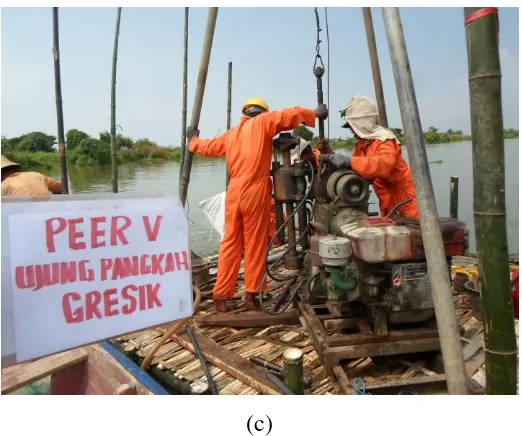
Figure 3.1 Process of sediment sampling (a) the barge (b) sediment sampling at Location 1 (c) sediment sampling at Location 5 ... 21
Figure 3.2 The device of water level sensor ... 21
Figure 3.3 The illustration of sampling condition ... 22
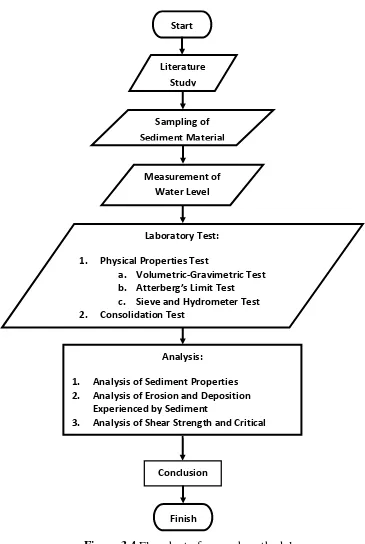
Figure 3.4 Flowchart of research methodology ... 26
Figure 4.1 Locations of sediment material sampling at Bengawan Solo River ... 28
Figure 4.2 Distribution of unit weight ... 28
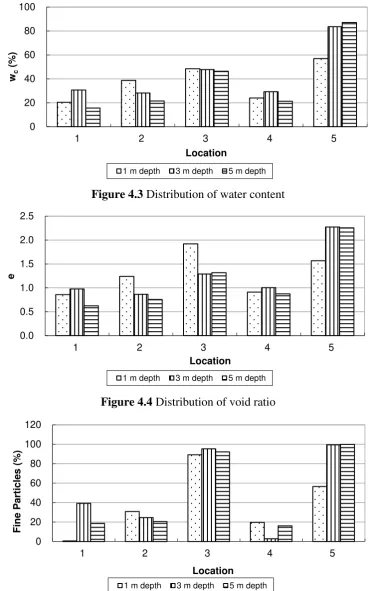
Figure 4.3 Distribution of water content ... 29
Figure 4.4 Distribution of void ratio ... 29
Figure 4.5 Distribution of fine particles ... 29
Figure 4.6 Distribution of D50... 31
Figure 4.7 The picture of Babat Barrage ... 31
Figure 4.8 Relation between unit weight versus water content ... 32
Figure 4.9 Relation between unit weight versus void ratio ... 33
Figure 4.10 Relation between unit weight versus fine particles ... 33
Figure 4.11 Relation between unit weight versus sectional area of river (a) 1 m depth (b) 3 m depth (c) 5 m depth ... 35
Figure 4.12 Relation between unit weight versus sampling depth (a) 1 m depth (b) 3 m depth (c) 5 m depth ... 36
xi
Figure 4.14 e versus log p curve at Location 1 ... 41
Figure 4.15 e versus log p curve at Location 2 ... 42
Figure 4.16 e versus log p curve at Location 3 ... 42
Figure 4.17 e versus log p curve at Location 4 ... 42
Figure 4.18 e versus log p curve at Location 5 ... 43
Figure 4.19 D50 graph for Location 1, Location 2 and Location 4 ... 43
Figure 4.20 D50 graph for Location 3 and Location 5 ... 44
Figure 4.21 Illustration of sediment layer in each location... 45
Figure 4.22 Distribution of shear strength ... 46
Figure 4.23 Relation between overburden pressure versus shear strength ... 47
Figure 4.24 Relation between dry unit weight versus shear strength ... 47
Figure 4.25 Relation between D50 versus shear strength ... 48
Figure 4.26 Relation between percentage of sand versus shear strength ... 48
Figure 4.27 Relation between coefficient of uniformity versus shear strength ... 49
Figure 4.28 Relation between shear strength versus hydraulic perimeter .... 50
Figure 4.29 Critical shear stress of sediment influenced by particle diameter ... 51
Figure 4.30 Comparison of lowest shear strength and critical shear stress .. 52
xii
1
CHAPTER 1
INTRODUCTION
1.1Research Background
Bengawan Solo River, as one of the most important river stream in Java
Island, Indonesia, undergoes river stream problems due to the complication of its
river networks. Generally, river stream problems are inflicted by flow discharge,
erosion and deposition of sediment. In fact, it is normal for river to experience
erosion and deposition of sediment over times. It becomes not normal which
indicating the occurrence of river stream problems when there is unbalance
between erosion and deposition. Merely river with dynamic equilibrium, which is
the general balance between erosion and deposition, could minimize the
occurrence of river stream problems (Dolores River Dialogue, 2013).
Deforestation in upstream area is one situation that triggers unbalance
between erosion and deposition of sediment. Deforestation causes erosion in the
river basin and hence the eroded material is brought by river stream. Restrepo et
al (2015) confirmed it and was able to estimate the amount of sediment produced
by deforestation in tropical drainage basins. Higher amount of eroded material on
river stream and in conjunction with low river stream, which is below critical
shear stress, increase the deposition rates especially at downstream and estuary
area. Continuous and adequately high deposition rate leads to excessive
deposition of sediment material. Further, the filing in of the river bed with
sediment material due to excessive deposition leads to excessive sediment. The
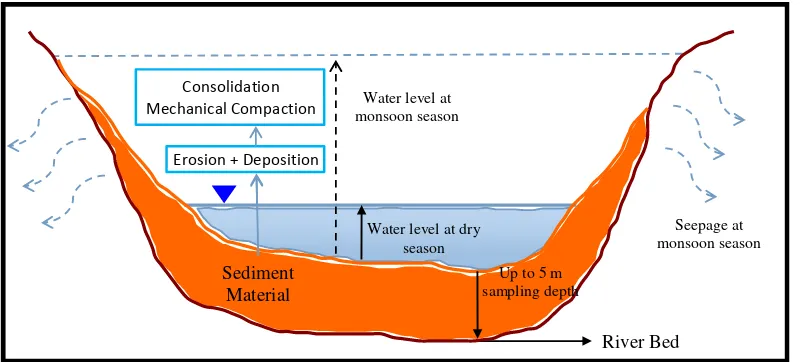
illustration of excessive sediment on river bed is presented in Figure 1.1.
The outcome of excessive sediment material on river bed in downstream
area is different with estuary area. Nevertheless, both bring problems not only for
natural environment but also human built environment. The immediate
consequence of excessive sediment in downstream area is a decline in river
channel capacity. When the river effectively having lost its capacity to evacuate
flood water, significant risk of flooding is increase (Zahar, 2008). Meanwhile,
2
leads to the displacement of river mouth and river mouth branching (distributary).
It results in the forming of delta or sandbar at the river mouth (Sukardi et al,
Figure 1.1 Illustration of excessive sediment on river bed
Research on sediment material has been done by some researchers. Harsini
et al (2007) described the geotechnical properties of clay sediment. It is said that
the geotechnical properties are affected by tidal, river flow current and the
condition of sedimentary environment such as the geological features. This study
supported the assumption of current research where different area has different
geotechnical properties of sediment. However, this study only focused on clay
sediment while in reality sediment material can be composed not only from clay
but also sand and even composition of clay and sand. Ahiarakwem et al (2014)
also described the geotechnical properties of sediment and concluded that
sediment of Njaba River is suitable for sub-base and base-coarse in road
construction and also suitable to be used in concrete. Although this study cannot
be applied generally, at least it gave an idea regarding the utilization of dredged
sediment material.
Other researcher, Madhyannapu et al (2008), Ganesalingam et al (2013)
and Guo et al (2015) investigated the consolidation process and compressibility of
deposited sediment. Madhyannapu et al (2008) found that the compressibility of
3
compaction procedures and stress range. Meanwhile, Ganesalingam et al (2013)
more focused on the settling behavior of particles and variation of depth which
influenced the consolidation properties of deposited sediment. Guo et al (2015)
explained about sediment settlement and consolidation mechanism which affected
by initial sediment concentration and initial settlement height. Guo et al (2015)
concluded that the settlement and consolidation mechanism divided into three
different stages which are initial free settlement, hindered settlement and
self-weight consolidation settlement. Guo et al (2015) also found that self-weight
load of deposited sediment is linearly distributed in settlement direction. The
previous three studies explained the process which experienced by deposited
sediment and its affecting factors. Different with current research which discussed
the shear strength of sediment material, the previous three studies only focused on
the consolidation process. Nevertheless, the previous three studies confirmed that
water level of river as one important point in current research is one of the
affecting factors of consolidation process.
Besides consolidation process, deposited sediment also experienced
mechanical compaction as investigated by Nygard et al (2004) and Brain et al
(2011). Nygard et al (2004) investigated how diagenesis affects the
hydro-mechanical properties and compaction behavior of argillaeous sediment
and found that chemical diagenesis is more influence than mechanical compaction
and burial depth. Meanwhile, Brain et al (2011) investigated the compression
behavior of minerogenic low energy intertidal sediment and concluded that
structural variability decrease with application of higher effective stress. The
previous studies indicated alteration on sediment material properties either from
consolidation and mechanical compaction process yet did not explain more about
the alteration of shear strength of sediment material as the result of consolidation
and mechanical compaction process which discussed in current research.
Other than research on sediment, research on Bengawan Solo River also
has been done. Soemitro et al (2015) investigated the differences between quantity
of sediment at each different point of water depth on dry and monsoon season and
concluded that sediment load concentrations around surface level is lower than
4
depth. Maulana et al (2016) investigated differences between quantity of sediment
concentration affected by river water current during dry and monsoon season.
Maulana et al (2016) found that sediment concentration and current velocities
shows linear correlation. The previous studies focused on suspended sediment of
Bengawan Solo River in term of sediment transport of river engineering.
Meanwhile, the current research focused on sediment material on top of river bed
of Bengawan Solo River in term of geotechnical engineering.
When summarized, the previous studies focused on two conditions. First is
the condition when deposited sediment is the part of river environment,
experiencing consolidation and mechanical compaction processes. Second is the
condition when deposited sediment no longer as part of river environment, the
utilization of dredged sediment material. The previous studies did not investigate
and explain the middle condition when deposited sediment is removed which
associated with the shear strength of deposited sediment. Sediment removal is
discussed in current research as it is one proposed solutions to solve the problem
of excessive sediment material on river bed at Bengawan Solo River.
Practically, sediment removal by dredging has been done at Bengawan
Solo River. Nevertheless, the dredging method which was used is still
conventional by doing excavation using human power. It was not an effective
method for such a long river with approximately 600 km in length.
In-effectiveness of dredging using human power is influenced by the condition of
river and the condition of sediment material on top of river bed. When monsoon
season the level of river water is relative high. The high water level complicates
the dredging application because the worker has to dive to reach the deposited
sediment layer and it is very dangerous too. Meanwhile at dry season the level of
river water is relative low. The low water level simplifies the worker to reach the
deposited sediment layer and to dredge it. However, the low water level leads to
denser deposited sediment material on top of river bed which unable to be
dredged by human power.
Aside from difficulties of dredging application, dredging has negative
effect on the environment at and around the site of operation (Nielsen et al, 2015;
5
considerate action requires knowledge of deposited sediment material. The
knowledge of deposited material refers to the physical properties and shear
strength of sediment material. The knowledge of deposited material, especially
shear strength of sediment, is an indicator the necessity and the ease of sediment
removal.
As implied by previous research (Nygard et al, 2004; Madhyannapu et al,
2008; Brain et al, 2011; Ganesalingam et al, 2013; Guo et al, 2015), physical
properties and shear strength of deposited sediment material is determined by
consolidation and mechanical compaction process as part of deposition
phenomena. Both processes are affected by sediment self-weight, deposition rate,
suspended sediment concentration and fall velocity which related to each other.
And all of the factors are influenced by the level of river water which depends on
the weather condition and is greatly varies due to the great differences of rain fall
rate and temperature during dry and monsoon season. By understanding physical
properties and shear strength of sediment material, the scenario of sediment
removal can be determined effectively. Therefore, the research on assessment of
loading application of sediment material properties in downstream and estuary at
Bengawan Solo River is conducted.
1.2Research Objectives
The research aims to assess loading application on sediment material
properties in downstream and estuary at Bengawan Solo River. By understanding
loading application on sediment material properties in downstream and estuary at
Bengawan Solo River, the necessity of sediment removal by dredging and the
dredging method is able to be determined. Therefore, in order to achieve the aims
the following objectives are conducted as follows:
a. Understand the physical properties of sediment material at Bengawan Solo
River and distinguish it based on the area, downstream and estuary area
b. Understand the relation between properties of sediment material at
Bengawan Solo River and its sampling location
c. Understand the erosion and deposition phenomena experienced by
6
d. Understand the shear strength of sediment material at Bengawan Solo
River
The results of current research are expected to be the basis for estimating
the necessity of sediment removal and the determination of dredging method. In
the future by using the results, such as consolidation test result, are expected to
estimate the sediment removal schedule.
1.3Scope of Research
The current research focused on deposited sediment material in term of
geotechnical engineering. Hence, the sediment transport is not discussed in detail
but only critical shear stress of sediment material on top of river bed is discussed.
The critical shear stress of sediment material is used to determine whether
sediment material is able to be eroded by river stream naturally. In current
research, determination of features of river such as river depth, sectional area of
river and flow velocity is based on calculation using bathimetry map. In order to
understand more regarding the influence of the features of each location toward
physical properties and shear strength of sediment material accurately, further
7
CHAPTER 2
LITERATURE STUDY
2.1Relation between Sampling Location and Properties of Sediment Material
The study location where sediment material was obtained is along
Bengawan Solo River, start from Kanor village, Bojonegoro city, East Java
Province, until estuary area at Ujung pangkah village, Gresik city, East Java
Province, Indonesia. The map of study location is presented in Figure 2.1 with
five points were selected as the location of sediment material sampling. Details
and cross-section of each sampling locations is presented in Appendix A. The five
points are classified into downstream area and estuary area with coordinate of
each location as shown in Table 2.1.
Table 2.1 Coordinate of Study Location
Location Name Location Name
Figure 2.1 Locations of sediment material sampling at Bengawan Solo River
8
Sediment material deposited in the study locations is approximately 5 m in
thickness which measured from river bed to the surface of sediment material layer.
Sediment as material carried by streams and deposited on river bed can be
composed of particles range in size either of fine materials, mostly silts or clays,
or larger material, such as sand, which vary in specific gravity and vary in mineral
composition. It is seen from the grayish color of sediment material which obtained.
There is sediment material composed of sand particles and there is sediment
material composed of clay particle as presented in Figure 2.2.
(a)
(b)
Figure 2.2 Sediment material (a) sandy sediment (b) clayey sediment
Harsini et al (2007) merely investigated the geotechnical properties of clay
sediment, including the shear strength. Meanwhile, in current research there is
sand sediment. Therefore, through current research the behavior of sand sediment
9
that geotechnical properties of sediment material are influenced by the condition
of sedimentary environment. Then, in current research the relation between the
condition of sampling location and the geotechnical properties of sediment
material is conducted too. In case Harsini et al (2007) described sedimentary
environment as geological features such as the mineralogy of sediment material,
which determined the formation of sediment. Different with previous study, the
sedimentary environment in current research is described as the condition of river,
such as the width of river channel, the gradient of base surface and the
morphology of river. For example the condition of river which has significant
differences is downstream area and estuary area.
2.2Erosion and Deposition Experienced by Sediment
Erosion and deposition of sediment particles on top of river bed is natural
phenomena which determined by various complex natural processes and human
activities (Suif et al, 2016). Among erosion and deposition, some researchers
(Nygard et al, 2004; Madhyannapu et al, 2008; Brain et al, 2011; Ganesalingam et
al, 2013; Guo et al, 2015) more interested to investigate deposition phenomena,
especially consolidation process and mechanical compation. Deposition, which is
related to sedimentation, defined as the process where particulate matter carried
from its point of origin by either natural or human enhanced process is deposited
elsewhere on land surfaces or in water bodies. If the stream velocity and
turbulence fall below the values needed to keep particles in suspension or moving
with the bed load, then the particles will settle (Mitchel and Soga, 2005).
In order to investigate deposited sediment settlement and consolidation
mechanism, Guo et al (2015) conducted an experimental using a settlement
column. Guo et al (2015) divided deposition of sediment material into three
different stages. The three different stages are initial free settlement, hindered
settlement and self-weight consolidation stages, where the status of sediment
particles changed continuously. During self-weight consolidation settlement
stages, the effective stress further develops, intensifying the compression of
10
The self-weight of sediment material is affected by initial sediment concentration
and initial settlement height.
In case Guo et al (2015) focused on the whole process of deposition,
Madhyannapu et al (2008) and Ganesalingam et al (2013) preferred to investigate
the consolidation stages. Madhyannapu et al (2008) simulated the natural
sedimentation and consolidation process. Madhyannapu et al (2013) found that
the compressibility of deposited sediment appears to be dependent on the source
material, sedimentation, compaction procedures and stress range. Meanwhile,
Ganesalingam et al (2013) investigated the self-weight consolidation in
reclamation. Ganesalingam et al (2013) focused on the settling behavior of
particles and the variation of depth on consolidation properties of sediment.
Ganesalingam et al (2013) concluded that the nature of soil structure formed
depending on the settlement behavior of particles and further influenced the
consolidation properties of deposited sediment and the homogeneity of final
sediment.
Another theory said instead of self-weight consolidation settlement stage,
the final stage of deposition is autocompaction process. Massey et al (2006)
defined autocompaction as process where sediment (such as minerogenic fines
and peat) undergo a post-depositional reduction in volume as a result of the
weight of overlying sediments, the downward movement being due to the
cumulative compression of all the sediment below the level in question. Similarity
of both theories is the compression from the weight of overlying sediment which
can be regarded as mechanical loading or mechanical compaction. Mechanical
compaction changes because effective stress changes due to accumulation of
sediment and dissipation of fluid pore pressure. Nygard et al (2004) confirmed
that reduction in porosity in the upper 1000 m of sediment or shallow depth is
predominantly mechanical due to weight of overlying sediment.
Nygard et al (2004) investigated how diagenesis affects the
hydro-mechanical properties and compaction behavior of argillaeous sediment.
Nygard et al (2004) focused on the effect of mechanical loading and chemical
process on changes in porosity, permeability, compressibility, strength and
11
diagenesis is more influence than mechanical compaction and burial depth on
sediment properties and behavior. Meanwhile, Brain et al (2011) investigated the
compression behavior of minerogenic low energy intertidal sediment and found
that structural variability decrease with application of higher effective stress.
When summarized from previous studies, the mechanism of deposition
phenomena especially consolidation and mechanical compaction process is
obtained. At first, deposited sediment material generally has high void ratio, high
compressibility and high moisture content (Guo et al, 2015) which are the nature
of loose and soft sediment material. As time passed, due to consolidation and
mechanical compaction process, sediment material properties change. It turns
from loose and soft sediment material into dense and stiff sediment material.
Consolidation and mechanical compaction process changes particle orientation
and pore size distribution with associated decrease in permeability (Nygard et al,
2004). The soil skeleton and the pore fluid are compressible while the solids are
incompressible, or in others word both soil frame and water deform while soil
particle does not deform (Jeng and Seymour, 1997). Decreasing pore space
influences volumetric and elevation of sediment material which further increase
the density associated with effective stress (Brain et al, 2011). Smaller void ratio
means more compacted material and lead the river bed to be more resistance to
erosion. If further deposition occurs in the next time step, a new sediment material
layer is formed (Govindaraju, 1999) and it is the beginning of excessive sediment
on river bed.
Apart of the mechanism of deposition phenomena, from previous studies
the affecting factors of deposition is also summarized. Due to the self-weight of
sediment material, consolidation and mechanical compaction begins and sediment
material properties start to change. The self-weight of sediment material is
strongly affected by:
a. Initial thickness of sediment material layer on top of river bed and
configuration overlying and underlying lithologies
b. Initial sediment bulk density
c. Permeability of sediment layer which determined by particles composition
12
In addition of self-weight of sediment material on top of river bed, overall
deposition process is also influenced by deposition rates, suspended sediment
concentration and fall velocity. The three affecting factors are related to each
other, for example where more rapid deposition rates from denser suspension
creates initially denser structure of sediment material. Rapid deposition rate from
denser suspension indicates that deposition rate is affected by initial suspended
sediment concentration. Aside from suspended sediment concentration, deposition
rate is also affected by initial settlement height simultaneously. For the same
initial settlement height, deposition process with a lower initial sediment
concentration is faster than that with a higher initial sediment concentration.
Meanwhile, for the same initial sediment concentration, consolidation ratio
decrease and deposition process slows with the increase of the initial settlement
height (Guo et al, 2015).
Same as deposition rates, fall velocity is affected by initial suspended
sediment concentration. Fall velocity of a single particle is modified by the
presence of other particles. Experiments with uniform suspensions of sediment
and fluid have shown that the fall velocity is strongly reduced with respect to that
of single particles, when the sediment concentration is large. This effect is known
as hindered settling. Other than that, also in term of fall velocity, sand particles
with higher sediment rates are concentrated at the bottom part while clay particles
are in the upper part.
Sediment concentration as quantity of sediment transported by a stream is
a function of stream discharge, soil and land-cover features, land-use activities,
weather condition and many other factors. Staub (2000) said that during dry
season, the amount of suspended transported decrease while during wet season or
monsoon season, the amount of suspended sediment transported increase. Staub
(2000) also said that during wet season, the sediment material are coarser grained
than during dry season. When sediment concentration is a function of weather
condition, so is initial settlement height. Initial settlement height strongly relates
to water level of river which varies due to weather condition. During wet season,
water level of river increase and has higher initial settlement height while during
13
Nygard et al (2004) stated that deposition process especially mechanical
compaction vary with time due to series of burial and erosion sequences. Burial
and erosion sequences itself are depend on river stream which also a function of
weather condition.
Along with deposition rates and fall velocity, the settlement pattern of soil
particles in the soil-water mixture also influence the end conditions of sediment
material layer on top of river bed which formed in terms of its homogeinity,
compressibility and consolidation properties over the depth of the fill.
Ganesalingam (2013) said that settlement pattern mainly influence the association
between particles and aggregates, as group of particles, in the final sediment. The
settlement pattern itself is determined by type of clay minerals present in the
sediment, water content of the mixture, salt concentration and type of dissolved
electrolytes.
The previous studies indicated alteration on sediment material properties
either from consolidation and mechanical compaction yet did not explain more
about the alteration of shear strength of sediment material as the result of
consolidation and mechanical compaction process. Therefore, in current research
the shear strength of sediment material is discussed further. Not only that, the
shear strength of sediment material then associated with sediment removal such as
dredging as one proposed solution to solve the problem of excessive sediment
material on river bed at Bengawan Solo River. Further explanation regarding
dredging is discussed in the next section.
In case previous studies merely focused on deposition, then in current
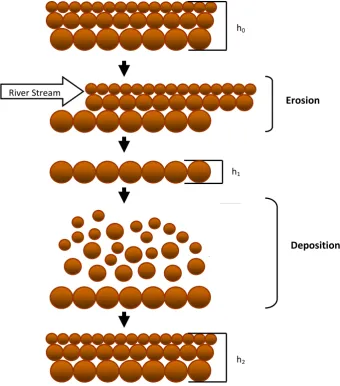
research erosion is explained. Erosion is as important as deposition because both
processes happen subsequently over times. Erosion phenomena could be defined
as detachment and movement of soil particles from soil surface by natural forces,
primarily by water and wind. Erosion includes all processes of denudation that
involves the wearing away of the land surface by mechanical action. The
transporting agents are by themselves capable only of limited wearing action on
rocks, but the process is reinforced when these agents contain particles of the
transported material. Greater average flow velocities in the transporting medium
14
drag and lift of the fluid exceed the gravitational, cohesive, and frictional forces
acting to hold them in place (Mitchell and Soga, 2005). If deposition only, it is
difficult to explain the condition of sediment material in current research. The
illustration of erosion and deposition phenomena is presented in Figure 2.3.
Figure 2.3 The illustration of erosion and deposition
2.3Shear Strength of Sediment as Indicator of Dredging Method in
Bengawan Solo River
2.3.1 Excessive Sediment Suffered by Bengawan Solo River
Natural and human-induced causes such as deforestation in upstream area
causes soil erosion in the river basin and increase the sediment material brought
by river stream. Higher amount of sediment material on river stream increases
Fa
ll Vel
o
ci
ty
h0
h2
River Stream
h1
Erosion
15
deposition in downstream and estuary area. The filling in of river bed with
sediment material due to deposition leads to excessive sediment.
Excessive amounts of sediment can result problems not only for natural
environment but also human build environment. It results in the destruction of
aquatic habitat and reduction in the diversity and abundance of aquatic life.
Moreover, the immediate consequence of excessive sediment is a decline in river
channel capacity. When river effectively having lost its capacity to evacuate
flood’s water, downstream flooding increase significantly (Zahar, 2008). The
outcome of excessive sediment in downstream area is different with estuary area.
In estuary area, excessive sediment causes frequent river channel blockage which
leads to the displacement of river mouth and river mouth branching (distributary).
Further, it results in the forming of delta or sandbar at the river mouth (Sukardi et
al, 2013).
Reducing excessive sediment material in streams could be done by doing
several preventive measures include:
a. Do proper repair and maintenance of drainage ditches and levees
b. Minimize disturbance of the stream banks
c. Avoid structural disturbance of the river
d. Reduce sediment excesses arising from construction activities
e. Apply artificial and natural means for preventing erosion
f. Use proper land and water management practices on the water-shed.
Although preventive measures are preferred over remedial measures, remedial
measures remain to be done to resolve excessive sediment that has been formed.
The examples of remedial measures are including:
a. Construction of detention reservoirs, sedimentation ponds or settling basins
b. Development of side-channel flood-retention basins
c. Removal of deposited sediment by dredging
2.3.2 Dredging as Proposed Solution for Bengawan Solo River
Dredging is the process of removing material from the bed or the banks of
a waterway (underwater excavation of soils and rocks) for the purpose of
16
development such as land reclamation (Johnson, 2003). It is very costly operation
which requires heavy equipment and long pipelines. Based on its equipment,
dredging can be classified into mechanical dredge and hydraulic dredge.
Mechanical dredges remove sediment material and lift it by a diggers or buckets,
and the excavated material is dumped into disposal barges for unloading at the
disposal site. Mechanical dredges have considerable digging power to excavate
hard compacted material and blasted-rock fragments. Meanwhile, hydraulic
dredges pick up the dredged material by means of suction pipes and pumps, which
suitable for slurry material.
Dredging production and costs vary widely by material type to be dredged.
The dredging of hard material can be an order of magnitude more expensive than
soft soil dredging. Therefore, the classification and physical properties of the
materials to be dredged are primary factors in choosing the type and class of
dredging equipment required which determine dredging cost. According to
Johnson (2003), geotechnical information which determines dredging equipment
type and class include:
a. The depth
b. The layer thickness
c. The hard or unsuitable material surface
d. Material profiles (soil layers of varying types)
e. Soil classification (soil types and soil density)
f. Soil physical properties (grain size distribution, density or unit weight,
moisture content, liquid limits, plasticity, soil strength)
Information, which is presented in Table 2.2 and Figure 2.4, shows how shear
strength parameter can be employed for the selection of determination of dredging
17
Table 2.2 Excavation Guidance on Application of Shear Strength Classification
General Practice Less Frequently Used
Trailling Suction Hopper Dredger 0 to 5 UCS 0 to 30 UCS
Cutler Suction Dredger 0 to 50 UCS 0 to 150 UCS
Backhoe Dredger 0 to 10 UCS 0 to 30 UCS
Grab Dredger 0 to 0.3 Cu & 0 to 1 UCS
Water Injection Dredger 0 to 0.005 Cu 0.005 to 0.015 Cu
Ploughing 0 to 0.02 Cu
Plain Suction Dredger 0 to 0.02 Cu
Bucket Ladder Dredger 0 to 10 UCS
Drilling and Blasting > 50 UCS
Excavation Method Strength (Mpa) - UCS and Cu
18
19
CHAPTER 3
METHODOLOGY
3.1Investigation of Sediment Properties
Investigation of sediment properties result in the soil type of sediment
material which classified by Unified Soil Classification System (U.S.C.S). By
understanding the soil type of sediment material, the behavior of sediment
material is obtained. Moreover, investigation of sediment properties also result in
the distribution of sediment properties based on the location and the depth, and
the relation among properties. From the behavior of sediment material which
resulted, later it is correlated with the condition of each location to determine the
effect of each location to the properties of sediment material. Investigation of
sediment properties includes sampling of sediment material and laboratory test.
3.1.1 Sampling of Sediment Material
Material used for current research was sediment material on river bed of
Bengawan Solo River. The sediment material was obtained by boring into
sediment layer. Within the process of sediment sampling, the first thing to do was
constructed the barge. The barge was used as support or footing to put the boring
instruments because the sampling location was on the river. After the barge was
prepared, the arrangement and installation of boring instruments was done. The
next step was boring to obtain the sample of sediment material. The process of
sediment sampling is presented in Figure 3.1.
The sampling of sediment material was done slightly at the edge of the
river by using thin-walled tube which appropriate with the procedure of sediment
sampling based on ASTM D1587. The boring was done merely up to 5 m depth,
because apart from the thickness of sediment layer which estimated to be 5 m,
also because the limitations in cost and boring instruments.
The sampling of sediment material was done at dry season started from
June 15th to June 21st, 2015, at five different locations which classified into
20
from three different depths which were 1 m, 3 m and 5 m, measured from the
surface of sediment layer to river bed. The three different depths was chosen
because apart from the limitations in cost, also because the assumption that the
results of sediment properties in those three different depths is significantly
different.
During dry season, starts from May to October, the level of river water of
Bengawan Solo River is relatively low in the range from 3 m to 4 m compared
with monsoon season, starts from November to April where the level of river
water reach 10 m to 12.5 m. The level of water level was measured from the
surface of river water to the surface of sediment layer on top of river bed. The
measurement of level of river water was done by using water level sensor. The
device of water level sensor is presented in Figure 3.2.
(a)
21 (c)
Figure 3.1 Process of sediment sampling (a) the barge
(b) sediment sampling at Location 1 (c) sediment sampling at Location 5
Figure 3.2 The device of water level sensor
The condition of sediment material is constantly submerged in the water
with the lowest level of river water ranges from 3 m to 4 m. In order to explain
more regarding the condition of sampling location including the level of river
water and the thickness of sediment layer, an illustration is presented in Figure
22
Figure 3.3 The illustration of sampling condition
3.1.2 Laboratory Test for Investigation of Sediment Properties
The properties of sediment which are discussed in current research are
listed in Appendix B. Meanwhile, the laboratory test for investigating the
properties of sediment material was comprised of physical properties test,
consolidation test and direct shear test.
1) Physical properties test
Physical properties test was done to determine the physical properties of
sediment material on river bed. The test consisted of several tests including
volumetric-gravimetric test, Atterberg limit test, sieve and hydrometer test.
a) Volumetric-gravimetric test
Volumetric-gravimetric test obtained several parameters of physical properties including unit weight (γt) based on ASTM D2937-71, water content
(wc) based on ASTM D2216-71, specific gravity (Gs) based on ASTM D854-58,
degree of saturation (Sr), porosity (n) and void ratio (e).
b) Atterberg limit test
Atterberg limit obtained liquid limit (LL) based on ASTM D423-66,
plastic limit (PL) based on ASTM D424-59 and plasticity index (PI).
c) Sieve and hydrometer test
Sieve test based on ASTM D6913-04 obtained grain size and grain
distribution for sediment material with particles size greater than 0.075 mm, while
hydrometer test based on ASTM D1140-00 obtained grain size and grain
23 2) Consolidation test
Consolidation test based on ASTM D2435-04 was done using incremental
loading. The incremental loading were 9,8 kN/m2, 19,6 kN/m2, 39,2 kN/m2, 78,5
kN/m2, 157 kN/m2, 314 kN/m2, 628 kN/m2 and 1256 kN/m2. It was applied on
saturated sample with 2 cm in height and 6 cm in diameter. The test determined
one-dimensional consolidation properties of sediment material including
preconsolidation stress (pc’), overconsolidation ratio (OCR), coefficient of
compressibility (mv), compression index (Cc), coefficient of consolidation (Cv)
and hydraulic conductivity (k).
3) Direct shear test
Direct shear test based on ASTM D3080-04 was done in consolidated
drained (CD) condition. It is done on saturated sample with 2 cm in height and 6
cm in diameter. The used confining pressure determined to be equal with
overburden pressure experienced by sediment material on river bed. Following triaxial confining pressure standard, the confining pressure was 0.5σv, σv and 2σv
for each sample with σv as overburden pressure. The used loading speed in direct
shear test was expected to be able to result complete drainage condition on
sediment sample in order to meet the criteria of consolidated drained condition.
Because in current research there were two types of sediment material, hence two
different loading speeds were used to adjust with the behavior of each sediment
material. The used loading speeds were:
0.2 mm/minute for sandy sediment
0.06 mm/minute for clay sediment
Direct shear test determined the shear strength parameters which were internal
friction angle (ϕ) and cohesion (c) of sediment material.
3.2Analysis of Erosion and Deposition Experienced by Sediment Material
Through analysis of erosion and deposition experienced by sediment
material in current research, it is discovered that sediment material not only
experiences deposition phenomena as studied by previous research (Nygard et al,
2004; Madhyannapu et al, 2008; Brain et al, 2011; Ganesalingam et al, 2013; Guo
24
phenomena happened subsequently over times so that the properties of sediment
material constantly changing. Nevertheless, the behavior of sediment material can
be learned. The analysis of erosion and deposition was done by using the result of
consolidation test and particle size distribution and hence, the evidence of
sediment material on top of river bed experienced erosion and deposition
phenomena is obtained. The illustration of erosion and deposition phenomena is
presented in Figure 2.3 of Chapter 2.
3.3Analysis of Shear Strength and Critical Shear Stress of Sediment
Material
As explained above, sediment material experiences erosion and deposition
phenomena. Sediment material experiences erosion when the shear stress caused
by water flow or river stream exceeds the resisting forces of sediment on top of
river bed and also the self-weight of particles (Bianco, 2014). The resisting force
of sediment material on top of river bed is influenced by particle diameter. The
resisting force is a limit value which determined whether the sediment is able to
be moved by river stream or not. The resisting force is also known as critical shear
stress. The approximate values of critical shear stress for non-cohesive particles
can be obtained from the extended Shields diagram. The values from Julien
(2002), as approximate reference values and also the grade scale commonly used
in sedimentation, which was used in current research is presented in Table 1 of
Appendix B. To get crude approximations, a shear stress value of τ = 0.1 Pa is
sufficient to move silts but not sands, and τc = 1 Pa is sufficient to move sands but
not gravels.
Shear strength of sediment material obtained from laboratory test was
compared with critical shear stress of sediment particles from Julien (2002), to
determine whether sediment material is able to be moved by river stream. And if
it is able to be moved by river stream which mean critical shear stress is greater
than shear strength, the natural erosion is happened and hence, sediment removal
25
indicates that sediment material cannot be eroded naturally and hence, sediment
removal is necessary.
After compared with critical shear stress, the analysis of shear strength
was used to determine the ease of sediment to be removed. Shear strength refers
to the density of sediment, starts from soft or loose sediment to stiff or hard
sediment. The criteria of sediment density based on shear strength are presented in
Table 3.1.
Table 3.1 Criteria of Sediment based on Shear Strength
qu cu
Mpa kPa
Very Loose 0 - 2.5 Extremely Soft < 10
Loose 2.5 - 5 Very Soft 10 - 20
Medium Dense 5 - 10 Soft 20 - 40
Dense 10 - 20 Medium 40 - 75
Very Dense > 20 Stiff 75 - 150
Very Stiff 150 - 300
Extremely Stiff > 300
Sand and Gravel Silt and Clay
Simply, the soft or loose sediment material is easy to be removed by using
dredging equipment with small capacity such as dredging by suction or even by
using human power. Otherwise, stiff or hard sediment material needs dredging
equipment with large capacity. The method of dredging equipment, based on the
shear strength of sediment is presented in Table 2.3 and Figure 2.4 of Chapter 2.
The methodology of current research is summarized in a flowchart as presented in
26 Sampling of Sediment Material
Start
Literature Study
Measurement of Water Level
Finish Conclusion Laboratory Test:
1. Physical Properties Test
a. Volumetric-Gravimetric Test b. Atterberg’s Limit Test c. Sieve and Hydrometer Test 2. Consolidation Test
3. Direct Shear Test
Analysis:
1. Analysis of Sediment Properties 2. Analysis of Erosion and Deposition
Experienced by Sediment
3. Analysis of Shear Strength and Critical Shear Stress of Sediment
27
CHAPTER 4
RESULTS AND DISCUSSION
4.1Physical Properties of Sediment Material at Five Different Locations Sediment material at five different locations (see Figure 4.1 and Appendix
A) was classified based on its soil type. By understanding the soil type of
sediment material, the description regarding behavior of sediment material was
obtained. The classification of the soil type of sediment material was done based
on Unified Soil Classification System (U.S.C.S) by using the result of sieve and
hydrometer test, and also the result of Atterberg’s limit test which summarized in
Table 4.1. Meanwhile, the whole result of physical properties test is presented in
Appendix C.
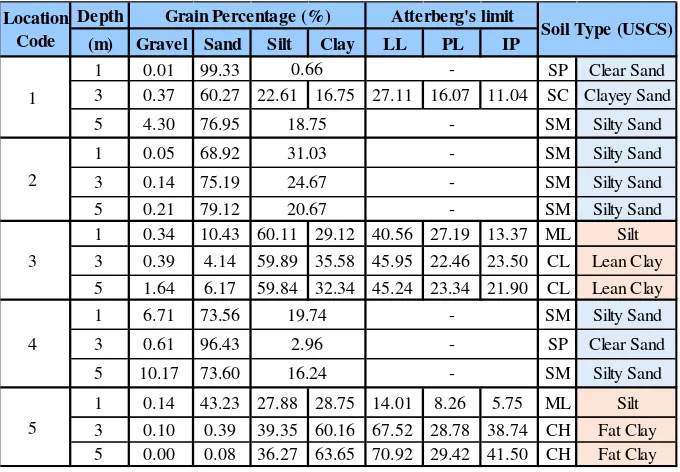
Table 4.1 Grain Percentage and Atterberg’s Limit of Sediment Material
Depth
(m) Gravel Sand Silt Clay LL PL IP
1 0.01 99.33 SP Clear Sand
3 0.37 60.27 22.61 16.75 27.11 16.07 11.04 SC Clayey Sand
5 4.30 76.95 SM Silty Sand
1 0.05 68.92 SM Silty Sand
3 0.14 75.19 SM Silty Sand
5 0.21 79.12 SM Silty Sand
1 0.34 10.43 60.11 29.12 40.56 27.19 13.37 ML Silt
3 0.39 4.14 59.89 35.58 45.95 22.46 23.50 CL Lean Clay
5 1.64 6.17 59.84 32.34 45.24 23.34 21.90 CL Lean Clay
1 6.71 73.56 SM Silty Sand
3 0.61 96.43 SP Clear Sand
5 10.17 73.60 SM Silty Sand
1 0.14 43.23 27.88 28.75 14.01 8.26 5.75 ML Silt
3 0.10 0.39 39.35 60.16 67.52 28.78 38.74 CH Fat Clay
5 0.00 0.08 36.27 63.65 70.92 29.42 41.50 CH Fat Clay
Grain Percentage (%) Atterberg's limit
sediment layer. According to the results which presented in Table 1, the soil type
of sediment material based on the depth is relatively similar. Meanwhile based on
28
sediment and clay sediment. Sand sediment was found at downstream areas
which were Location 1, Location 2 and Location 4, while clay sediment was
found at estuary area which was Location 5. Location 3 was an exception because
even though classified into downstream area, it has clay sediment. Further
explanation is discussed later in the next section.
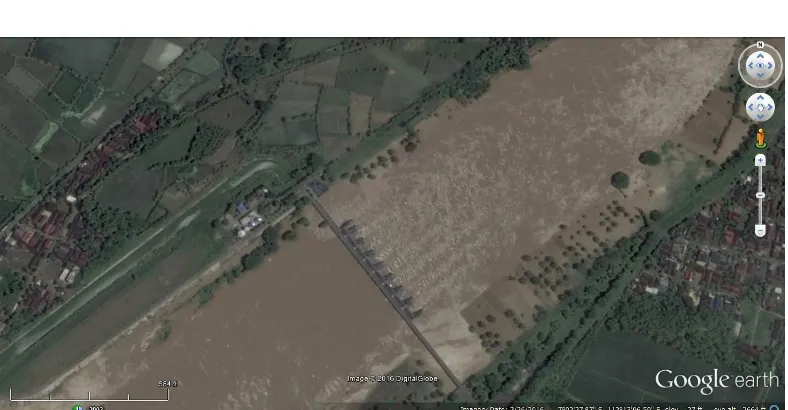
Figure 4.1 Locations of sediment material sampling at Bengawan Solo River
(Source: Google Earth)
Although based on the depth the soil type of sediment material is
relatively similar, the distribution of sediment properties is varies. The
distribution of sediment properties is presented in Figure 4.2 to Figure 4.5.
0 2 4 6 8 10 12 14 16 18
1 2 3 4 5
γd
(kN/m
3)
Location
29
Figure 4.3 Distribution of water content
0.0
Figure 4.4 Distribution of void ratio
0
30
The variation on distribution of sediment properties based on the depth is
caused by the subsequent erosion and deposition over times. Meanwhile based on
the location of sediment sampling, the distribution of sediment properties is
appropriate with the soil type. It can be seen from the Figure 4.2 to Figure 4.5
that downstream area with sand soil has higher dry unit weight, range from 7.71
kN/m3 to 11.04 kN/m3, than estuary area with clay soil, range from 4.55 kN/m3 to
6.98 kN/m3. The downstream area also has lower water content range from
15.61% to 38.64%, lower void ratio range from 0.62 to 1.24, and lower
percentage of fine particle range from 0.66% to 39.366%. The results are caused
by the behavior of soil type of sediment material, where sand soil is heavier than
clay soil in the same volume. Furthermore, sand soil experiences immediate
settlement so that it becomes denser in short time and results in smaller void ratio
compared with clay soil. With smaller void ratio, the water fills in the void is
lesser and results in lower water content for sand soil, aside from the behavior of
sand soil which does not bind water.
The variation on distribution of sediment material based on the location is
appropriate with the soil type for some parameters, such as dry unit weight, water
content, void ratio and percentage of fine particles. The distribution of D50 of
sediment material (see Figure 4.6) based on the location tends to change
longitudinally corresponding to river flow from downstream to estuary which is
known as downstream fining where sand-mud (silt and clay) transition happened.
According to Luo et al (2012), downstream fining happened due to the
influence of tributaries which also owned by Bengawan Solo River. Downstream
fining generates smaller size for particles that have been transported farther from
their source location. It means sediment grain size gets smaller from downstream
area (Location 1, 2 and 4) to estuary area (Location 5). At estuary area, clay
sediment is probably related to the sudden deposition of suspended fine particles
under the effect of tides and as the consequences of freshwater and seawater
mixing. Under the influence of strong tides, current in the channel of the estuary
oscillate, producing two periods of slack water with very low flow velocity (< 0.1
31
Julien (2002) where fine grains usually were dominant in low energy condition.
From hydraulic perspective, it can be predicted that the coarser fraction of the
suspended sediment is deposited first along downstream area (Location 1, 2 and
4), leaving the finer particle in suspension to deposit at estuary (Location 5)
which enhanced by flocculation. Meanwhile, according to Menting et al (2015)
downstream fining was influenced by the lithology of sediment particle and
transport capacity/stream power.
0.00 0.05 0.10 0.15 0.20 0.25
1 2 3 4 5
D50
(mm)
Location
1 m depth 3 m depth 5 m depth
Figure 4.6 Distribution of D50
32
As mentioned above, Location 3 was an exception because even though
classified into downstream area, it has clay sediment. It is possibly because there
is a dam which known as Babat Barrage (7o2’ 29.9” S, 112o13’ 5.88” E) before
the third sampling location. The picture of Babat Barrage is presented in Figure
4.7. The coarse particles which literally move alongside the river bed is deposited
in the dam area while the fine particles move past the dam area along with river
stream. Further the fine particles deposited in river bed for example at Location 3,
or carried by river stream to farther location.
4.2Relation between Properties of Sediment Material and Its Sampling
Location
The behavior of sediment material could be decided by its properties
which are related to one another, for example dry unit weight with void ratio. The
relation between dry unit weight with other properties of sediment material such
as water content, void ratio and percentage of fine particles, are presented in
Figure 4.8 to Figure 4.10.
0 20 40 60 80 100
7 9 11 13 15 17 19
wc
(%
)
γd(kN/m3)
Location 1 Location 2 Location 3 Location 4 Location 5
33
Location 1 Location 2 Location 3 Location 4 Location 5
Figure 4.9 Relation between dry unit weight versus void ratio
0
Location 1 Location 2 Location 3 Location 4 Location 5
Figure 4.10 Relation between dry unit weight versus percentage of fine particles
From Figure 4.8 to Figure 4.10, it is found that when dry unit weight
increases then water content, void ratio and percentage of fine particle of
sediment material decreases. Unit weight is defined as the ratio of total weight to
total volume. Higher unit weight implies heavier of total weight in current
volume which indicates more soil particles with dense arrangement. More soil
particles with dense arrangement results in low void to fills in with water and
hence, the water content is low.
Since the properties of sediment material in each location have relation
among them, where one property is influenced by other property, then the
34
was done apart of to distinguish properties of sediment material based on each
location, also to confirm the assumption where properties of sediment material
are influenced by sedimentary environment. In current study, sedimentary
environment is defined as the condition of sampling location. Parameters used as
representation of the condition of sampling location are sampling depth, sectional
area of river and flow velocity. The relation between dry unit weight with
Location 1 Location 2 Location 3 Location 4 Location 5
(a)
Location 1 Location 2 Location 3 Location 4 Location 5