In this chapter, the writer discusses about the result of the research, the data description, analyzing data and the hypothesis of testing.
4.1 Finding of the Research
After conducting the research, the writer got the data of the ability of writing recount text of tenth grade students of MA NU TBS Kudus in the academic year 2012/2013 before and after being taught by using Semantic Mapping Strategy.
The data for this research were taken from the writing ability test result of tenth grade students of MA NU TBS Kudus to find out whether or not there is a significant difference between the ability of writing recount text of tenth grade students of MA NU TBS Kudus in the academic year 2012/2013 before and after being taught by using Semantic Mapping Strategy. To measure the purpose of the research, the data were analyzed using t-test for dependent sample.
Before the students were taught by using Semantic Mapping Strategy, the writer gave pre-test to know their writing ability. Then, the writer gave treatment, taught by using Semantic Mapping Strategy. Finally, to find out the result of the treatment the writer gave post-test to the students. The data as follows:
4.1.1 The Data Description of The Ability of Writing Recount Text of Tenth Grade Students of MA NU TBS Kudus in the Academic Year 2012/2013 before being Taught by Using Semantic Mapping Strategy
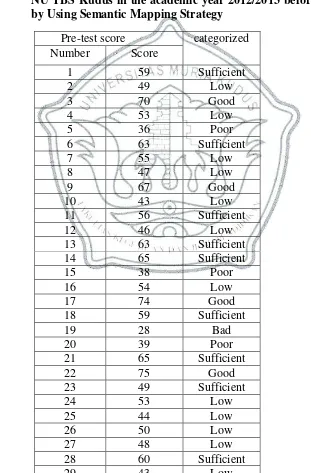
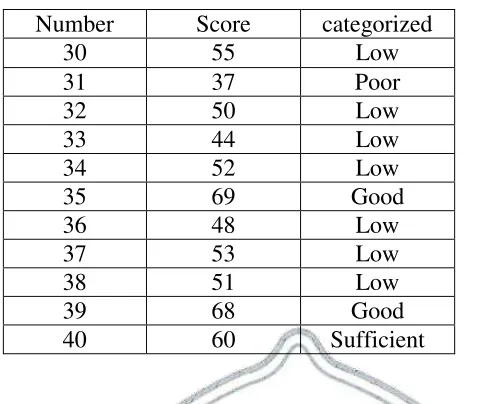
After conducting the writing test to measure the ability of writing recount text of tenth grade students of MA NU TBS Kudus in the academic year 2012/2013 before being taught by using Semantic Mapping Strategy, the writing score of tenth grade students of MA NU TBS Kudus in the academic year 2012/2013 before being taught by using Semantic Mapping Strategy can be seen in the table 4.1 bellow: Table 4.1 The Ability of Writing Recount Text of Tenth Grade Students of MA
Table 4.1 The Continuation
From the data of the ability of writing recount text of tenth grade students of MA NU TBS Kudus in the academic year 2012/2013 before being taught by using Semantic Mapping Strategy, the writer concluded that the highest score is 75 and the lowest score is 28. Then the writer makes the frequency and percentages as follows: Table 4.2 The Frequency and Percentages of The Ability of Writing Recount
Based on the students score above, the writer found the average (mean) score
of the students’ writing skill in pre-test is 53.7 with the standard deviation is
10.48(see Appendix 7). It means that the ability of writing recount text of tenth grade
The figure of students’ writing skill achievement before being taught by using
Semantic Mapping Strategy can be describe with the diagram as follow:
0 2012/2013 before being Taught by Using Semantic Mapping Strategy
From the graphic above, it can be seen that the highest frequency of the ability of writing recount text of tenth grade students of MA NU TBS Kudus in the academic year 2012/2013 before being taught by using Semantic Mapping Strategy is score 44-51 at level 11.
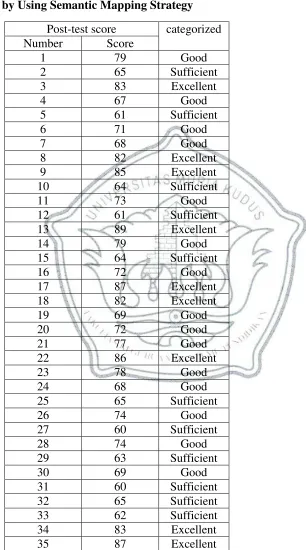
4.1.2 The Data Description of The Ability of Writing Recount Text of Tenth Grade Students of MA NU TBS Kudus in the Academic Year 2012/2013 after being Taught by Using Semantic Mapping Strategy
students of MA NU TBS Kudus in the academic year 2012/2013 after being taught by using Semantic Mapping Strategy can be seen in the table 4.3 bellow:
Table 4.3 The Continuation
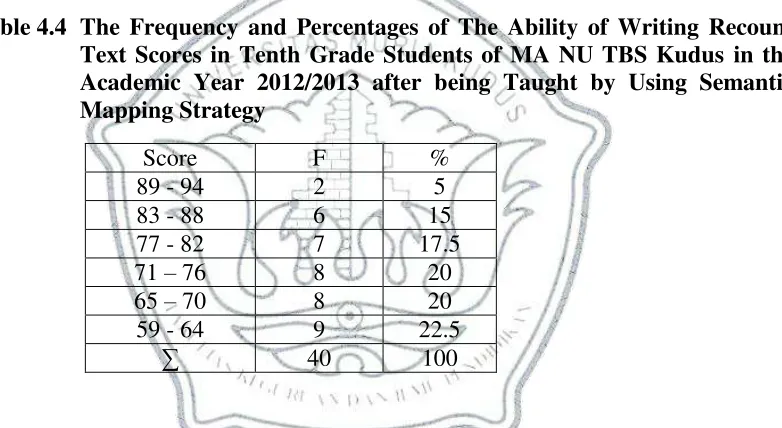
From the data of the ability of writing recount text of tenth grade students of MA NU TBS Kudus in the academic year 2012/2013 after being taught by using Semantic Mapping Strategy, the writer concluded that the highest score is 94 and the lowest score is 60. Then the writer makes the frequency and percentages as follows: Table 4.4 The Frequency and Percentages of The Ability of Writing Recount
Based on the students score above, the writer found the average (mean) score
of the students’ writing skill in post-test is 73.35 with the standard deviation is
9.12(see Appendix 9). It means that the ability of writing recount text of tenth grade
students of MA NU TBS Kudus is categorized as “Good”.
The figure of students’ writing skill achievement after being taught by using
0 2 4 6 8 10
59-64 65-70 71-76 77-82 83-88 89-94
Frequency
Figure 4.2 The Bar Diagram in The Ability of Writing Recount Text of Tenth Grade Students of MA NU TBS Kudus in the Academic Year 2012/2013 after being Taught by Using Semantic Mapping Strategy From the graphic above, it can be seen that the highest frequency of the ability of writing recount text of tenth grade students of MA NU TBS Kudus in the academic year 2012/2013 after being taught by using Semantic Mapping Strategy is score 59-64 at level 9.
4.2Hypothesis Testing
Table 4.5 The Summary of t-test Result of The Ability of Writing Recount Text of Tenth Grade Students of MA NU TBS Kudus in the Academic Year 2012/2013
Test N Mean SD Df t-table t-observation Pre
40 53.7 10.48 39 2.02 16.54
Post 73.35 9.12
From table 4.5, it indicates that a significant difference between the ability of writing recount text of tenth grade students of MA NU TBS Kudus in the academic year 2012/2013 before and after being taught by using Semantic Mapping Strategy. The t-observation (to) is 16.54, is higher than the t-table (2.02) in level of significance 5%. Therefore, the null hypothesis (Ho) is rejected and the alternative hypothesis (Ha) is accepted. It can be concluded that there is a significant difference between the ability of writing recount text of tenth grade students of MA NU TBS Kudus in the academic year 2012/2013 before and after being taught by using Semantic Mapping Strategy.