Leanness assessment in automotive industry:
case study approach
Masoud Rahiminezhad Galankashi*
Department of Materials, Manufacturing and Industrial Engineering, Faculty of Mechanical Engineering,
Universiti Teknologi, Johor, Malaysia Email: [email protected] *Corresponding author
Syed Ahmad Helmi
Department of Materials, Manufacturing and Industrial Engineering, Faculty of Mechanical Engineering,
Universiti Teknologi, Johor, Malaysia and
Center for Engineering Education (CEE), Universiti Teknologi Malaysia,
81310 UTM Skudai, Johor, Malaysia Email: [email protected]
Muhammad Hisjam
Department of Industrial Engineering, Faculty of Engineering,Sebelas Maret University, Surakarta, Indonesia Email: [email protected]
Abd Rahman Abdul Rahim
UTM Razak School of Engineering and Advanced Technology, Universiti Teknologi Malaysia International Campus,
Kuala Lumpur, Malaysia Email: [email protected]
An overall quantity of leanness is also provided for each company. Finally, some managerial insights and future research directions are recommended. According to the results, second case study has the highest degree of leanness in comparison to other two companies. In addition, this company has the best performance with regard to each supply chain driver.
Keywords: supply chain strategy; SCS; lean manufacturing; leanness assessment; automotive industry.
Reference to this paper should be made as follows: Galankashi, M.R., Helmi, S.A., Hisjam, M. and Rahim, A.R.A. (2018) ‘Leanness assessment in automotive industry: case study approach’, Int. J. Value Chain Management,
Vol. 9, No. 1, pp.70–88.
Biographical notes: Masoud Rahiminezhad Galankashi received his BSc, MSc and PhD in the field of Industrial Engineering from the QIAU and UTM, respectively. He is currently working on different areas of industrial engineering focusing on supply chain management (SCM). His research interests are SCM, simulation, MCDM/MADM, mathematical modelling, lean manufacturing and DOE.
Syed Ahmad Helmi is an Assistant Professor of Industrial Engineering from the Universiti Teknologi Malaysia. His main areas of interest are supply chain management and facility planning. He is an expert in the area of system dynamics.
Muhammad Hisjam is an Assistant Professor of Industrial Engineering from the Sebelas Maret University. His main areas of interest are supply chain management, logistics and sustainability development.
Abd Rahman Abdul Rahim is currently an Associate Professor from the UTM Razak School in Kuala Lumpur. His areas of interest include supply chain and new product development. He is involved in research and consultancy with both local and multinational corporations.
1 Introduction
cross-functional drivers of SC. In this regard, recognising, classifying, categorising and applying the suitable metrics to properly screen and assess the leanness of companies from operational perspective is an important issue.
There is a gap in assessing the leanness of companies with regard to its operational activities of SC drivers. In other words, LM has been discussed in previous literature but the leanness assessment is less investigated. Thus, to address this gap, this study is conducted to assess the leanness of three manufacturing case studies focusing on diverse drivers of SC. Chiefly, logistic drivers of facility, inventory and transportation in addition to cross-functional drivers of sourcing, pricing and information were selected as the major components of any SC. Leanness related activities of these drivers were studied and a developed questionnaire of previous literature was applied to assess the leanness of case studies. Next, diverse leanness score of all SC drivers were calculated. Finally, an overall leanness index was correspondingly calculated for all three case studies of this study.
Therefore, the main motivation of this study is to answer the research question of how the leanness can be assessed practically and from an operational perspective. As an Implication for research and practice, the outputs of this research support practitioners and managers to emphasis on overall leanness index or only consider their preferred SC drivers. From another view point, once a manager or practitioner is concerned with leanness improvement of transportation, inventory or other drivers, it is possible to emphasis on that definite driver in place of seeing overall leanness index.
In summary, proposing an operational framework to assess the leanness is necessary. This framework can assist managers to estimate the quantity of leanness based on each SC driver. The scope of this research is restricted to the manufacturing companies of automotive industry. These companies are categorised as small and medium enterprises (SMEs) and are automobile part manufacturers. Though, the framework of study, methodology of the research, and outcomes are applicable to managers and researchers who aim to assess the leanness of their companies with regard to operational activities of SC. This research gives clue to lean-based operational activities of SC drivers,
and responsiveness to achieve a strategic position in the SC. In this regard, understanding the drivers of the SC is necessary. The logistical and cross-functional drivers of the SC include facility, inventory, transportation, sourcing, pricing and information. They must be considered in the SC decisions (Chopra and Meindl, 2007).
Based on an old definition, supply chain management (SCM) is the administration of material and information which flows internally and among facilities including suppliers, manufacturing plants and distribution centres (DCs) (Thomas and Griffin, 1996). SCM is an element that has lately achieved an excessive amount of consideration in the business world. SCM includes the quantity of decisions to satisfy the final-customer requirements (Seferlis and Giannelos, 2004).
2.1 Lean implementation
Companies should set the same objective for their activities to remain competitive. In this regard, defining the same strategy for all echelons of SCs has been recommended in literature. A strategy is defined as a plan to arrive at a preferred future, such as a solution to a problem or achievement of a goal. More related to SCM, Chopra and Meindl (2007) defined SCS as a tool which determines the policies for the procurement of raw materials, the conveyance of materials between SC nodes, production and the delivery of the products to the customer. Proper implementation of SCS improves the SC performance (Gunasekaran et al., 2004). Consequently, to remain competitive, the SCS should be translated into the operational activities of companies. LM guarantees significant advantages in terms of improved administrative and SC incorporation and communication (Scherrer-Rathje et al., 2009). LM aims to produce the final products at the pace of customer demand with little or no waste (Shah and Ward, 2003). The continuous improvement techniques and the reduction of waste, recognised as lean concepts, enables managers and practitioners to follow excellence.
A new concept has been created named as lean supply chain (LSC) by joining these two major management systems. Numerous cases of different industries have proved the effectiveness of the LSC (Husby and Swartwood, 2009; Manrodt et al., 2008; Plenert, 2010). However, although the concept of the LSC has been discussed by many authors (Curkovic and Sroufe, 2011; Vickery et al., 2003; Christopher and Towill, 2002, 2000; Christopher and Ryals, 1999), its operational activities with regard to SC drivers have been less investigated. Therefore, identifying, classifying, implementing, and assessing the right activities of LM can be beneficial (Fawcett et al., 2014; Wieland and Wallenburg, 2012). Consequently, identification of lean-related activities assists managers in checking the conformance of their companies based on the LM concept.
2.2 Leanness assessment
Following presents some important studies on leanness assessment (Azadeh et al., 2015). Regarding the operational perspective, according to Melton (2005) and Azevedo et al. (2013), leanness can be applied by using a quantity of methods including 5S, Kanban, takt-time, visual control, single-minute exchange of die (SMED) and poke-yoke. Furthermore, some researchers concentrated on the idea of LM and its advantages at production groups (Saurin and Ferreira, 2009). However, according to Singh et al. (2010), few studies have been conducted in the area of leanness assessment in manufacturing companies. Following are major approaches used to assess the leanness (Azadeh et al., 2015).
Houshmand and Jamshidnezhad (2006) applied process, design and functional factors to provide a model for appropriate design of LM system based on axiomatic design theory. Comparable to previous study, Abdulmalek and Rajgopal (2007) defined the lean principles used in a big steel mill company. They applied value stream mapping (VSM) to notice the occasions for numerous leanness assessment approaches. They similarly characterised a simulation approach to demonstrate the advantages of lean execution including decreased amounts of work-in-process (WIP) parts and reduced lead-time of manufacturing.
Dynamic evaluation is another technique used to assess the leanness. This method applies diverse patterns of metrics. Actually, based on Srinivasaraghavan and Allada (2006), the approach needs variety of patterns of numerous conditions of system. Additional approach to evaluate the leanness is to control a substitute distance among present state and best performance of system in a relative assessment to compute the leanness level.
Swamidass (2007) used the inventory level to sales value as a metric to assess the SC leanness. It is an easy approach to study and investigate outcomes by this ratio (the lesser the superior), however, this study focused only on inventory performance and neglected other perspectives of leanness. In another study, Wan and Chen (2008) provided a unit-invariant leanness metric in addition to self-contained standard to calculate the leanness degree in manufacturing SCs. Using data envelopment analysis (DEA) method, leanness metrics extract value-adding savings from a production process to provide a benchmark of leanness frontier.
Based on Qi et al. (2009), the major objectives of leanness are to decrease cost and improve the competence by removal of waste in both interior and exterior procedures of the company. Based on Parveen and Rao (2009), the major concentration of leanness is on removing waste or non-value activities all over the SC to allow the economic manufacturing of small quantities and improving cost lessening, improve the manufacturing flexibility, increase the profitability and attain internal production competences and setup time reduction. In addition to waste elimination, Mohammed et al. (2008) stated that leanness aims to develop value-added procedures as required by the customer.
Based on Singh et al. (2010), the leanness of manufacturers is an idea that joins numerous approaches of supporting LM techniques. In addition, they stated that leanness evaluation factors, as well as supporting internal company concerns such as lean practices, wastes and investment priorities should likewise cover inter-company concerns connected to its customers and suppliers. This is similarly showed by Demeter and Matyusz (2011). Based on this study, lean practices support the whole company from lean growth, lean supplying process, LM and lean distribution.
Holden (2011) showed the variations happened in numerous departments after using leanness philosophies. Lately, some studies have made combined indicators (Hatefi and Torabi, 2010). Seyedhosseini et al. (2011) implemented balanced scorecard (BSC) approach to provide a model for performance assessment of companies. Leanness assessment criteria were selected based on BSC approach. The proposed model of this study was capable to choose proper objectives and criteria for an organisation.
Azevedo et al. (2012) proposed an agile and lean index to assess the leanness of companies in automotive industry. Delphi approach was applied to obtain experts’ views for a set of weighted lean and agile metrics. They made a comparison with proposed agile and lean index. Vimal and Vinodh (2012) provided fuzzy hypothesis for leanness assessment with a new approach according to IF-THEN instructions. They proposed a model in a conceptual study and found three different factors of enabler, criterion, and attributes to define the strength of each criterion and provide some improvements.
Vimal and Vinodh (2013) applied fuzzy logic and artificial neural networks to manage the manual calculation glitches. They proposed a simulation-based approach for leanness evaluation and authorise the model with a case study of an Indian manufacturing company. Behrouzi and Wong (2013) developed an integrated model to assess the SC leanness of SMEs in the automotive industry. As a summary, this study was conducted to methodically calculate the leanness of a SC with the aim of some performance metrics. Principally, four performance categories (cost, quality, delivery and reliability and flexibility) in addition to 28 related metrics were chosen as substitutes of leanness.
Azadeh et al. (2015) developed an approach on leanness evaluation by cognitive map and multivariate investigation. A heuristic algorithm is developed to attain a full degree of leanness. Next, a sensitivity analysis was conducted to find the influence of each leanness factor on LSCS. The proposed method is productive while using for a number of printing and packing companies, in Iran, as a case study.
It can be concluded that there is a gap in assessing the leanness of SCs with regard to its operational activities of SC drivers. In addition, one significant shortage of all these studies is their inability to address the single score of leanness. Therefore, proposing an operational approach as a guideline to assess the leanness in addition to its associated single score is necessary. This approach can guide managers to estimate the quantity of leanness based on SC drivers. Limitations of the previous approaches include the comprehensive nature of the tools. First, whether the organisation operates in a service or manufacturing industry may make some differences in applying the approach, considering that some performance dimensions contain an industrial bias in the proposed approach. Second, the companies may prefer to give a weight to each performance indicator.
assessment approaches are very wide, changing from simple qualitative checklist to compound quantitative mathematical approaches. Subsequent to the lean implementation trend, lean thinking is also shifting from process-level monitoring to enterprise-level monitoring. In another study by same authors, Narayanamurthy and Gurumurthy (2016b) developed an index for facilitating continuous improvement of lean implementation. The goal of this research was to designate a leanness assessment approach to consider the interaction among lean components to calculate the systemic leanness and for supporting continuous improvement of lean implementation
Based on the literature review, there are numerous metrics to evaluate the leanness. However, these metrics only assess the output of implementing the lean techniques. In other words, once the LM tools were implemented, these metrics can be used. Additionally, none of these approaches provide a categorised perspective based on SC drivers which are more significant and tangible for the managers and practitioners. Therefore, providing this framework can assess the leanness of companies or match the companies’ current tasks to operational activities of LM.
Figure 1 Research procedure
Readi g o Lea Ma ufa tu i g LM a d its elated te h i ues
Ide tif i g the lea - ased a tivities of ea h suppl hai d ive s
Catego izi g a tivities ased o the ajo pe spe tives of lea a ufa tu i g
T a slati g the p oposed a tivities i to a su ve to assess the lea ess of o pa ies
Assess e t of lea ess ased o ea h suppl hai d ive a d p ovidi g a si gle lea ess i de
3 Research methodology
companies. The questionnaire was filled using interview to provide more explanation to production managers.
4 Applied framework
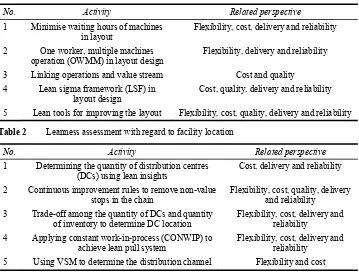
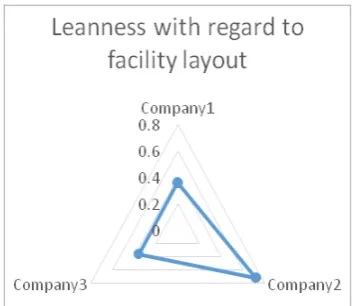
In our previous study, Galankashi and Helmi (2016), a new framework was proposed to assess the leanness from operational perspective. This study provided a novel assessment tool for the operational activities of LM. The operational activities of logistic (facility, transportation and inventory) and cross-functional (information, sourcing and pricing) drivers were used to propose the lean-related activities. The most important activities of each SC driver are tabulated in Tables 1–7. Based on Tables 1 and 2, the majority of lean-based operational activities of facility driver (layout and location) are a function of flexibility. Regarding the manufacturing context, flexibility is classically relates to mobility, uniformity and range. On the other hand, it is related to the numerous situations that a system can implement different plans, the capability to interchange from one product to another and the aptitude to achieve its predefined objectives (Slack, 1983; Upton, 1995; Stevenson and Spring, 2007). In the context of this research, minimising the waiting hours of machines, OWMM and application of lean tools can lead to layout flexibility. In addition, continues improvements rules, DCs location, CONWIP and using VSM help the managers to improve the flexibility of their facility location (Ziaei et al., 2013).
Table 1 Leanness assessment with regard to facility layout
No. Activity Related perspective
1 Minimise waiting hours of machines
in layout Flexibility, cost, delivery and reliability 2 One worker, multiple machines
operation (OWMM) in layout design Flexibility, delivery and reliability 3 Linking operations and value stream Cost and quality 4 Lean sigma framework (LSF) in
layout design Cost, quality, delivery and reliability 5 Lean tools for improving the layout Flexibility, cost, quality, delivery and reliability Table 2 Leanness assessment with regard to facility location
No. Activity Related perspective
1 Determining the quantity of distribution centres
(DCs) using lean insights Cost, delivery and reliability 2 Continuous improvement rules to remove non-value
stops in the chain Flexibility, cost, quality, delivery and reliability 3 Trade-off among the quantity of DCs and quantity
of inventory to determine DC location Flexibility, cost, delivery and reliability 4 Applying constant work-in-process (CONWIP) to
Table 3 Leanness assessment with regard to inventory
No. Activity Related perspective
1 Adoption of JIT and Kanban in inventory
planning Flexibility, cost, delivery and reliability 2 TPM, SPC and TQM help to implement
inventory plans Flexibility, cost, quality, delivery and reliability 3 Controlled work-in-progress (CONWIP) should
be conducted in inventory planning Flexibility, cost, delivery and reliability 4 Production levelling is the lean strategy to
remove over-production and extra inventory Flexibility, cost, quality, delivery and reliability 5 Employee involvement assists managers to
perform inventory plans Flexibility, cost, quality, delivery and reliability
Based on Table 3, the majority of lean-based operational activities of inventory are a function of flexibility. Regarding the inventory context, inventory flexibility is a form of post-production flexibility. Other examples of post-production flexibility are customer-driven product substitution and dynamic pricing (Iravani et al., 2009). In the context of this research, all activities of Table 3 are related to the flexibility of inventory. In addition, all activities of Table 4 are related to cost. This can be interpreted as the importance of cost in lean-based transportation of manufacturing companies.
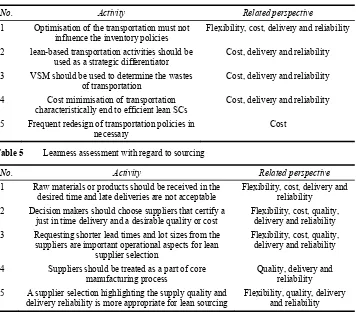
Table 4 Leanness assessment with regard to transportation
No. Activity Related perspective
1 Optimisation of the transportation must not
influence the inventory policies Flexibility, cost, delivery and reliability 2 lean-based transportation activities should be
used as a strategic differentiator Cost, delivery and reliability 3 VSM should be used to determine the wastes
of transportation Cost, delivery and reliability 4 Cost minimisation of transportation
characteristically end to efficient lean SCs Cost, delivery and reliability 5 Frequent redesign of transportation policies in
necessary Cost
Table 5 Leanness assessment with regard to sourcing
No. Activity Related perspective
1 Raw materials or products should be received in the
desired time and late deliveries are not acceptable Flexibility, cost, delivery and reliability 2 Decision makers should choose suppliers that certify a
just in time delivery and a desirable quality or cost Flexibility, cost, quality, delivery and reliability 3 Requesting shorter lead times and lot sizes from the
suppliers are important operational aspects for lean supplier selection
Flexibility, cost, quality, delivery and reliability
4 Suppliers should be treated as a part of core
manufacturing process Quality, delivery and reliability 5 A supplier selection highlighting the supply quality and
Based on Table 5, the majority of lean-based operational activities of sourcing are a function of flexibility. Regarding the sourcing context, sourcing flexibility is a vital component of SC flexibility (Vickery et al., 1999; Duclos et al., 2003; Sánchez and Pérez, 2005; Lummus et al., 2005; Kumar et al., 2006). Based on Kumar et al. (2006), it is the capability of the suppliers to control the supply levels (increase or decrease). This process should be done economically and with no extra time (Galankashi et al., 2016a) to satisfy the demand of customers (Galankashi et al., 2016b, 2016c). In the context of this research, almost all activities of Table 5 are related to the flexibility of sourcing. In addition, all activities of Table 6 are related to cost. This can be interpreted as the importance of cost in lean-based pricing of manufacturing companies.
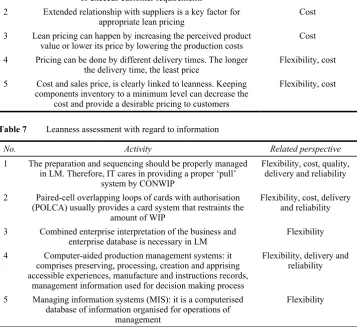
Table 6 Leanness assessment with regard to pricing
No. Activity Related perspective
1 Kaizen costing is a method for ensuring that a product meets
or exceeds customer requirements Cost, quality 2 Extended relationship with suppliers is a key factor for
appropriate lean pricing Cost
3 Lean pricing can happen by increasing the perceived product
value or lower its price by lowering the production costs Cost 4 Pricing can be done by different delivery times. The longer
the delivery time, the least price Flexibility, cost 5 Cost and sales price, is clearly linked to leanness. Keeping
components inventory to a minimum level can decrease the cost and provide a desirable pricing to customers
Flexibility, cost
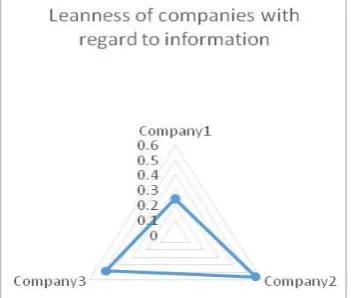
Table 7 Leanness assessment with regard to information
No. Activity Related perspective
1 The preparation and sequencing should be properly managed in LM. Therefore, IT cares in providing a proper ‘pull’
system by CONWIP
Flexibility, cost, quality, delivery and reliability
2 Paired-cell overlapping loops of cards with authorisation (POLCA) usually provides a card system that restraints the
amount of WIP
Flexibility, cost, delivery and reliability
3 Combined enterprise interpretation of the business and
enterprise database is necessary in LM Flexibility 4 Computer-aided production management systems: it
comprises preserving, processing, creation and apprising accessible experiences, manufacture and instructions records,
management information used for decision making process
Flexibility, delivery and reliability
5 Managing information systems (MIS): it is a computerised database of information organised for operations of
management
Flexibility
architectures of information system with the varying information requirements of the business as it satisfies the varying demand of customers. In the context of this research, almost all activities of Table 7 are related to the flexibility of information. Cost, quality, delivery and reliability are other perspectives of lean-based information activities as tabulated in Table 7.
5 Results and discussions
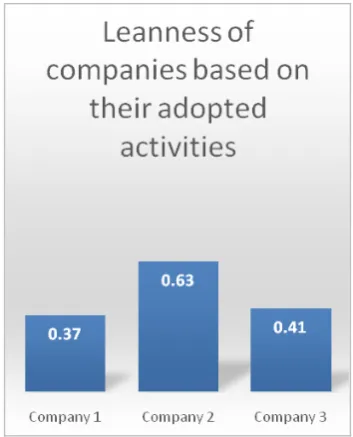
The suggested assessment tool was converted into a questionnaire to be employed for measuring the leanness of three manufacturing companies of automotive industry. This proposed questionnaire comprised 35 questions as the substitutes of suggested lean-based activities tabulated in Tables 1–7. Initially, three manufacturing companies of automotive industry were selected to check the accordance of their activities to the proposed activities of this research. A direct view of the companies was conducted and some interviews were done with their operation managers. The frequency of all activities were determined and divided by their maximum possible score (35 * 5 = 175). Next, the leanness score of each company was determined. In addition, the leanness of each company is calculated based on each SC driver. Figures 2–8 shows the result of this step. As it is shown in Figure 8, company 2 has the highest degree of leanness in comparison with other two companies. Also, company 2 has the best performance with regard to each driver (Figures 2–9). According to an interview with the production manager of this company, their good performance and subsequently the highest leanness score is mainly related to the adoption of just in time (JIT) approach in the company.
Figure 3 Leanness of companies based on facility location related activities (see online version for colours)
Figure 4 Leanness of companies based on inventory related activities (see online version for colours)
Figure 6 Leanness of companies based on sourcing related activities (see online version for colours)
Figure 7 Leanness of companies based on pricing related activities (see online version for colours)
Figure 9 Total leanness of companies based on their adopted activities (see online version for colours)
The proposed approach of this study can be utilised to evaluate a company’s success level in implementing LM in comparison with other similar organisations. Nowadays, several techniques have been developed for this aim. However, these techniques have shortcomings (Azadeh et al., 2015). Based on Narasimhan et al. (2006), empirical investigation and case study analysis can be applied for leanness assessment. In addition, based on Purvis et al. (2014), leanness is affected by different sectors of market. Previous researches on leanness (Seyedhosseini et al., 2011; Azevedo et al., 2012; Azadeh et al., 2015; Zarei et al., 2011; Eroglu and Hofer, 2011) have focused on different research areas including food industry, environment, manufacturing, etc.
6 Conclusions and future research
This study developed a framework to assess the leanness of companies of the automotive industry to answer the research question of assessing leanness from an operational perspective. LM has been discussed in preceding studies but the leanness assessment was less studied. Consequently, to fill this gap, this research was conducted to evaluate the leanness of three manufacturing companies considering diverse drivers of SC. Mainly, three logistic drivers of facility, inventory and transportation in addition to three cross-functional drivers of sourcing, pricing and information were designated as the main elements of SCs. The lean-related activities of each driver were recognised and applied for assessing the leanness of companies. Following, different leanness level of each SC driver was calculated, accordingly. A total leanness index was similarly computed for each company. As a managerial insight, the result of this study can be used to either implementing a LM system or assessing the current leanness of manufacturing companies. As an implication for research, following our previous study, Galankashi and Helmi (2017), this study aimed to show the practical applicability of proposed framework to assess the leanness of manufacturing companies. As another Implication for practice, the results of this study assists managers to focus on total leanness level or only considering their desired SC drivers. In other words, when a manager is interested in improving the leanness of transportation, inventory or any other SC driver, it is possible to focus on that specific area instead of considering total leanness level. However, although this study focused on different drivers of SC, it did not focus on numerous case studies to check its applicability in a bigger scope. This can be interpreted as a limitation of this research. As a direction for future research, the proposed framework of this study can be used in other industries to check its applicability. In addition, the procedure of this study can be repeated for other SC strategies.
References
Abdulmalek, F.A. and Rajgopal, J. (2007) ‘Analyzing the benefits of lean manufacturing and value stream mapping via simulation: a process sector case study’, International Journal of Production Economics, Vol. 107, No. 1, pp.223–236
Angel, M.S. and Manuela, P. (2005) ‘Supply chain flexibility and firm performance’, International Journal of Operations & Production Management, Vol. 25, No. 7.
Azadeh, A., Zarrin, M., Abdollahi, M., Noury, S. and Farahmand, S. (2015) ‘Leanness assessment and optimization by fuzzy cognitive map and multivariate analysis’, Expert Systems with Applications, Vol. 42, No. 15, pp.6050–6064.
Azevedo, S., Carvalho, H. and Cruz-Machado, V. (2013) ‘Using interpretive structural modelling to identify and rank performance measures: an application in the automotive supply chain’,
Baltic Journal of Management, Vol. 8, No. 2, pp.208–230
Azevedo, S.G., Govindan, K., Carvalho, H. and Cruz-Machado, V. (2012) ‘An integrated model to assess the leanness and agility of the automotive industry’, Resources, Conservation and Recycling, Vol. 66, pp.85–94.
Bayou, M.E. and de Korvin, A. (2008) Measuring the leanness of manufacturing systems – a case study of Ford Motor Company and General Motors’, Journal of Engineering and Technology Management, Vol. 25, No. 4, pp.287–304.
Chopra, S. and Meindl, P. (2007) Supply Chain Management: Strategy, Planning & Operation,
pp.265–275, Gabler, Prentice Hall, 552 Seiten, 3. Auflage 2006, ISBN: 0-1317-3042-8. Christopher, M. and Ryals, L. (1999) ‘Supply chain strategy: its impact on shareholder value’, The
International Journal of Logistics Management, Vol. 10, No. 1, pp.1–10.
Christopher, M. and Towill, D.R. (2000) ‘Supply chain migration from lean and functional to agile and customised’, Supply Chain Management: An International Journal, Vol. 5, No. 4,
pp.206–213.
Christopher, M. and Towill, D.R. (2002) ‘Developing market specific supply chain strategies’, The International Journal of Logistics Management, Vol. 13, No. 1, pp.1–14.
Curkovic, S. and Sroufe, R. (2011) ‘Using ISO 14001 to promote a sustainable supply chain strategy’, Business Strategy and the Environment, Vol. 20, No. 2, pp.71–93.
Demeter, K. and Matyusz, Z. (2011) ‘The impact of lean practices on inventory turnover’,
International Journal of Production Economics, Vol. 133, No. 1, pp.154–163.
Duclos, L.K., Vokurka, R.J. and Lummus, R.R. (2003) ‘A conceptual model of supply chain flexibility’, Industrial Management & Data Systems, Vol. 103, No. 6, pp.446–456.
Eroglu, C. and Hofer, C. (2011) ‘Lean, leaner, too lean? The inventory-performance link revisited’,
Journal of Operations Management, Vol. 29, No. 4, pp.356–369.
Fawcett, S.E., Ellram, L.M. and Ogden, J.A. (2014) Supply Chain Management: From Vision to Implementation, Pearson, London.
Frazelle, E. (2002) Supply Chain Strategy: The Logistics of Supply Chain Management, McGrraw
Hill, New York, NY.
Galankashi, M. and Helmi, S.A. (2016) “Assessment of hybrid lean-agile (leagile) supply chain strategies’, Journal of Manufacturing Technology Management, Vol. 27, No. 4, pp.470–482.
Galankashi, M.R. and Helmi, S.A. (2017) ‘Assessment of lean manufacturing practices: an operational perspective’, Int. J. Services and Operations Management, Vol. 28, No. 2,
pp.163–185.
Galankashi, M.R., Helmi, S.A. and Hashemzahi, P. (2016a) ‘Supplier selection in automobile industry: a mixed balanced scorecard–fuzzy AHP approach’, Alexandria Engineering Journal,
Vol. 55, No. 1, pp.93–100.
Galankashi, M.R., Hisjam, M. and Helmi, S.A. (2016b) ‘Agile supplier selection: a fuzzy analytic hierarchy process (FAHP) approach’, in Proceedings of the Sixth International Conference on Industrial Engineering and Operations Management (IEOM), Kuala Lumpur, March.
Galankashi, M.R., Hisjam, M. and Helmi, S.A. (2016c) ‘Lean supplier selection: a data envelopment analysis (DEA) approach’, in Proceedings of the Sixth International Conference on Industrial Engineering and Operations Management (IEOM), Kuala Lumpur, March.
Galankashi, M.R., Moazzami, A., Madadi, N., Roudsari, A.H. and Helmi, S.A. (2013a) ‘Supplier selection for electrical manufacturing companies based on different supply chain strategies’,
HCTL Open International Journal of Technology Innovations and Research, Special edition
on advanced technique of estimation applications in electrical engineering, June, pp.10–22, ISSN: 2321-1814, ISBN: 978-1-62776-478-0.
Galankashi, M.R., Ziaei, F., Helmi, S.A. and Baniani, A.M. (2013b) ‘Assessment of supply chain strategies and analysis on the performance of companies deployed strategy using activity based approach’, Sains Humanika, Vol. 64, No. 2, pp.38–42.
Gunasekaran, A., Patel, C. and McGaughey, R.E. (2004) ‘A framework for supply chain performance measurement’, International Journal of Production Economics, Vol. 87, No. 3,
pp.333–347.
Hatefi, S.M. and Torabi, S.A. (2010) ‘A common weight MCDA–DEA approach to construct composite indicators’, Ecological Economics, Vol. 70, No. 1, pp.114–120.
Houshmand, M. and Jamshidnezhad, B. (2006) ‘An extended model of design process of lean production systems by means of process variables’, Robotics and Computer-Integrated Manufacturing, Vol. 22, No. 1, pp.1–16.
Husby, P. and Swartwood, D. (2009) Fix your Supply Chain: How to Create a Sustainable Lean Improvement Roadmap, CRC Press, USA.
Iravani, S.M.R., Kolfal, B. and Van Oyen, M.P. (2009) Comparing Process Flexibility with Inventory Flexibility via Product Substitution, Submitted for publication.
Kumar, V., Fantazy, K.A., Kumar, U. and Boyle, T.A. (2006) ‘Implementation and management framework for supply chain flexibility’, Journal of Enterprise Information Management, Vol.
19, No. 3, pp.303–319.
Lummus, R.R., Vokurka, R.J. and Duclos, L.K. (2005) ‘Delphi study on supply chain flexibility’,
International Journal of Production Research, Vol. 43, No. 13, pp.2687–2708.
Manrodt, K.B., Vitasek, K.L. and Thompson, R.H. (2008) ‘The lean journey’, Logistics Management, Vol. 47, No. 4, pp.35–38.
Melton, T. (2005) ‘The benefits of lean manufacturing: what lean thinking has to offer the process industries’, Chemical Engineering Research and Design, Vol. 83, No. 6, pp.662–673.
Mohammed, I.R., Shankar, R. and Banwet, D.K. (2008) ‘Creating flex-lean-agile value chain by outsourcing: an ISM-based interventional roadmap’, Business Process Management Journal,
Vol. 14, No. 3, pp.338–389.
Narasimhan, R., Swink, M. and Kim, S.W. (2006) ‘Disentangling leanness and agility: an empirical investigation’, Journal of Operations Management, Vol. 24, No. 5, pp.440–457.
Narayanamurthy, G., Narayanamurthy, G., Gurumurthy, A. and Gurumurthy, A. (2016a) ‘Leanness assessment: a literature review’, International Journal of Operations & Production Management, Vol. 36, No. 10, pp.1115–1160.
Narayanamurthy, G., Narayanamurthy, G., Gurumurthy, A. and Gurumurthy, A. (2016b) ‘Systemic leanness: an index for facilitating continuous improvement of lean implementation’, Journal of Manufacturing Technology Management, Vol. 27, No. 8, pp.1014–1053.
Parveen, M., Rao, T.V.V.L.N. (2009) ‘An integrated approach to design and analysis of lean manufacturing system: a perspective of lean supply chain’, International Journal of Services and Operations Management, Vol. 5, No. 2, pp.175–208
Petersen, K. and Wohlin, C. (2010) ‘Software process improvement through the lean measurement (SPI-LEAM) method’, Journal of systems and software, Vol. 83, No. 7, pp.1275–1287
Plenert, G. (2010) Reinventing Lean: Introducing Lean Management into the Supply Chain,
Butterworth-Heinemann.
Purvis, L., Gosling, J. and Naim, M.M. (2014) ‘The development of a lean, agile and leagile supply network taxonomy based on differing types of flexibility’, International Journal of Production Economics, Vol. 151, pp.100–111.
Qi, Y., Boyer, K.K. and Zhao, X. (2009) ‘Supply chain strategy, product characteristics, and performance impact: evidence from Chinese manufacturers’, Decision Sciences, Vol. 40, No.
4, pp.667–695.
Sánchez, A.M. and Pérez, M.P. (2005) ‘Supply chain flexibility and firm performance: a conceptual model and empirical study in the automotive industry’, International Journal of Operations & Production Management, Vol. 25, No. 7, pp.681–700.
Saurin, T.A. and Ferreira, C.F. (2009) ‘The impacts of lean production on working conditions: a case study of a harvester assembly line in Brazil’, International Journal of Industrial Ergonomics, Vol. 39, No. 2, pp.403–412
Scherrer-Rathje, M., Boyle, T. A. and Deflorin, P. (2009) ‘Lean, take two! Reflections from the second attempt at lean implementation’, Business Horizons, Vol. 52, No. 1, pp.79–88.
Seferlis, P. and Giannelos, N.F. (2004) ‘A two-layered optimisation-based control strategy for multi-echelon supply chain networks’, Computers & Chemical Engineering, Vol. 28, No. 5,
Seyedhosseini, S.M., Taleghani, A.E., Bakhsha, A. and Partovi, S. (2011) ‘Extracting leanness criteria by employing the concept of balanced scorecard’, Expert Systems with Applications,
Vol. 38, No. 8, pp.10454–10461
Shah, R. and Ward, P.T. (2003) ‘Lean manufacturing: context, practice bundles, and performance’,
Journal of Operations Management, Vol. 21, No. 2, pp.129–149.
Si, Y.W., Edmond, D., Dumas, M. and Chong, C.U. (2008) ‘Strategies in supply chain management for the trading agent competition’, Electronic Commerce Research and Applications, Vol. 6,
No. 4, pp.369–382.
Simchi-Levi, D., Kaminsky, P. and Simchi-Levi, E. (2004) Managing the Supply Chain: The Definitive Guide for the Business Professional, McGraw-Hill Companies, USA.
Singh, B., Garg, S.K., Sharma, S.K. and Grewal, C. (2010) ‘Lean implementation and its benefits to production industry’, International Journal of Lean Six Sigma, Vol. 1, No. 2, pp.157–168.
Slack, N. (1983) ‘Flexibility as a manufacturing objective’, International Journal of Operations & Production Management, Vol. 3, No. 3, pp.4–13.
Soleimaninanadegany, A., Hassan, A. and Galankashi, M.R. (2017) ‘Product allocation of warehousing and cross docking: a genetic algorithm approach’, International Journal of Services and Operations Management, Vol. 27, No. 2, pp.239–261.
Soriano-Meier, H. and Forrester, P.L. (2002) ‘A model for evaluating the degree of leanness of manufacturing firms’, Integrated Manufacturing Systems, Vol. 13, No. 2, pp.104–109.
Srinivasaraghavan, J. and Allada, V. (2006) ‘Application of mahalanobis distance as a lean assessment metric’, The International Journal of Advanced Manufacturing Technology, Vol.
29, Nos. 11–12, pp.1159–1168.
Stevenson, M. and Spring, M. (2007) ‘Flexibility from a supply chain perspective: definition and review’, International Journal of Operations & Production Management, Vol. 27, No. 7,
pp.685–713.
Swamidass, P.M. (2007) ‘The effect of TPS on US manufacturing during 1981–1998: inventory increased or decreased as a function of plant performance’, International Journal of Production Research, Vol. 45, No. 16, pp.3763–3778.
Thomas, D.J. and Griffin, P.M. (1996) ‘Coordinated supply chain management’, European Journal of Operational Research, Vol. 94, No. 1, pp.1–15.
Upton, D.M. (1995) ‘Flexibility as process mobility: the management of plant capabilities for quick response manufacturing’, Journal of Operations Management, Vol. 12, No. 3, pp.205–224.
Vickery, S., Dröge, C. and Germain, R. (1999) ‘The relationship between product customization and organizational structure’, Journal of Operations Management, Vol. 17, No. 4,
pp.377–391.
Vickery, S.K., Jayaram, J., Droge, C. and Calantone, R. (2003) ‘The effects of an integrative supply chain strategy on customer service and financial performance: an analysis of direct versus indirect relationships’, Journal of Operations Management, Vol. 21, No. 5, pp.523–539.
Vimal, K.E.K. and Vinodh, S. (2012) ‘Leanness evaluation using IF–THEN rules’, The International Journal of Advanced Manufacturing Technology, Vol. 63, Nos. 1–4,
pp.407–413.
Vimal, K.E.K. and Vinodh, S. (2013) ‘Application of artificial neural network for fuzzy logic based leanness assessment’, Journal of Manufacturing Technology Management, Vol. 24, No. 2,
pp.274–292.
Wan, H. and Chen, F. (2006) ‘An application of slacks-based measure on quantifying leanness’,
Annual Industrial Engineering Research Conference, May, pp.20–24.
Wan, H.D. and Chen, F.F. (2008). A leanness measure of manufacturing systems for quantifying impacts of lean initiatives, International Journal of Production Research, VOl. 46, No. 23,
Wieland, A. and Wallenburg, C.M. (2012) ‘Dealing with supply chain risks: linking risk management practices and strategies to performance’, International Journal of Physical Distribution & Logistics Management, Vol. 42, No. 10, pp.887–905.
Zarei, M., Fakhrzad, M. and Paghaleh, M.J. (2011) ‘Food supply chain leanness using a developed QFD model’, Journal of Food Engineering, Vol. 102, No. 1, pp.25–33.
Ziaei, F., Baniani, A.M., Galankashi, M.R., Ghashami, S.S. and Nargesi, Z.R. (2013) ‘Application of minimax, minsum and analytical hierarchy process for facility location problem’,