ADB’s Role on Recent Poverty Alleviation in Indonesia
1 (Peran ADB dalam Penanggulangan Kemiskinan di Indonesia Masa Kini)By Ivanovich Agusta2
ABSTRACT
At the time when a poverty alleviation agenda has not been adopted on 1980s, the Asian Development Bank (ADB)’s projects have addressed as well as given impacts to the poor –as beneficiaries—significantly. This fact indicates that an international agenda on poverty alleviation will not be too difficult to be implemented in the future. Unfortunately, in the donor’s point of view, poverty is seemed as a homogenous entity. On the contrary, the Study finds that the poverty tends to be a heterogeneous entity, so that the projects should address the beneficiaries more precisely on their own category about the poor, and be suitable towards different social contexts. Meanwhile, there have been many projects delivered to the poor, so that a “project approach” becomes a significant prime mover to the poor and their communities. It is important to be noted that, unlike “bureaucratic approach”, the “project approach” comes flashy as its natural, so that it implicates on an important thing to work with the poor to prepare and to improve their capabilities themselves for receiving the flashy projects. The poor should be considered as an important stakeholder, so that they must be incorporated in the project. The Study indicates also that it had better to use multi-discipline methods –to grasp overall aspects— on a project (development) evaluation, and to involve the beneficiaries themselves to rate all of the project dimensions together with the researcher. The contextual projects should be supported by qualitative and participatory methodologies, instead of a quantitative methodology. The two former methodologies are able to open facts of social stratification and social structure, and move the people capacity to empower themselves. These methodologies implicate on partnering NGOs to deliver the projects, as well as partnering academicians consultation
Keywords : heterogenous poverty, project approach, multidisipline methods
ABSTRAK
Pada saat agenda penanggulangan kemiskinan belum diadopsi pada tahun 1980-an, proyek-proyek Asian Development Bank (ADB) telah dialamatkan dan memberikan impak kepada penduduk miskin (sebagai pemanfaat) secara signifikan. Fakta-fakta yang ada menunjukkan bahwa sesungguhnya agenda penanggulangan kemiskinan tidak akan terlalu sulit untuk diterapkan di masa depan. Sayangnya, dalam pandangan donor, kemiskinan terlihat sebagai entitas tunggal. Sebaliknya, studi ini menemukan bahwa
1 A revised paper presented on The XVth International Sociological Association (ISA) World Congress of Sociology, Brisbanne, Australia, 7-13 July 2002. The paper is based on my report on Special Special Evaluation Study on Poverty Reduction: A Comparative Assessment between Successful and Unsuccessful Projects (ADB, 2001). I thank Prof. Dr. Mayling Oey-Gardiner for her critics and comments during doing the Study.
2 Lecturer of Department of Agricultural Sosio-Economics, Faculty of Agriculture, Bogor Agricultural University, Indonesia. Postal address: Perumahan Ciampea Asri, Jl. Kladion A6/18, Warung Borong, Ciampea, Bogor, Indonesia 16620. Phone/facs: +62-251-628288. E-mail:
kemiskinan cenderung sebagai entitas jamak, sehingga proyek-proyek seharusnya mengarahkan pemanfaat secara lebih persis pada kategori kemiskinan mereka sendiri, dan lebih cocok untuk konteks-konteks yang berbeda. Sementara itu, ada banyak proyek yang disampaikan kepada penduduk miskin, sehingga “pendekatan proyek” menjadi signifikan sebagai penggerak perubahan penduduk miskin dan komunitasnya. Penting untuk dicatat, tidak seperti “pendekatan birokratis”, “pendekatan proyek” memiliki sifat selintas, sehingga menjadi penting untuk menyiapkan penduduk miskin agar siap dan memiliki kemampuan untuk menerima proyek. Penduduk miskin harus dipandang sebagai pihak yang sangat penting, sehingga mereka disertakan dalam proyek ini. Studi ini juga menunjukkan, bahwa lebih baik menggunakan multi-disiplin (untuk menggali selruuh aspek kemiskinan) pada evaluasi proyek (pembangunan), dan memberi kesempatan kepada pemanfaat untuk bersama-sama peneliti memberi ranking terhadap selruuh dimensi proyek. Proyek yang kontekstual sebaiknya juga melibatkan penelitian kualitatif dan partisipatoris, di samping metodologi kuantitatif. Dua metode sebelumnya mampu membuka stratifikasi sosial dan struktur sosial, serta mampu menggerakkan kemampuan masyarakat untuk memberayakan dirinya sendiri. Metode semacam ini berimplikasi kepada kebutuhan partner LSM dan akademisi untuk melancarkan proyek.
1. BACKGROUND AND RATIONALE
In Indonesia, a keyword development is best interpreted as projects operation.
Since 1969 of New Order era, development of agriculture and infrastructure have been dominated by project loans. A study of the projects –as an implication—is able to be used to describe the national development. In a project-patterned development, international donors become an important stake holder. If we agree that a bottom objective of development is to alleviate poverty, then creating linkage between the donors and the poor become critical.
One of the donor, The Asian Development Bank (ADB), formally adopted poverty reduction as one of its five strategic development objectives (SDOs) in its first Medium-Term Strategic Framework 1992-1995. ADB intends to integrate poverty reduction concerns into various stages of its work. In early 1999, poverty reduction was declared as the overarching goal of ADB, and the Poverty Reduction Strategy was approved later that year (ADB, 1999a). ADB’s long-term strategic framework (2001-2015), which builds upon the poverty reduction strategy, provides the vision of ADB, its long-term strategic goals and its fundamental operating principles, and ensures that all activities are integrated and directed towards its overarching goal of reducing poverty (ADB, 2001). This Study provides information on how best to address poverty reduction objectives as gleaned from the lessons of past projects.
For Indonesia, stable economic growth and investment of considerable resources in rural areas and agriculture are key factors in declining poverty during the past twenty years of national development (Collier, et.al., 1996; Manning, 1999; Sajogyo, 1997).
1990s albeit at a slower rate. In the decade between mid-1970s and mid-1980s, rapid agricultural growth was the driving force behind growth and poverty reduction in Indonesia. The engine of growth and poverty reduction has changed since the mid-1980s, with manufacturing and services taking on a much more important role. As an implication, from 1976 to 1996 poverty has declined dramatically. In just two decades, the rate of poverty has come down from 40 percent to just over 11 percent, and in terms of absolute numbers there occurred a decline from 54 million to 23 million people.3
Indonesia’ fortunes reversed in 1997 with the onset of the financial and banking sector crisis, which was preceded by the Él Nino draught disrupting harvests and causing disruption of supplies of basic foods. The financial crisis quickly spilled over into the real sector. Negative growth occurred in most sectors. Substantial falls in value added occurred in construction, banking and finance, and manufacturing. High inflation in the order of 80 percent in 1998 and the contraction in the real sector activities resulted in both a sharp fall in real wages and a decline in wage employment across many sectors (Hendytio, 1999).
The crisis affected everybody, not just the poor but also the rich, and maybe worst hit were the middle class. Thus while the income share of the poorest 40 percent of the population remained fairly constant over time from before to the height of the crisis and more recently, initially the top 20 percent gained a larger share, to then decline as the crisis continued, basically at the cost to changing income shares attributed to the middle class. This reflects the challenges to be faced in efforts to reduce poverty and reduce income gaps between the rich and the poor. This also shows that the poverty problem is a structural problem hence economic changes followed by social and political changes occurring since the economic crisis have not much affected the conditions of the poorest 40 percent of the population.
Such structural poverty is usually a consequence of politics which is not fair to the poor (Dreze and Sen, 1989). In Indonesia, the “top-down” command structure of the Indonesian government during the last twenty years is less well suited to providing more differentiated and higher quality services for the poor as countries develops (Manning, 1999). Poverty inhibits the capacity of the poor to participate in developing their communities (Sajogyo, 1977). The political structure is matched with a paternalistic pattern in local culture (Mulder, 2000, 2001). Meanwhile, corruption in the government is widespread permeating throughout the cultural fabric (Filmer and Lindauer, 2001), as
bureaucrats are tightly linked to the capitalists or better known as conglomerates (Robison 1988). Efforts from the bureaucrats themselves, outsiders (i.e. World Bank dan IMF), the press, and the reformers to deter corruption have so far been ineffective (Hamilton-Hart, 2001). The legal system is in shambles, said to be part of the problem.
In the meantime of crisis, Indonesia adopted a shift in governance from high centralized to decentralized decision making in regional autonomy. Theoretically and ideally this move toward decentralization has been regarded as the promise and delivery of solutions to the problems of poverty through poverty reduction strategies (Alm, Aten and Bahl, 2001; Nombo, 2000; Sumodiningrat, 2001). The fact of the matter is, however, that decentralization is not a sufficient condition to better implement poverty reduction strategies as there are many more hurdles to overcome. These hurdles include for instance, poor quality of local level human resources who have to still have to learn and adjust to different delivery modes of services to stakeholders, absence of a proper bureaucracy and administrative system, possibly poor unfriendly cultural, religious and traditional norms and values, and maybe most important, most regions have very limited financial resources on (Agusta, 2001; Asfar, 1996; Kalloh, 1996; Spyckerelle and Ferrazzi, 1996; Sumardjan et. al. 1996; Suradinata, 1995; and Surbakti, 1996).
There are two patterns of poverty reduction policies. First, ad hoc and short term
crash programs to deal with poverty alleviation. These are usually poorly designed with minimum consideration for long-term effects, often dominated by the government apparatus or the local elite, like for instance the Social Safety Net Program. This often causes failure of such programs. Second, properly planned programs which include
medium- and long-term plans, are more likely to involve the community, like the IDT (Inpres Desa Tertinggal or less developed villages program) and PPK (Kecamatan
/Sub-district Development Project). Such programs are more likely to succeed. Such programs have led to independent community/social movements to maintain and even further develop projects, often referred to as community empowerment. Such movements, particularly among the poor, suggest that there is room for overcoming the above mentioned structural poverty.
Nevertheless, it is still difficult to reach poor beneficiaries, as shown by the constant share of income accrued to the poor. Only those projects based on community participation and community empowerment –operationalisation of linkages between the donors and the poor—may possibly contribute to alleviation of structural poverty.
2. OBJECTIVES
The Study aims to:
(ii) identify why certain the projects with poverty reduction as the primary or secondary objectives were successful while others were not;
(iii) construct a framework on creating linkages between international donors and the poor
3. METHODOLOGY
The Study is limited to the agriculture and social infrastructure sectors which account for half of all ADB projects. Twenty four projects that were rated successful (GS) or unsuccessful (US) in documents of Appraisal Reports (AR), Project Performance Audit Reports (PPARs) and Project Completion Report (PCRs) are included in the desk study. Seventeen projects were rated generally successful and seven projects were rated unsuccessful. Of these, around six successful projects and three unsuccessful projects were subjected to in-depth assessment (through surveys, in-dept interviews, participatory observations and focus group discussions) conducted in sixteen districts in Java, Sumatera, and Lombok islands. The projects’ primary or secondary objectives of poverty reduction, and their ratings in PCRs and PPARs are the criteria for selection for inclusion in the study.
This study was completed over a total period of eight months, including 5 weeks for field work carried out in 2 phases (to also cover more recently completed projects), and the remaining for conducting the desk study, data processing, and report writing. For Phase II a number of questions were added. In general the questionnaires are found to be well-designed for communities in rural areas and urban areas. Special questionnaires were designed for students and teachers of the Agricultural Technology School Project . All together the survey collected information from 2,528 respondents, 1,777 or 70 percent live in Generally Successful (GS) projects and 751 or 30 percent in Unsuccessful (US) projects.
To complement the quantitative survey, focus group discussions (FGDs), in-depth interviews, and participatory observations —qualitative research tools— were also employed separately for the beneficiaries in each of the research sites. FGDs were held with beneficiaries, while in-depth interviews were conducted with officials of relevant government agencies and beneficiaries. Secondary research on published statistics and related studies of research sites were also undertaken.
transition towards democracy. At the same time the ADB also changed its orientation towards a more participatory approach in projects management. Meanwhile all of the projects being evaluated under this study were designed and executed prior to the introduction of the change in the ADB paradigm.
The age of the projects being evaluated in this study affect what the beneficiaries remember about it as in a number of cases other projects have also entered their locality. Unfortunately, the poorest people have no information or are unaware about many projects in their respective communities. It was difficult for some respondents to recall possible impacts of some of the projects being studied and also to separate the impact of the particular project under study from other projects.
Then the analysis is based on an awareness that many projects come down to the community. In old projects, most of projects’ personnel have been changed, making it difficult to meet with officers who were in charge during implementation of the studied projects. Moreover as administration and filing is a weakness in the bureaucracy, it has been difficult to obtain documentation on the projects from the current officers. And, as some of the studied projects did not have poverty reduction as a primary objective, it was difficult to obtain information on that particular issue.
Most respondents are between 31 and 50 years old (1,714 or 68 percent). About one-third are female.
The selected respondents live in households that have been in the project sites for a long time. Except for about 5 percent, all others have lived in the project sites for more than 10 years and three-fourths have lived in the project sites for more than 20 years. Respondents from generally successful projects live in households that have been in the area for a longer time than those from unsuccessful projects. Most of the respondents in GS project sites, 83 percent, live in households that have been in the respective areas for more than 20 years while among respondents in US projects the comparable percentage is only 59 percent. Difference in duration of stay in project site suggest differential benefits received during the various stages of project implementation.
Most of the respondents, in fact, around half, are skilled agricultural or fishery workers. This is true during project implementation as well as at the time of the survey. While the composition of sources of livelihood hardly changed among respondents in GS sites, slight changes were experienced by respondents in US sites. An interesting observation worth making is that about 12 percent of respondents in GS sites claim to have been unemployed during implementation of the project but that share has declined significantly to only 5 percent during the survey.
percent per annum. This trend was, however, disrupted by the devastating economic crisis not only hit the rich but especially the poor. In the project areas poverty became more widespread. Thus for instance, the share of households living on less than $30 a month (or $1 a day) initially declined from the time of project implementation to 1997, from 34 percent to 7 percent overall. Among households living in GS project areas the decline was from 34 percent to 5 percent and in US projects from 30 percent to 17 percent. from pre- to during the crisis both in GS as well as US project sites, reflecting how successful projects benefited the poor more than unsuccessful projects.
Since then the situation has worsened for the people living in the selected project areas, and their economic conditions are still worse than they were before the crisis. The proportion of households living on about US$1 a day or US$30 a month has risen significantly from the pre-crisis situation in 1997 to 2001 at the time of the survey. Overall the share of studied households living at less than or equal to US$1 a day was up to around 40 percent overall, 32 percent among households living in GS project areas, and 58 percent of households living in unsuccessful project sites. These findings are consistent with the macro scene of real incomes falling sharply and even though the economy has performed slightly better during the last 2 years, current conditions have not yet returned to the situation before the crisis. These results suggest the depth of poverty resulting from the crisis.
4. ADB ASSISTANCE FOR POVERTY REDUCTION
The projects studied here include the two sectors of agriculture and social infrastructure. The agriculture sector projects include such sub-sectors as industrial crops and agro-industry, fisheries, irrigation and rural development, livestock, forestry, and agricultural support services. There is also a fertilizer need assessment in agricultural support services projects. Meanwhile, the social infrastructure sector includes the following sub-sectors: urban development and housing, and education. There are need assessments of water supply and sanitation, and health and population items in the urban development and housing sub sector.
Most of the unsuccessful (US) projects are slightly older than generally successful (GS) projects. On average US projects were completed about 11 years ago and GS projects about 9 years ago. Compared to the time of completion of the PPARs to the present, on average GS were completed some 6 years ago while US projects almost 9 years ago. This time difference suggest improvements in project design and management resulting in better or GS projects. On the other hand, duration between project completion and PPARs is on average one year longer for GS projects, or 3 years for GS and only 2 years for US projects, suggesting differences in dealing with GS or US projects and therefore PPAR preparations in relation to project completion.
There appears some basic differences in the financial and processing characteristics between GS and US projects. The differences start even as early as at appraisal, implying that these differences may well have contributed to the success or failure of the selected projects. All together the 24 reviewed projects are worth US$2.3 billion at appraisal but the actual cost was instead $1.9 billion (Table 1). Luckily most of the investment, 83 percent or US$2 billion was budgeted for GS projects at appraisal, while the remaining 17 percent or US$391 thousand were allocated to the US projects. The actual cost composition became only slightly more favorable toward GS projects, which absorbed 86 percent or US$1.7 billion, while the remaining US$271 thousand or 14 percent was used for US project. Part of the difference in the total actual cost is due to discontinuation of the US projects which had difficulties in implementation. Hence not surprising US are much smaller, at an average cost of US$39 million as compared to an average of US$98 million for GS projects.
Table 1. Basic Project Data
I tem Appraisal Actual
All GS US All GS US
Number of projects 24 17 7 Total Cost 2,346.9 1,956.0 390.9 1,941.5 1,670.2 271.3 Average cost per project 97.8 115.1 55.8 80.9 98.2 38.8 Total Loan 1,605 1,325.3 279.7 1,445.4 1,259.6 185.8 Percent net loan to total cost 57 60 41 69 71 59 Average processing time 7.4 8.4 5.1 Average No. of missions per project 17.1 16.4 18.9 Average person-days per project 354 345 375 Average person-days/ mission/ project 21 21 20 Notes : GS = Generally Successful projects; US = Unsuccessful projects
Sources : Selected project documents
GS projects, interestingly in both cases rising to 71 percent actually for GS projects and 59 percent for US projects. These are significant differences and suggest the need for further investigation as to the causes for such substantial differences in the share of loans to total project cost between actual and appraised amounts of GS and US projects.
Even more striking is, however, the processing time. While it took on average 8.4 months for a GS project from fact finding to loan approval, it took on average only almost 5.1 months for the US project to achieve the same approval status. Hence the question as to whether processing time is a function of differences in average project value or actual project preparation. If the latter is the case then serious consideration should be given to proper preparation time thereby avoiding possible future project failures.
Another interesting differentiating indicator concerns the number of missions. More missions were fielded for US than GS projects. On average 19 mission were fielded for US projects as opposed to 16 missions for GS projects. And, as the average number of person days per mission per projects were fairly similar at 20 for US and 21 for GS projects, the average number of person days per project was higher for US than GS projects, 375 and 345 person-days per project for US and GS projects respectively.
A number of general observations can be made as to whether the studied projects addressed poverty reduction. Even though the studied projects were not designed with a primary objective of poverty reduction, all projects have addressed at least one of the dimensions of poverty identified for desk evaluation, which include economic and social dimensions (Table 2). Slightly less universal, 15 out of 17 projects in the case of successful projects but all 7 unsuccessful projects, address the need for capital, assets, or tools for livelihood.
Table 2. Dimensions of Poverty Addressed by the Projects
Dimensions of Poverty GS US
Number % Number %
Lack of income/ employment opportunities 17 100 7 100 Lack of capital/ assets/ tools for livelihood 15 88 7 100 Lack of basic needs
– food 6 35 1 14
– clothing - - - -
– shelter 6 35 1 14
– education 4 24 1 14
– health services 6 35 1 14
– water supply 11 65 1 14
– electricity 2 12 1 14
Geographic isolation (lack of access to roads, transport,
communication) 4 24 2 29
Vulnerability (to natural calamities, crimes, crises, etc) 9 53 2 29 Social inferiority (gender, caste, ethnic group, etc.) 7 41 1 14 Notes : One (1) project may address several dimensions of poverty)
On the other hand, however, the issue of poverty has been dealt with mostly in regards to economic poverty and less so with the social dimensions of poverty. The unsuccessful projects were even less likely to have addressed social dimensions of poverty reduction. In regards to lack of basic needs, about one-third of the generally successful projects addressed the lack of food, shelter, and health services, while in the case of unsuccessful projects only 1 out of 7 did so. Education had less priority as only 5 projects, of which 4 are GS projects, addressed this concern and only 3, of which 2 are GS projects, addressed the lack of electricity. A far greater number also addressed the lack of water supply, 12 altogether of which 11 are GS projects, suggesting that water shortage has had a longer history and importance in ADB development priorities. Noticeably, none of the projects addressed the lack of clothing as an objective, suggesting that clothing is not regarded as a poverty reduction or development strategy.
Another highly valued development initiative is breaking down geographic isolation, including access roads, transport and communication. Yet only 6 projects or one-fourth of all 24 projects, of which 4 are GS and 2 US project, addressed this highly desired development component.4 On the other hand, around half the projects addressed issues of vulnerability, to natural calamities, crime, crises, etc., and social inferiority of gender, caste, ethnic group, etc. This suggest that some projects were designed to respond to such issues rather than taking a long-term development perspective.
5. PROJECTS’ IMPACT ON POVERTY REDUCTION
The findings suggest consistency in assessments by different people. Those projects judged as generally successful in PCRs and PPARs are similarly assessed by both researchers evaluating those earlier reports as well as supported by opinions from beneficiaries in and around the project areas. On practically all counts of assessments, GS scored higher than US projects.
GS projects have more likely contributed to poverty reduction compared to US projects. The general consensus is that poverty reduction in the projects have been achieved primarily through employment generation and enhanced income opportunities and that GS have done better in achieving this objective than US projects. These are economic criteria, which are a necessary factor in explaining conditions of the poor these criteria are not the only factors affecting the lives of the poor.
On the social side the assessments have not been as favorable. Fewer projects addressed the social needs of people and particularly poor people. For instance access to services and infrastructure or the ability of beneficiaries to participate in social and political live has not been sufficiently addressed. Worse even are the projects’ concerns about
addressing the needs of women and concerns for environmental protection. It appears that many of these projects were still designed with paying only lip-service to these very important aspects of development and of poverty reduction endeavors.
5.1. Impacts on ADB’s Point of View
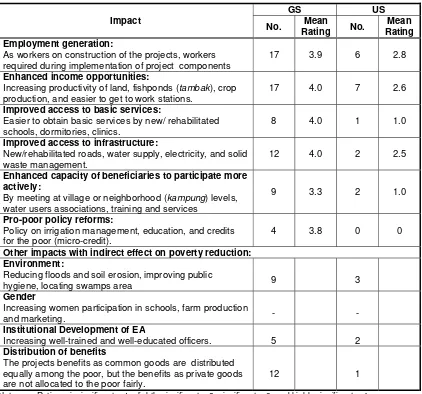
We turn to the results of ADB Officers’ assessments on development impacts of the 24 projects for desk-study. Generally successful projects are more likely to have been identified as having had development impacts according to ADB officers. Besides, the impacts are of better quality as indicated by higher ratings: 1 being insignificant, 2 slightly significant, 3 significant and 4 highly significant, which were done by the research team
Table 3).
Table 3. Project Development Impacts Based on ADB Officers Opinion
Impact
As workers on construction of the projects, workers
required during implementation of project components 17 3.9 6 2.8 Enhanced income opportunities:
Increasing productivity of land, fishponds (tambak), crop production, and easier to get to work stations.
17 4.0 7 2.6
Improved access to basic services:
Easier to obtain basic services by new/ rehabilitated
schools, dormitories, clinics. 8 4.0 1 1.0
Improved access to infrastructure:
New/rehabilitated roads, water supply, electricity, and solid
waste management. 12 4.0 2 2.5
Enhanced capacity of beneficiaries to participate more actively:
By meeting at village or neighborhood (kampung) levels, water users associations, training and services
9 3.3 2 1.0
Pro-poor policy reforms:
Policy on irrigation management, education, and credits
for the poor (micro-credit). 4 3.8 0 0
Other impacts with indirect effect on poverty reduction: Environment:
Reducing floods and soil erosion, improving public
hygiene, locating swamps area 9 3
Gender
Increasing women participation in schools, farm production
and marketing. - -
Institutional Development of EA
Increasing well-trained and well-educated officers. 5 2 Distribution of benefits
The projects benefits as common goods are distributed equally among the poor, but the benefits as private goods
are not allocated to the poor fairly. 12 1
The discussion on the desk-top assessments of projects as reported in ARs, PCRs, and PPARs, suggest reasonable consistency between the evaluation of ADB officers and the researcher in classifying GS and US projects. GS projects are more likely to have attended to various aspects of economic and social development of the communities in which the projects are located and also when attending to those aspects, GS projects did so qualitatively better than US projects.
Take the case of items (1) employment generation and (2) enhanced income opportunities. On item (1) 17 out of 17 GS projects claim that employment opportunities were generated by the project with an average score of 3.9, while of the 7 US projects only 6 generated employment and the average score was only 2.8. In regards to item 2, all 17 GS projects resulted in enhanced income opportunities and with an average perfect score of 4.0 while among the 7 US projects, even though all claim to have enhanced income opportunities the average score was only 2.6.
Other items were not as striking. Item (3) improved access to basic services was only identified for 8 out of 17 GS projects and only 1 of 7 US projects. Much more striking are the qualitative differences. In the case of those GS projects which addressed this item, the researchers judged it to have been done very well, giving it an average score of 4.0 for highly significant. US projects, on the other hand, hardly addressed this need as only 1 out of 7 did so and even then, rather poorly with a score of only 1.0 for insignificant.
Similarly, a far greater proportion of GS than US projects improved access to infrastructure and ratings were also far more favorable. Among GS projects 12 out of 17 while among US projects only 2 out of 7 were identified to have improved access to infrastructure. While GS projects are rated as having highly significantly improved conditions, average score of 4.0, the average for the 2 US projects was only 2.5 or only somewhat significant.
A similar pattern is recorded for item (5), enhanced capacity of beneficiaries to participate more actively. Relatively more of the GS projects have attended to this item than US project and the quality of the impact differs significantly.
On the issue of whether projects have attended to pro-poor policy reforms, it appears that this was still hardly attended to by these 24 projects under study as only in 4 GS projects could this item be identified, and done fairly well as rated on average 3.8 or fairly highly significant.
attended to these items of poverty reduction aspects. The most striking is how the gender issue was not at all mentioned in any of the projects, yet gender equity has been on the books for quite some time.
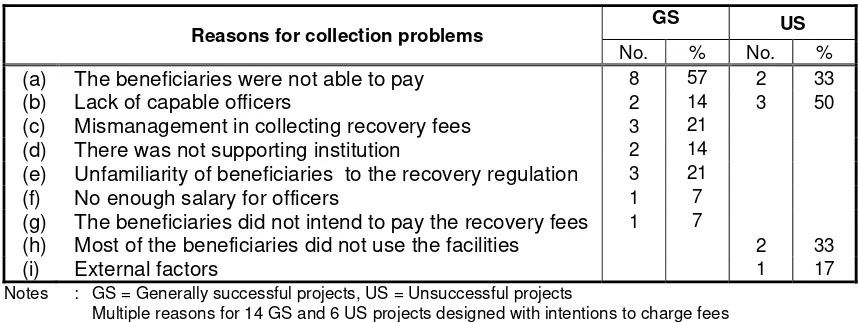
For a purpose of sustainability of benefits, the projects were designed to establish specific institutions among beneficiaries responsible for collecting recovery fees, to manage the fees, pay officers and maintain various project components. Most of the projects subject to desk evaluation, 20 out of 24, were designed with such an intention, consisting of 14 out of 17 GS and 6 of 7 US projects, implying a slightly higher proportion of US projects which were designed for sustainability through collection of users’ fees.
While the general picture appears to be fairly positive in that few projects are plagued with collection problems for maintenance, varying from 1 to 10 of the 20 projects designed with an intention to charge fees, the most frequent mentioned reason was the beneficiaries inability to pay such fees, as mentioned in 8 GS and 2 US projects (Table 4). On the contrary, however, in all of survey sites people say that they are pleased to pay maintenance fees. Beneficiaries of the successful Nusa Tenggara Agricultural Development Project living in the village of Banyu Urip, district of West Lombok, claim to be quite willing to contribute to maintenance, there is no official to collect such fees. Local opinion leaders have proposed establishing a unit for this purpose to local government. Regrettably, however, the government has not reacted. In Karadenan village, district of Bogor, there has been no discussion between local government and beneficiaries of successful Bogor and Palembang Urban Development Project regarding road maintenance (based on interview results).
Table 4. Collection Problems
Reasons for collection problems GS US
No. % No. % (a) The beneficiaries were not able to pay 8 57 2 33
(b) Lack of capable officers 2 14 3 50
(c) Mismanagement in collecting recovery fees 3 21 (d) There was not supporting institution 2 14 (e) Unfamiliarity of beneficiaries to the recovery regulation 3 21 (f) No enough salary for officers 1 7 (g) The beneficiaries did not intend to pay the recovery fees 1 7
(h) Most of the beneficiaries did not use the facilities 2 33
(i) External factors 1 17
Notes : GS = Generally successful projects, US = Unsuccessful projects
Multiple reasons for 14 GS and 6 US projects designed with intentions to charge fees Sources : Selected projects’ documents
unsuccessful Second Brackish-Water Aquaculture Development Project living in the village of Bagan Kuala in the district of Deli Serdang, the province of North Sumatra, who refuse to pay into the fund after failure of the second harvest. Similarly, supposed beneficiaries of the unsuccessful Cibaliung Irrigation Project (Agusta and Tetiani, 2001), who refuse to pay into the fund as they did not get water in their secondary canals.
On the other hand, the beneficiaries are also stakeholders and as stakeholders, they will attempt at maintaining infrastructure on their own, with or without orders or even assistance from the government. Thus for instance, villagers of Banyu Urip in West Lombok, recognize the benefits of the Nusa Tenggara Agriculture Development Project and therefore maintain the water flow by regularly taking out garbage from the canals. At their own initiative they also repair the canals when needed. Beneficiaries of the Botabek Urban Development Project, i.e. villagers of West and East Karangasem in the district of Bogor, West Java, have maintained and rehabilitated most of the project components of roads, drainage, house repairs, and waste disposal sites. The sanitation component, has, however, disappeared as housing has been built on those sites. It is only the Cibaliung Irrigation Project where no repairs have been done. Unfortunately, most of the canals were built lower than the paddy fields. Hence to use the water flowing through these canals, farmers will have to rely on water pumps. Since farmers still have alternative sources of water for their rice fields, they do not rely on this source of water for irrigation. As reconstruction of these canals is far too costly, neither the local farmers nor the government is willing to make the necessary investments.
5.2. Impacts on Beneficiaries Point of View
Not only do the researchers agree with the ADB Officers’ judgments on the quality of the projects, but so do the beneficiaries living around the selected projects sites. Respondents were asked their opinions about possible project benefits and then to rate them in terms of the value of the respective projects.
Table 5. Beneficiaries’ Opinions of Project Benefits (Phase 1 and Phase 2)
2. Enhanced general well-being of the people in terms of:
(a) Access to education 1,452 82 3.14 263 35 2.62 14.946* (b) Access to health services 1,161 65 3.03 230 31 2.67 9.538* (c) Access to safe drinking water 846 48 3.12 174 23 2.49 11.453* (d) Access to housing 1,020 57 3.02 192 26 2.71 6.316*
3. Improved status of women in terms of:
(a) Increased access to education 1,128 63 3.16 146 19 2.51 11.658* (b) Increased literacy 1,077 61 3.21 110 15 2.64 8.849* (c) More women in the workforce 871 49 3.05 458 61 2.81 6.571* (d) Increased participation in livelihood
projects 941 53 3.04 211 28 2.57 9.334* (e) More conveniences in doing
household chores 1,195 67 3.08 223 30 2.69 9.118*
Notes : Information based on eight projects surveyed during the 2 phases, or exclusive of INO-1050, the Agricultural Technology Schools Project
* significant at the 0.01 level (2-tailed)
Ratings: 1= not valuable; 2. slightly valuable; 3. somewhat valuable; and 4. very valuable Source : Special survey of project beneficiaries 2001
At times beneficiaries also had difficulties evaluating the impact of the studied projects because of the age of the selected projects, which in some cases have already been superseded by other projects. Pne example is Cibaliung Irrigation Projects (Box 1).
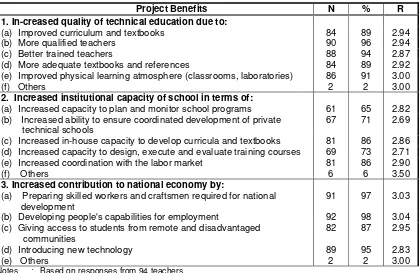
As the types of project benefits ascertained from the Agricultural Technology School Project, the results have been tabulated separately. The survey results for teachers (Table 6) and students (Table 7) show a number of patterns worth noting. First,
respective schools and the benefits they received may not have been what their schools in fact needed.
Box 1. Impact of Other Projects
During construction of the Cibaliung Irrigation project (INO-475), an oil palm nucleus estate project was also being developed in the vicinity. For the use of their land residents of the village of Nanggala, district of Pandeglang, province of Banten, were promised to receive 60 percent of gross revenue while all production costs were to be borne by the nucleus estate.
The response of the villagers to the nucleus estate plans were positive but environmentally devastating and in the long-run having negative effects on the livelihood of especially the poor. The nucleus estate made rapid inroads into the communities and even earlier ‘communal land’, i.e. not private property, was transferred for use by the nucleus estate. This was likely done by local officials who claim use or even ownership of such plots of land. As a result of these land transfers to the oil palm nucleus estate, many villagers lost their only source of livelihood from working on the land, and then turned to the forest where they cut down trees to earn some income.
While as part of the Cibaliung Irrigation project roads were built, these were not designed for heavy traffic. On the other hand, the nucleus estate, which did not invest in road construction, greatly benefited from these roads which they use for their big trucks. Not surprising these trucks destroyed the roads in a short time. While the Cibaliung project roads initially helped breakdown isolation, the nucleus estate destruction of the roads resulted in rising transportation costs, which were further exacerbated by the economic crisis which started in mid-1997.
Agusta and Tetiani field notes
Table 6. Project benefits of the Agricultural School Project according to Teachers
Project Benefits N % R
1. In-creased quality of technical education due to:
(a) Improved curriculum and textbooks 84 89 2.94
(b) More qualified teachers 90 96 2.94
(c) Better trained teachers 88 94 2.87
(d) More adequate textbooks and references 84 89 2.92 (e) Improved physical learning atmosphere (classrooms, laboratories) 86 91 3.00
(f) Others 2 2 3.00
2. Increased institutional capacity of school in terms of:
(a) Increased capacity to plan and monitor school programs 61 65 2.82 (b) Increased ability to ensure coordinated development of private
technical schools 67 71 2.69
(c) Increased in-house capacity to develop curricula and textbooks 81 86 2.86 (d) Increased capacity to design, execute and evaluate training courses 69 73 2.71 (e) Increased coordination with the labor market 81 86 2.90
(f) Others 6 6 3.50
3. Increased contribution to national economy by:
(a) Preparing skilled workers and craftsmen required for national
development 91 97 3.03
(b) Developing people's capabilities for employment 92 98 3.04 (c) Giving access to students from remote and disadvantaged
communities 82 87 2.95
(d) Introducing new technology 89 95 2.83
(e) Others 2 2 3.00
Notes : Based on responses from 94 teachers.
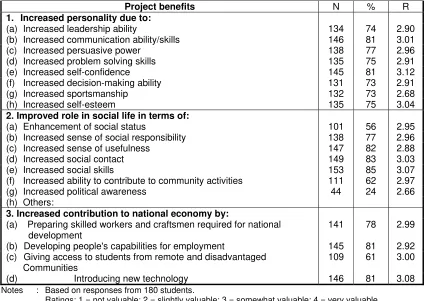
Table 7. Project benefits of the Agricultural School Project according to Students
Project benefits N % R
1. Increased personality due to:
(a) Increased leadership ability 134 74 2.90
(b) Increased communication ability/skills 146 81 3.01
(c) Increased persuasive power 138 77 2.96
(d) Increased problem solving skills 135 75 2.91
(e) Increased self-confidence 145 81 3.12
(f) Increased decision-making ability 131 73 2.91
(g) Increased sportsmanship 132 73 2.68
(h) Increased self-esteem 135 75 3.04
2. Improved role in social life in terms of:
(a) Enhancement of social status 101 56 2.95
(b) Increased sense of social responsibility 138 77 2.96
(c) Increased sense of usefulness 147 82 2.88
(d) Increased social contact 149 83 3.03
(e) Increased social skills 153 85 3.07
(f) Increased ability to contribute to community activities 111 62 2.97
(g) Increased political awareness 44 24 2.66
(h) Others:
3. Increased contribution to national economy by:
(a) Preparing skilled workers and craftsmen required for national
development 141 78 2.99
(b) Developing people's capabilities for employment 145 81 2.92 (c) Giving access to students from remote and disadvantaged
Communities
109 61 3.00
(d) Introducing new technology 146 81 3.08
Notes : Based on responses from 180 students.
Ratings: 1 = not valuable; 2 = slightly valuable; 3 = somewhat valuable; 4 = very valuable Source : Special survey of project beneficiaries 2001
The results also imply that while on the one hand more teachers recognize that quality of education has improved as a result of the project and that their ability to contribute to the national economy has improved, there is slightly less recognition that as a result of the project institutional capacity has improved. This inference is drawn on the basis of differences in numbers (or percentages) of teachers recognizing the benefits of those aspects, higher (around 90 percent) on the first item and lower for the latter mentioned item (between 65 and 86 percent).
5.3. Factors Affecting Differences In Impact
project areas than in GS project areas. The feeling of poverty is consistent with the discrepancy in levels of earnings considered ‘enough’ and actual earnings. While a good proportion of the respondents claim that they have enough if only they can earn between US 50 cents and US$ 1.00 per capita per day, almost all, in the mid to high 90 percent earn only US$1.00 per day per household of an average size of about 5 persons. This situation is so much worse than what they have known before the crisis when only about fifths of the respondents claim that their earning were this low. But then three-fourths of all respondents feel they live in poor communities, and all those living in US project areas claim that they live in poor communities. Contrary to popular belief that the poor tend to be fatalistic, they appear to be realistic as half of them admit that their conditions are their own doings, only one-fourth attribute their condition to an Act of God and one-fourth due to the project.
Then, an important question occured, what can the projects do on the dynamic benefisiaries. Three major categories of factors affecting differences in impact on poverty have been identified: macro environment, investment in social capital, and services delivery mechanisms. In the macro environment category, the only definite negative impact is due to inflation and currency devaluation. The fact that the beneficiaries themselves maintain and develop the project components indicates that social capital becomes an important concept in the study.
If at all indicative of service delivery mechanism based on responses from those living in and around the selected GS projects, beneficiaries are most likely to trust organizations based in their own respective communities, community- based organization, and next government providers whether national or local.
6. CONCLUSION: CREATING LINKAGES BETWEEN THE DONORS AND THE
POORS
The Study concludes that in general GS (Generally Successful) projects and US (Unsuccessful) projects have same impacts, but qualitatively GS projects give higher impacts on poverty reduction. The impacts include employment generations, enhanced income opportunities, improved access to basic services, improved access to infrastructure, enhanced capacity of beneficiaries to participate more actively, impacts on pro poor policy reforms, distribution of benefits, and other indirect effects on poverty reduction such as environment, gender, and institutional development of executing agencies. It is interesting that, while project officers are fail in operating and maintaining the project components, beneficiaries themselves maintain and, even, improving the components. The beneficiaries effort cause sustainability of the component significantly.
and economic environment, investment in social capital, and services delivery mechanism. Positive factors of macro environment include demand of products or services of the projects, policies from national level on the president’s decree to districts’ rules, peace and order condition, weather condition, performance of the government’s officers. Investment in social capital include beneficiaries participation and mature of community-based organization. Service delivery mechanisms include service providers, especially a community-based organization. While the Study finds a weak sustainability from the agency, except which organised by the beneficiaries themselves.
Characteristically, GS projects better address the needs of the poor, are better positioned to reach a greater number of the poor and also better situated to contribute to poverty reduction, an issue raised in this ADB past project evaluation study. With greater financial support, GS projects are better designed to reach a wider area of poverty pockets. It generally took GS projects longer to design and more time spent for implementing community participation. GS projects also included more social dimensions of poverty and in targeting beneficiaries, thereby considering a greater number of poverty dimensions. US projects, on the other hand, emphasized mostly only economic or income dimensions of poverty and beneficiary targeting. As some GS projects included a more participatory approach in project implementation, surrounding communities benefited from empowerment exercises. And, community empowerment in project implementation better contributes to structural poverty reduction prevailing in Indonesia.
Lessons learned on creating linkages between the international donors and the poor are summarized below:
1. Poverty alleviation and pro-poor projects should be involved in international donors
agenda. Poverty reduction has become a recurrent theme on the international
development agenda (ADB, 1999b). The World Bank’s World Development Report has
been periodically covering poverty since 1980. Starting 1990, the Human Development
Report of the United Nations Development Program places people in the center of
development, and in doing so raised questions about poverty.
2. The projects should be interpreted as a gateway of international donors to create a
linkage with the poor. Even though ADB projects of the 1980s did not include poverty
reduction as an explicit objective, in most cases the poor were beneficiaries of these projects, even though not necessarily by design but at least by default. If ADB is able to be interpreted as a representative international donor, then this indicated that the agenda on creating linkages between the international donors and the poor will not be too difficult to be implemented in the future.
3. International donors should interpret a keyword development as projects operation.
becomes a significant prime mover to the poor and their communities.
4. International donors should interpret poverty as a heterogenous entity rather than a
homogenous entity. Given that US projects were even less likely than GS to address
social dimensions of poverty, suggest that the failure of the US projects could well be attributed to failure of recognizing the importance of the social dimensions of poverty reduction and development in general (i.e. social stratification or hierarchy). For instance, the main reason being that most of the projects under the Study include as a component physical infrastructure which greatly facilitates economic activities, including those of the poor. On the other hand, however, the weaknesses of such projects are that they are often not sensitive to social stratification and differential gender needs resulting in possible widening income and gender gaps. The projects should address the beneficiaries more precisely on their own category about the poor. 5. The projects should be suitable towards different social context. As the poor and
poverty are heterogonous and hierarchical, the projects should address the beneficiaries more precisely on their own category as the poor.
6. The beneficiaries should be incorporated into all of management stages of the
projects, or facilitating them to construct the projects by themselves. In the planning
stage, their participation make the officers easier to gain needs of the beneficiaries. Another important component is a group formed by the poorest of the poor to unite them and to collect their power. An interesting observation worth is the fact that many of the project components have continued to exist beyond the life of the project. This suggests that beneficiaries as stakeholders do maintain infrastructure when it fulfills their needs. Even though a number of projects failed to establish the necessary institutions to maintain project components through collecting users’ fees as designed into the respective projects, that does not mean that those components have been left to completely deteriorate into stages of disrepair. Instead, it has been found that where it is in the interest of the beneficiaries, they will ensure that repairs are done when needed, irrespective of whether users’ fees are regularly collected or not.
7. The poor must be empowered by participatory projects. It is important to be noted that,
unlike “bureaucratic approach”, the “project approach” comes flashy as its natural, so that it implicates on an important thing to work with the poor to prepare and to improve their capabilities themselves for receiving the flashy projects.
8. The contextual project should be supported by qualitative and participatory
methodologies, instead of a quantitative methodology. It had better to use
social stratification and social structure, and move the people capacity to empower themselves.
9. Partnering with NGOs as well as academicians. It is important to deliver the projects,
as well as have a consultation to assess the beneficiaries and community needs, and to evaluate the project contextually.
Bibliography
Achir, YCA. 1994. “Pembangunan Keluarga Sejahtera sebagai Wahana Pembangunan Bangsa” (Welfare Family Development as a Nation Development Instrument), in
Prisma Vol. 13 No. 6, Mei.
ADB (Asian Development Bank). 2001. Moving the Poverty Reduction Agenda Forward in Asia and the Pacific: The Long-Term Strategic Framework of the Asian Development Bank (2001-2015). ADB. The Philippines.
______ 1999a. Fighting Poverty in Asia and the Pacific: The Poverty Reduction Strategy of the Asian Development Bank. ADB. The Philippines.
______1999b. Special Evaluation Study of the Effectiveness of ADB approaches and Assistance to Poverty Reduction in Bangladesh, Kyrgyz Republic, Lao People’s Democratic Republic, Nepal, and The Philippines. ADB. The Philippines.
Agusta, I. 2001. “Pemberdayaan Masyarakat dalam Otonomi Desa” (People Empowerment in Village Autonomous), In Jurnal Sosiologi Indonesia No. 5.
________. 2000. “Pembangunan Prasarana Desa Tertinggal” (Late-developed-village Infrastructure Development). In Jurnal Sosiologi Indonesia No. 4.
Agusta, I. and A. Tetiani. 2001. “Upaya Penanggulangan Kemiskinan: Belajar dari Kasus Irigasi Cibaliung” (Efforts on Poverty Alleviation: Lesson Learned from a Case of Cibaliung Irrigation Project). In Fajar Banten daily, July 14.
Alm, J., RH Aten, R Bahl. 2001. “Can Indonesia Desentralise Successfully? Plans, Problem and Prospects”, in Bulletin of Indonesia Economic Studies, Vol. 37 No.
1, April.
Asfar, M. 1996. “Otonomi Daerah Tingkat II dalam Pengelolaan Investasi” (District Autonomous on Investment Management), in Prisma Vol. 25 No. 4, April.
BPS. 1999. Penyempurnaan Metodologi Penghitungan Penduduk Miskin dan Profil
Kemiskinan (Methodology Refinement on Accounting the Poor and Poverty
Profile). Unpublished draft.
Collier, W.L., et al. 1996. Pendekatan Baru dalam Pembangunan Pedesaan di Jawa :
Kajian Pedesaan Selama Dua Puluh Lima Tahun (New Approaces in Rural
Development in Java: 25 Years of Rural Appraisal). YOI. Jakarta.
Dreze, J, and A. Sen. 1989. Hunger and Public Action. Oxford University Press. New
York.
Hamilton-Hart, N. 2001. “Anti-Corruption Strategies in Indonesia”, in Bulletin of Indonesia Economic Studies Vol. 37 No. 1, April.
Hendytio, M.K. 1999. “The Crisis and Factory Workers: Gender Issues and Impacts”, in
conference proceeding on Results of a SMERU Conference on Monitoring the Social Impact of the Crisis: Lesson Learned in 1999.
Kaloh, J. 1996. “Pola Kegiatan, Kekuasaan dan Perilaku Kepemimpinan Kepala Daerah Tingkat II” (Patterns of Actions, Power and Leadership Behaviour of District Head), in Prisma Vol. 25 No. 4, April.
Manning, C. 1999. “Poverty Decline and Labour Market Change in Indonesia: Lessons from the Soeharto Era”, in The Indonesian Quarterly, Vol. 27 No. 2, Second
Quarter.
in Indonesia). LKIS. Yogyakarta.
________. 2001b. Ruang Batin Masyarakat Indonesia (Inner Space of Indonesian
Society). LKIS. Yogyakarta.
Nombo, RL. 2000. “Regional Autonomy Program in Indonesia: What Issues Complicate Its Implication?”, in The Indonesian Quarterly Vol. 28 No. 3, Third Quarter.
Pradhan, M., et.al. 2000. Measurements of Poverty in Indonesia: 1996, 1999, and
Beyond. SMERU working paper.
Pritchett, L., A. Suryahadi, S. Sumarto. 2000. Quantifying Vulnerability to Poverty: A Proposed Measure, with Application to Indonesia. SMERU working paper.
Robison, R. 1988. “The Transformation of the State in Indonesia”, in JG Taylor, A. Turton,
eds. Sociology of “Developing Societies” Southeast Asia. Macmillan Education.
London.
Sajogyo. 1997. “Pertanian dan Industrialisasi dalam Pembangunan Rural” (Agriculture and Industrialization in Rural Development), in F. Husken, M. Rutten, JP Dirkse,
eds. Pembangunan dan Kesejahteraan Sosial: Indonesia di Bawah Orde Baru
(Development and Social Welfare: Indonesia under New Order). Gramedia. Jakarta.
_______. 1996. Garis Kemiskinan dan Kebutuhan Minimum Pangan (Poverty Line and
Minimum Food Need). Aditya Media. Yogyakarta.
_______. 1988. “Masalah Kemiskinan di Indonesia” (Poverty Problem in Indonesia), in
Mimbar Sosek No. 2, September.
_______. 1977. “Golongan Miskin dan Partisipasinya dalam Pembangunan Desa” (The Poor and Their Participation in Rural Development), in Prisma Vol. 6 No. 3,
Maret.
Spyckerelle, L, G. Ferrazzi. 1996. “Perencanaan Pembangunan pada Tingkat Kabupaten” (Development Planning on District Stage), in Prisma Vol. 25 No. 4, April.
Sumardjan, S., et.al. 1996. Hasil Studi Komisi Sosial Akademi Ilmu Pengetahuan
Indonesia tentang Percontohan Otonomi Daerah (Study Result of Social
Comission of Indonesian Academy of Science about Pilot Project on Local Autonomous). AIPI. Jakarta.
Sumodiningrat, G. 2001. Responsi Pemerintah terhadap Kesenjangan Ekonomi: Studi Empiris pada Kebijaksanaan dan Program Pembangunan dalam Rangka
Pemberdayaan Masyarakat di Indonesia (Government’s Respons towards
Economic Gap: Empirical Study on Policy and National Program according to People Empowerment in Indonesia). PerPod. Jakarta.
Suradinata, E. 1995. “Kebijakan Pembangunan dan Pelaksanaan Otonomi Daerah” (National Policy and Local Autonomous Operationalisation), in Prisma Vol. 24
No. 4, April.
Surbakti,R. 1996. “Karakteristik dan Penampilan Birokrasi Perkotaan” (Characteristics and Performance of Urban Bureaucrats), in Prisma Vol. 25 No. 4, April.
White, B. 1996. “Optimisme Makro Pesimisme Mikro? Penaksiran Kemiskinan dan Ketimpangan di Indonesia, 1967-1987” (Macro Optimism Micro Pesimism? Estimation on Poverty and Economic Gap in Indonesia, 1967-1987), in MTF Sitorus, et.al. Memahami dan Menanggulangi Kemiskinan di Indonesia: Prof. Dr. Sajogyo 70 Tahun (Understanding and Alleviating Poverty in Indonesia: Prof. Dr.