OPERATIONS IMPROVEMENT TO DESIGN
WORK POLICY: PRIORITY IDENTIFICATION
BY USING QFDF
P.L. Rika Fatimah and Abdul Aziz Jemain
Abstract. This paper discussed the improvement action for operations in the
or-ganization. The improvement shall value of designing work policy to be better and more effective. The new approach is taken by considering family performance of the human resource. Samples involved 1,213 respondents, who are married and have children, are selected from Peninsular Malaysia. Three dimensions that have been identified as important parameters for determining the family performance are family relationship, family growth and family maintenance. A quality based approach, also taken under Operations Management theory, is utilized to analyze the responses of respondent in determining the family performance. QFDF stands for Quality Function Deployment for Family is used to identify the priority action need to be taken to improve the operations in the organization. In addition, QFDF is applied to match the quality dimensions in the concept of organization to the dimensions under family life. The findings of QFDF are presented using House of Quality (HOQ) to project the family performance into quality of working in an organization.
1. INTRODUCTION
It is the essential need, for nowadays, that government and organization should put their concerned to improve their quality of manpower. Having
Received 12-05-2012, Accepted 01-06-2012.
2010 Mathematics Subject Classification: 90B25, 90B70
Key words and Phrases: QFDF; Operations Management; Human Resource Improvement; Work Policy.
the quality may strengthen the competitiveness of manpower in order to face the globalization. In most countries, especially in Asia, the smallest institution, where the manpower is being produced, is family. Therefore, it is necessary to take account of family performance as one of important indicator in designing public policy. One of important public policy is re-lated to work policy. Considering that almost every aspect of life rere-lated to work environment then it is quite strategic to have a good consideration in designing this policy.
2. FAMILY PERFORMANCE DEPLOYMENT
We use Quality Function Deployment for Family (QFDF) to project the linkage between family performance of human resources into quality of work-ing in organization [1]. QFDF is adapted the Quality Function Deployment (QFD) steps [2, 3] into appropriately to explain the Family Performance De-ployment (FPD). The first step is to determine the Voice of Family (VoF) by using Affinity Diagram. Affinity Diagram is an appropriate tool which gathered large amount of language data (ideas, opinions, issues, etc) and organized them into groups based on the same characteristics between them [4].
The next step is to translate VoF into quality perspective called ”Voice of Quality (VoQ)” by using Tree Diagram to map out path and task [5] of family in terms of quality perspective. The third step is to describe the relationship between Wolf and VoQ using certain symbols so that the relationship can be easily identified. We used L-Shaped Matrix to show every relationship for each variable [6].
Finally, we develop Family Performance Index to identify the respon-dent’s achievement level of family performance which will be discussed in section four. We analyze the results and run significance test in the back-ground of the respondents. Considering the result analysis, we propose action to be taken to enhance the performance for family and extend the idea to design the work policy. The proposed action will be further discussed in section five.
3. DATA
3.1. Subject
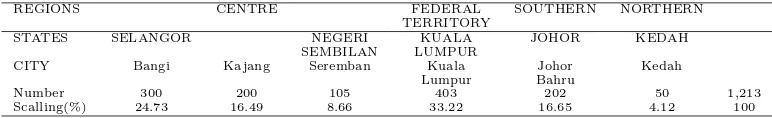
Table 1: Distributions of Returned Questionnaires for the Different Regions
REGIONS CENTRE FEDERAL SOUTHERN NORTHERN
TERRITORY
STATES SELANGOR NEGERI KUALA JOHOR KEDAH
SEMBILAN LUMPUR
CITY Bangi Kajang Seremban Kuala Johor Kedah
Lumpur Bahru
Number 300 200 105 403 202 50 1,213
Scalling(%) 24.73 16.49 8.66 33.22 16.65 4.12 100
The distribution of questionnaires according to the different regions is given in Table 1. We received 500 questionnaires for the state of Selangor where 300 questionnaires were from Bangi and 200 questionnaires were from Ka-jang. For the state of Federal Territory, we received 403 questionnaires from Kuala Lumpur. The next state is Johor Darul Takzim with 202 question-naires received from Johor Bahru. Followed by the state of Negeri Sembilan where we received 105 questionnaires from the city of Seremban. The last state is Kedah Darul Aman where we received 53 questionnaires from the city of Kedah.
The backgrounds considered for the respondent are gender, occupa-tion, educaoccupa-tion, etc. According to gender, we have 51.6% male respondents and 48.4% female respondents who are married and have children. In terms of length of marriage, 34.3% of our respondents are married in the period of less than 10 years, 30.3% for the period of between 12 until 17 years and 35.4% for the period of more than 17 years. According to ethnic groups, 46.5% of our respondents are Malay, followed by 33.3% Chinese, and the rest is Indian. There are many types of occupation of the respondents; however, the two most common occupations are related to the private sectors (39.3%) and followed by conducting their own business (27.2%).
3.2. Measure and Scale Reliability
The questionnaires consist of 107 questions. Two main parts were con-tained in the questionnaire. The first part is about respondent background with 15 questions asking for gender, race, education and etc. The second part is about a family which consists of three sub-part: (1) Family Rela-tionship with 10 questions using Likert Scale of 1 = almost never and 5 = always, (2) Personal Growth with 11 questions using the same Likert Scale and (3) System Maintenance with 12 questions using Likert Scale of 1 = very disagree and 5 = very agree.
Cron-bach’s alpha (α ), based on Cronbach [9], had been used. The value of 0.7− −0.8 above is an acceptable value for Cronbach’s alpha, values sub-stantially lower indicated an unreliable scale. The questionnaire in this study to be acceptable in terms of scale of reliability since we found the Cronbach’s alpha (α ) value of 0.95.
4. QFDF ANALYSIS FOR FAMILY PERFORMANCE INDEX
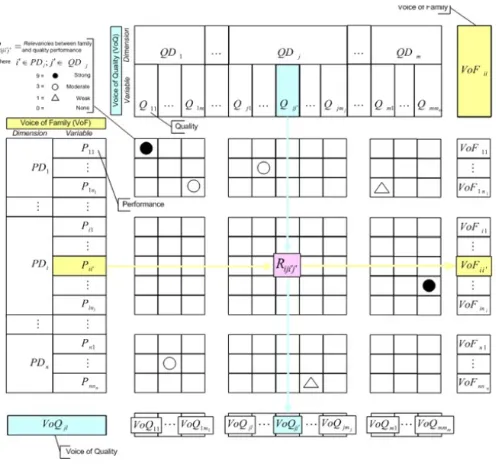
To identify the level of achievement of performance in family practices, we develop Family Performance Index. The index aggregated value between VoF and VoQ (see Fig. 1). The aggregation value is given from the respon-dent opinion regarding their level of satisfaction and importance of perfor-mance in family practices. The family practices are represented in VoF. By using Likert Scale, five levels of satisfaction and importance with five for very satisfied/importance and one for very unsatisfied/unimportance is utilized.
Figure 1: Relationship Matrixs of QFDF and notation applied
be-tween performance of i-th of dimension of i-th (Pii‘) and quality of j‘-th
of dimension j-th (Qjj‘) . The aggregation of each relevancies in rows is
represented by the Voice of Family ofj-th of dimensioni-th (V oFil) and in
columns is represented by the Voice of Quality ofiof dimension j (V oQjl).
Referring to the matrix and notation applied, it is given Family Per-formance Index as (P I) in the following manner:
Family Performance Index,
Whereas the value ofωpii‘which is weighted correlation of VoF ofi‘-th
of dimension of i-th can be obtained:
i‘, l = 1, 2, ...,ni
After we develop the Family Performance Index, we applied four levels of respondent’s achievement of family performance by using normal distribu-tion of two sigma (σ) and average (X) value. The four levels of achievement areexcellent,good,moderate, and bad.
We analyze the respondent’s level of achievement with the respondent’s background. We used significance test for p ≤0.05 is significant. The dis-cussion emphasized only to those with significant results. The test identified level of achievement of respondent on family performance and their different backgrounds respectively.
5. RESULT AND DISCUSSION
A quality based approach is used to analyze the responses of respondent in determining the family performance. The approach is based on the theory of organizational performance for assessing the level of achievement on fam-ily performance by utilizing the dimension of the famfam-ily. Three dimensions that have been identified as important parameters for determining the fam-ily performance are famfam-ily relationship, famfam-ily development [8] and famfam-ily sustainability [9].
Having identified the dimension using the quality based approach, QFD methodology was applied to match the quality dimensions in the con-cept of organization to the dimensions under family life. The findings of QFD are presented using House of Quality (HOQ) for FPD. Adjustments were made on QFD methodology and HOQ, so that it is applicable in the context of family. The relationship matrix of HOQ for FPD is as shown in Figure 2.
have a policy regarding to provide adequate education or as equal, such as courses, skills, and etc, for competitive manpower.
Figure 2: Relationship Matrix of QFDF by using HOQ [1]
We study the level of achievement not only in general but also specif-ically with respect to dimensions. By studying the respondent’s level of achievement per dimensions, we identify the improvement priority and pro-pose some consideration matters to be noted. Priority given is based on the lowest level of achievement and the lowest percentage of respondent for family dimension respectively. Family sustainability is found in the excel-lent level with 52.7% respondents. Family relationship is found in the good level of achievement with 36.2% respondents while family development with 38.4% in the same level. Based on the level of achievement and the percent-ages, the first priority is family relationship, development, and the third priority is family sustainability.
Having the priority result, the policy maker may utilize the result to design or re-evaluate work policy by considering relationship matters in the family as the first priority. It has identified earlier, in the second step of QFD, which family relationship is correspond to service strategy as de-ployed in Figure 2. The deployment shows three variables under ’family relationship’ are correspond to two variables under ’service strategy’. Three variables under family relationship represent practices of cohesion, expres-siveness, and conflict in the family. The practices of these variables may influence the family member in terms of their behavior regarding collabora-tion and strategy informacollabora-tion. Therefore, work policy which accommodates improvement in the practices of cohesion, expressiveness, and conflict in the family, may also improve the family member in terms of their ability in workplace to collaborate with other workers and to obtain information needed to develop strategy to achieve the goals targeted by the organization where he/she works. For example, variable of family expressiveness shows that improvement action to family can be achieved by providing opportuni-ties to express oneself and room for fair discussion for each family member to openly deliver their opinion [12]. The improvement in the family may be extended to the working environment through the practice of collaboration which enables people to work together to find solutions for any problem and to facilitate transfer of knowledge and skill among the workers.
work-place regarding competencies, job design, and role design. For examples, independence and creative orientation in the family promotes a self effort in planning, controlling, and inculcate the attitude of being responsible for each action and decision [13]. This orientation could motivate the family member to improve their skills, particularly the skill required at the job.
The third priority should be considered is family sustainability. Four variables under ’family sustainability’ comprise practices of roles, position, norm, and policy in the family. The practices of these variables may influ-ence the family member’s performance in the workplace regarding variables under ’technical measurement’ are layout, capacity and facilities. For ex-ample, the last variable is a norm which corresponds to capacity in the organization. Having the knowledge of rules and acceptable behavior as expected by the family will support any family member to play his roles effectively [14]. The ability of family member to follow the norms in the family could help him to satisfy the capacity of the organization by fulfilling the plan and schedule as required by the management of the organizations.
6. CONCLUSION
The approach of using family performance as one of the necessary indica-tor in designing work policy can be considered as an original contribution. The results give new perspective among decision maker and policy maker in government then extended to the organization as well. They may able to identify which variables need to be considered in relation to design better work environment. By having a good work policy which meets the public need, will support a better quality of work then enhancing the competitive-ness strength to face the global competitions.
REFERENCES
1. Rika Fatimah, P.L., Ibrahim, K., Jemain A.A., Mohamad Nasir, S., & Khairul Anuar, M.A. (2009). Quality Family Deployment: A new per-spective in determining priority importance for improving work perfor-mance in organization. Social Indicators Research: An International and Interdisciplinary Journal for Quality-of-Life Measurement, Vol.92, No.1, May, pp: 131-149 with DOI:10.1007/s11205-008-9293-9.
2. Day, G.R. 1993. Quality Function Deployment: Linking a Company With Its Customers, ASQC Quality Press, Wisconsin.
3. Hauser, J.R. 1993. How Puritan Bennet used the house of quality. Sloan Management Review, (Spring).
4. Oakland, J. 1993. Total Quality Management. 2nd ed. Butterworth-Heinmann, Oxford.
5. Mizuno, S. 1988. Management for Quality Improvement: The 7 New QC Tools. Productivity Press, Cambridge.
6. Tague, N.R. 1995. The Quality Toolbox. Synergy Books International, US.
7. Cronbach, L.J. 1951. Coefficient alpha and the internal structure of tests. Psychometrica, vol.16,pp.297-334.
8. Moos, R.H. & Moos, B. 1981. Family Environment Scale Manual. Con-sulting Psychologists Press, Palo Alto.
9. Coltrane, S. 1997. Gender and Families. A Sage Publications Company, Thousand Oaks.
10. Kelly, S. (2004). Do increased levels of parental involvement account for social class differences in track placement? Social Science Research, vol.33, pp. 626-659.
11. Gordon, Rachel A., Savage, Courtenay, Lahey, Benjamin B., Goodman, Sherryl H., Jensen, Peter S., Rubio-Stipec, Maritza, & Hoven, Christina W. (2003). Family and neighborhood income: additive and multiplicative associations with youths well-being. Social Science Research, vol. 32, pp. 191-219.
12. Miller, P.J.E., Caughlin, J.P. & Huston, T.I. (2003). Trait expressiveness and marital satisfaction: the role of idealization processes. Journal of Marriage and Family vol.65, pp.978-995.
14. Nomaguchi, Kei M. & Bianchi, Suzanne M. 2004. Exercise time: gen-der differences in the effects of marriage, parenthood, and employment. Journal of Marriage and Family 66 (May), pp.413-430.
P.L. Rika Fatimah: School of Management, Faculty of Economics & Management,
Universiti Kebangsaan Malaysia UKM 43600, Bangi Selangor Malaysia.
E-mail: rika [email protected]
Abdul Aziz Jamain: School of Management, Faculty of Economics & Management,
![Figure 2: Relationship Matrix of QFDF by using HOQ [1]](https://thumb-ap.123doks.com/thumbv2/123dok/2576486.1659192/7.595.178.417.180.381/figure-relationship-matrix-qfdf-using-hoq.webp)
