This content has been downloaded from IOPscience. Please scroll down to see the full text.
Download details:
IP Address: 168.151.130.2
This content was downloaded on 23/03/2017 at 16:27
Please note that terms and conditions apply.
Low 25(OH)D Serum May Not Reflect at Risk Skeletal Health but Not with Body Mass Index in
Women
View the table of contents for this issue, or go to the journal homepage for more 2017 IOP Conf. Ser.: Mater. Sci. Eng. 180 012281
(http://iopscience.iop.org/1757-899X/180/1/012281)
Low 25(OH)D Serum May Not Reflect at Risk Skeletal Health
but Not with Body Mass Index in Women
D K Sari1*, Z Z Tala1, Sri Lestari2, S V Hutagalung3, and R A Ganie4
1Nutrition Department, Faculty of Medicine, University of Sumatera Utara, Jl. dr. Mansur Kampus USU Medan 20155
2Public Health Department, Faculty of Medicine, University of Sumatera Utara, Jl. dr. Mansur Kampus USU Medan 20155
3Parasitology Department, Faculty of Medicine, University of Sumatera Utara, Jl. dr. Mansur Kampus USU Medan 20155
4Clinical Pathology Department, Faculty of Medicine, University of Sumatera Utara, Jl. dr. Mansur Kampus USU Medan 20155
*dina@usu.ac.id
Abstract. Background: The mechanism of low circulating 25(OH)D serum in obese people may be due to high 25(OH)D level in adipocyte resulting low in circulation or low vitamin D-binding protein (DBP). However, obese people have a higher bone mineral density (BMD), which suggests that low 25(OH)D may not associate with other bone health parameters. Objective:We sought to determine whether there is association between 25(OH)D 1) with bone health parameter differ by body weight; 2) Body mass index and BMD. Design: We conducted a cross-sectional observational study of 132 women aged 20-50 years in North Sumatera, Indonesia. Results: Serum total 25(OH)D was no different in normal, overweight, and obese women subjects ( 15.2±4.9 ng/mL). There was 77.3% categorized in deficiency and insufficiency (22.7%). There was no association among bone health parameters and body weight, but there is an association between BMD and body weight (p<0.05). Conclusions: Serum total 25(OH))D lower at all categorize body mass index, which cannot be explained by higher in adipocyte and lower in circulation or low DBP or shorter half-life of 25(OH)D. Lower 25(OH)D may not reflect at risk skeletal helath and higher BMI should be considered as a marker of higher BMD.
1. Introduction
Osteoporosis is a metabolic bone disorder characterized by low bone mass and microarchitectural deterioration, with a subsequent increase in bone fragility and susceptibility to fracture 1. Micronutrient that associated with bone health is calcium, but not only calcium, vitamin D also playing an important role in osteoporosis. Vitamin D deficiency and insufficiency is associated with increased risk of osteoporosis and possibly poorer muscle function and other adcerrse health outcomes 2,3. Vitamin D is an essential factor for the intestinal absorption of dietary calcium and skeletal mineralization. Vitamin D deficiency causes undermineralization, increased bone resorption, osteomalacia, and rickets 4.
1st Annual Applied Science and Engineering Conference IOP Publishing
Biomarker for vitamin D status is serum total 25-hydroxyvitamin D 25(OH)D, which it has a long plasma half-life and reflects both skin synthesis, natural sources oral and supplement intake 5. The Institute of Medicine recommends that 20 ng/mL is sufficient for most of the population6, but The Endocrine Society recommends that <20 ng/mL is deficient and that 20-30 ng/mL is insufficient 7 and Grant and Hollick recommends that 54-90 ng/mL is normal value in tropical countries 8. Vitamin D deficiency leads to secondary hyperparathyroids, increase bone turnover, boneloss, and is also implicated as a cause of hip fracture 9.
Tropical countries such as Indonesia and Malaysia should be less of vitamin D deficiency in the population, but the fact is vitamin D deficiency also occurs in children and adult population especially in women in those country9-11. Lifestyle of a women such as avoiding sunlight exposure, less vitamin D intake, less physical activity, and higher body mass index (BMI) directed to vitamin D deficiency 10. Serum total 25(OH)D is lower in obese people and inversely correlated with BMI. These findings have been reported in adults and children of different ethnic groups all over the world 12-18. Based on the previous research, the cause and clinical significance of low 25(OH)D serum and hence, the value of total 25(OH)D as biomarker of vitamin D status in different body weights are not clear. Possible cause of low serum 25(OH)D in obesity are a lower vitamin D supply, greater volume of distribution, reduced biological availability, or more rapid clearance 19,20.
There is contradictive research results in body weight, vitamin D, and bone health: low 25(OH)D would be expected to be associated with higher bone turn over and lower bone mineral density (BMD), but BMI and fat mass are positively correlated with BMD, and higher body weight is generally protective against fracture 21,22. Previous studies also showed that low 25(OH)D serum did not associated with BMI in tropical country women 9,10.
The aims of this study wereto determine whether there is association between 25(OH)D1) with bone health parameter differ by body weight; 2) Body mass index and BMD. To our knowledge, this is the first to study to find out the association between 25(OH)D serum with bone health parameters in tropical country women.
2. Method
We conducted a cross-sectional study of 132 women aged 20-50 years in North Sumatera, IndonesiaJuly to October 2016, during the dry season (dry season in Indonesia is between April andOctober, when there was abundant sunlight exposure). The location of recruitment was in Sumatera Island (Sumatera Utara, Medan) with latitude: 3.57 N and longitude 98.65 E, average temperature: ±32oC (90oF). This study was carried out after ethical approval was obtained from the Health Research
Ethics Committee of Sumatera Utara University Medical School (No. 560/TGL/KEPK FK USU-RSUP HAM/2016) and all participants were given written informed consent to the study procedures.
2.1. Study participants
The subjects of this study consistedhealthy adult women with various occupations, and devided into three groups for normal, overweight, and obese based on Body Mass Index (BMI), and taken purposively. There were 45 subjects in normal group, 21 in overweight group, and 66 subjects in obese group. The inclusion criteria were women within the range of 20-50 years old. Exclusion criteria were subjects with history of diabetes mellitus, myocardial infarction, renal orliver dysfunction. In addition to those exclusion criteria, subjects who were pregnant, lactating, or using medications that may alter lipid profile were also excluded.
2.2. Anthropometry, status body fat, and nutrient intake
Anthropometry included height (to the nearest 0.5 cm), weight (to the nearest 0.1 kg), waist circumference using a standardized measuring tape in centimetres, systolic and diastolic blood pressure measurement, and body mass index (calculated as kg/m2). Categorized BMI was based on Asia Pacific
(6), <18.5 classified as underweight, 18.5-22.9 classified as normoweight, 23-24.9 classified as
2
1st Annual Applied Science and Engineering Conference IOP Publishing
overweight/at risk, 25-29.9 classified as obese I, and >30 classified as obese II. Assessment of body fat percentage were using Body Composition Monitor with Scale (HBF-362, KaradaScan-Omron). Body fat percentage refered to the amount of body fat mass in regards to the total body weight expressed as a percentage, the following classified: normal ≤29.9% and high >30.0% based on Bioelectrical Impedance.Assessment of nutrient intake was based on food recall for two days (one day for weekday and one day for weekend), including energy, protein, fat, carbohydrate, calcium, phosphor, cholesterol, vitamin D, and percentage of fulfilment. Calculation were using Nutrisurvey2005, which included Indonesian foods.
2.3. Laboratory analysis
We measured 25(OH)D serum concentration by chemiluminescent immunoassay (CLIA) technology (Diasorin, Stillwater, MN), measures were between 4.0 and 150 ng/mL. The lowest value was 4.0 ng/mL which is based on an inter-assay precision 3.90% CV. Reference range were <20 ng/mL categorized deficiency, 20-30ng/mL (insuficiency), 30-100 ng/mL (suficiency). To convert ng/mL to nmol/L is multiply with 2.496 [5].Calsium serum was measured by ADVIA Bayer Assayed Chemistry Controls, with principle procedure: calcium ions form a violet complex with o-cresolphthaleincomplexone in an alkaline medium. The reaction is measured at 545/658 nm, and normal concentration of calcium was 8.3-10.6mg/dL. C-terminal telopeptide of type I collagen (CTX), which is a bone-resorption marker, was measured with the use of an automated immunoassay (Cobas e-411; Roche Diagnostics), interassay was 4.0%. Bone mineral density and T-score were assessed with the use of DXA Scan, whole body, lumbar spine, and hip DXA were performed with a Discovery densitometer (precision of the BMD measurements was 0.2-5.5%).
2.4. Statistical analysis
Continuous variables were expressed as continuous variables as means±SDs. The unpaired t test was used to compare continuous values of the study groups if the data normally distributed and Mann Whitney test was used for non-normally distributed data. The p values <0.05 were considered statistically significant. Categorical variables were expressed as percentage proportions and using chi-square to expressed significancy difference between three groups, p=<0.05.We used SPSS program (version 11.5; SPSS Inc, Chicago, IL) to perform the analysis.
3. Results and Discussions
The results will be discussed in 4 subsections, they are characteristic of study participants, body mass index, factors to low vitamin D, and bone health.
3.1. Characteristic of study participants
The aim of this study was todetermine whether there is association between 25(OH)Dwith bone health parameter differ by body weight and also its association betweenbody mass index and BMD especially in tropical country healthy women, who lived in abundant sunlight exposures area such as Indonesia, Many study found vitamin D deficiency only found in the country with four seasons, some of the study showed vitamin D deficiency was found in obese subject [24]. This study showed that even in abundant sun exposure such tropical country with two season (Indonesia), vitamin D deficiency could be found in women not only in higher adiposity (obese subjects), but also in normal adiposity (overweight and obese) as report in the other study [9,10].
Latitude has influenced to vitamin D deficiency, number of solar UV B photon (280-320nm) reaching the earth depending on zenith angle of the sun, above about 35 degrees north latitude, little or no vitamin D3 can be produced. Prospective and retrospective epidemiologic studies indicated that hypertension and cardiovascular disease found higher in people living at higher latitudes compared with people living at lower latitudes [25]. Age in this study showed the age that most women productive in Indonesia, they had a job and all of them had to leave their house to stay at work place. They spent all day long in the building which less sunlight exposure.
1st Annual Applied Science and Engineering Conference IOP Publishing
Table 1. Characteristics of all subjects
Parameters Mean ± Standard Deviation
Age (years) 35.3±8.4
Height (cm) 156.6±5.1
Body Mass Index (kg/m2) 24.9±3.7
Fat mass (%) 33.3±4.1
Lean mass (%) 25.4±1.9
25(OH)D serum levels (ng/mL) 15.2±4.9 Calsium serum levels (mg/dL) 8.8±0.3
CTX levels (ng/L) 0.3±0.1
Bone mineral density (g/cm2) 0.9±0.1
Vitamin D intake per day (mcg) 7.2±6.1 Calsiumintake per day (mg) 310.5±271.7 Sunlight exposure per day (minute) 12.9±1.9
Physical activity 4.6±0.5
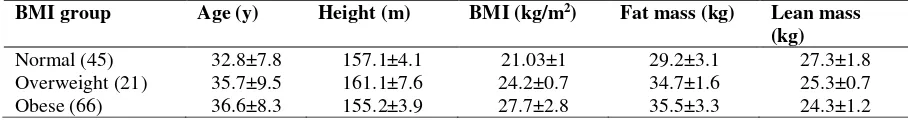
3.2. Body mass index
Adiposity could assessed from BMI that showed a higher mean of BMI, and also body fat percentage showed a higher results according to BMI categorized. This was come along with 25-hydroxyvitamin D serum concentration that showed lower concentration, but even adiposity showed higher, when all the subjects separated into three group, vitamin D deficiency could be found in normal, overweight, and obese group.
Table 2. Characteristic of subjects based on body mass index categorized
BMI group Age (y) Height (m) BMI (kg/m2) Fat mass (kg) Lean mass
(kg)
Normal (45) 32.8±7.8 157.1±4.1 21.03±1 29.2±3.1 27.3±1.8 Overweight (21) 35.7±9.5 161.1±7.6 24.2±0.7 34.7±1.6 25.3±0.7 Obese (66) 36.6±8.3 155.2±3.9 27.7±2.8 35.5±3.3 24.3±1.2
3.3. Factors to low vitamin D
We investigated several possibel mechanism for the effects of body weight on vitamin D status. Dietary vitamin D intake and sunlight exposure were not significant across BMI groups. A previous study also showed that sunlight exposure did not vary with BMI [10,26]. Vitamin D intake was shown to be below the recommended dietary allowance in all subjects. vitamin D3 has 5 times the activity of vitamin D2; and dietary food sources may not supply enough for adequate health. Cholecalciferol (D3) is found mainly in salmon, sardine, mackerel, tuna and cod fish oil. It is also found in limited quantities in milk, eggyolk, butter and margarine. Supplements commonly contain ergocalciferol (D2) extracted from mushroom or D3 extracted from lanolin. Ordinary dietary sources of vitamin D3 evidently do not supply enough for adequate health (around 250–300 IU/day in USA). Individuals with low vitamin D intake are advised to take supplements that are safe and reliable sources of vitamin D3.
However, according to other study, neither vitamin D supplements nor food sources of vitamin D are consumed on daily basis [27]. Alarmingly, this study revealed that working women consumed very limited amounts of vitamin D food sources (egg yolk, fish, meat and mushroom). Women also seldom consume vitamin D supplements. They tend to consume vitamin C or E supplements because of their antioxidant effects on the skin, even though low dietary intake of vitamin D and low sunlight exposure can have detrimental effects on health.
According to a study, the inability to buy vitamin D food sources was acause of vitamin D deficiency [28]. Our study showed that salmon and fish oil were expensive food sources in the market in North Sumatera. Mushroom can be easily obtained, but for some region, such as Sumatera, mushroom is not
4
1st Annual Applied Science and Engineering Conference IOP Publishing
a food that is regularly consumed. Mushroom is more oftenly found as herbal medicine especially on Chinese ethnic group, and not as a regularly consumed food.
Table 3. Possible factors to low vitamin D in body mass index categorized
BMI group
Dietary calcium intake (mg/day) 275.5±259.9 295.6±186.3 337.3±301.9 0.79 Sunlight exposure (minute/day) 12.7±1.9 12.9±2.3 13.0±1.9 0.88 Physical activity 4.7±0.5 4.4±0.5 4.5±0.5 0.28
Continues variable: mean ± SD; SD=standard deviation
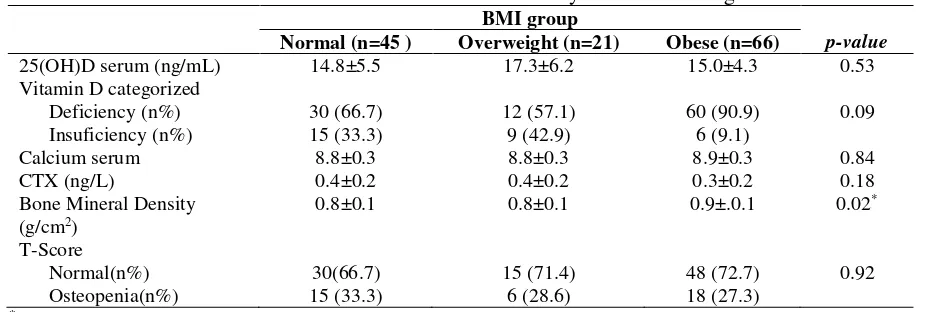
3.4. Bone health
If the low 25(OH)D serum in obese women was negatifely affecting bone health, this result showed an expected increased of burn turnover, and BMD would have been decreased. However, bone resorption markers were lower in the obese subjects than in normal-weight subjects, formation markers were similar across BMI categorized. Although higher BMI is generally protective factor against fracture and osteoporosis, there is an exces of some limb fractures in obesity, which suggests that the changes in bone density and structure may not be adequate for the increase in body weight [29]
Previous study showed that 25(OH)D serum are lower at higher BMI, they speculated that low 25(OH)D serum may not reflect at-risk skeletal health in obese people, and BMI should be considered when interpreting serum 25(OH)D as a marker vitamin D status[4]. In our result showed that there were no differ low 25(OH)D serum between all three BMI groups, deficiency or insufficiency could occurs in normal, overweight, and obese group.
Table 4. Bone health and its association with body mass index categorized
BMI group
p-value
Normal (n=45 ) Overweight (n=21) Obese (n=66)
25(OH)D serum (ng/mL) 14.8±5.5 17.3±6.2 15.0±4.3 0.53
*p<0.05=significant; Continues variable: mean ± SD; categorical variable: n (%); SD=standard
deviation
Possible causes of low 25(OH)D serum level in all BMI groups may be due to low vitamin D-binding protein (DBP) or faster metabolic clearance, however, obese people have a higher bone mineral density which suggests that low 25(OH)D may not be associated with other bone health markers such as calcium serum and T-score. Greater than 99% of circulating 25(OH)D is bound to vitamin D-binding protein and albumin, and remaining free fraction is the most biologically available. There is paradox in body weight, vitamin D, and bone health: low 25 (OH)D would be expected to be associated with higher bone turnover, however, this result study showed negative fact that low 25(OH)D serum occurs in all groups. Higher BMI and fat mass are positively correlated with BMD and higher body weight is generally protective against osteoporosis.
1st Annual Applied Science and Engineering Conference IOP Publishing
4. Conclusions
It is well recognized that serum total 25(OH))D is low in obesity, but we have shown that 25(OH)D serum are also lower in normal and overweight. Which it cannot be explained by higher in body mass index and lower in circulation or low DBP or shorter half-life of 25(OH)D. Lower 25(OH)D may not reflect at risk skeletal health and higher BMI should be considered as a marker of higher BMD.
Acknowledgments
T
he authors gratefully acknowledge that the present research is supported by Ministry of
Research and Technology and Higher Education Republic of Indonesia. The support is under
the research grant BP-PTN USU of Year 2016 Contract Number 1/UN5.2.3.1/PPM/SP/2016.
References
[1]
Blake G M and I Fogelman 2007 The role DXA bone density scans in the diagnosis and treatment of osteoporosis Postfrad Med J. 83 509-517[2]
Cranney A, Horsley T, O’Donnell S, Weiller H, Puil L, Ooi D, Atkinson S, Ward L, Noher D and Hanley D 2007 Effectiveness and safety of vitamin D in relation to bone health Evid Rep technol Assess 158 1-235[3]
Rosen C J, Adams J S, Bikle D D, Black D M, Demay M B, Manson J E, murad M H and Kovacs C S 2012 The nonskeletal effects of vitamin D: an endocrine society scientific statement Endocr Rev. 33 456-492[4]
Walsh J S, Evans A L, Bowles S, Naylor K E, Jones K S, Schoenmakers I, Jacques R M and Eastell R 2016 Free 25-hydroxyvitamin D is low in obesity, but there are no adverse associations with bone health Am J Clin Nutr. 103 1465-1471[5]
Holick M F 2007 Vitamin D deficiency N Engl J Med. 357 266-281[6]
Institute of medicine 2011 Dietary reference intakes for calcium and vitamin D (Washington DC: The National Academia Press) p 224.[7]
Hollick M F, Binkley N C, Bischoff-Ferrari H A, Gordon C M, Hanley D A, Heaney R P, Murad M H, Weaver C M and Endocrine S 2011 Evaluation, treatmemnt, and prevention of vitamin D deficiency: an Endocrine Society clinical practice guideline J Clin Endocrinol Metab. 96 1911-1930.[8]
Grant W B and Holick M F 2005 Benefit and requirement of vitamin D for optimal health: A review Altern Med Rev. 10 94-111[9]
Sari D K, Damanik H A, Lipoeto NI and Lubis Z 2013 Is micro evlution in tropical country women resulting low 25(OH)D level?: A cross sectional study in Indonesia J Nutr Food Sci. 4 1-7[10]
Sari D K, Damanik H A, Lipoeto N I and Lubis Z 2014 Occurrence of Vitamin D Deficiency among Woman in North Sumatera, Indonesia Malaysian J Nutr. 20 63-70[11]
Khor G L, Chee W S, Shariff Z M, Poh B K, Arumugam M, Rahman J A and Theobald H E 2011 High prevalence of vitamin D insufficiency and its association with BMI-for-age among primary school children in Kuala Lumpur, Malaysia BMC Public Health 11 95-103[12]
Macdonald H M, Mavroeidi A, Barr R J, Black A J, Fraser W D and Reid D M 2008 Vitamin D status in postmenopausal women living at higher latitudes in the UK in relation to bone health, overweight, sunlight exposure and dietary vitamin D Bone 42 996–1003[13]
Ardawi M S, Sibiany A M, Bakhsh T M, Qari M H and Maimani A A 2012 High prevalence of vitamin D deficiency among healthy Saudi Arabian men: relationship to bone mineral density, parathyroid hormone, bone turnover markers, and lifestyle factors Osteoporos Int. 23 675–86[14]
Shea M K, Houston D K, Tooze J A, Davis C C, Johnson M A, Hausman D B, Cauley J A, Bauer D C, Tylavsky F and Harris T B 2011 Correlates and prevalence of insufficient 25-hydroxyvitamin D status in black and white older adults: the health, aging and body composition study J Am Geriatr Soc. 59 1165–746
1st Annual Applied Science and Engineering Conference IOP Publishing
[15]
Rajakumar K, de las Heras J, Chen T C, Lee S, Holick M F and Arslanian SA 2011 Vitamin D status, adiposity, and lipids in black American and Caucasian children J Clin Endocrinol Metab. 96 1560–1567[16]
Bolland M J, Grey A B, Ames R W, Mason B H, Horne A M, Gamble G D and Reid I R 2006 Determinants of vitamin D status in older men living in a subtropical climate Osteoporos Int. 17 1742–1748.[17]
Lagunova Z, Porojnicu A C, Lindberg F, Hexeberg S and Moan J 2009 The dependency of vitamin D status on body mass index, gender, age and season Anticancer Res .29 3713–3720[18]
McKinney K, Breitkopf C R and Berenson AB 2008 Association of race, body fat and season with vitamin D status among young women: a crosssectional study Clin Endocrinol (Oxf). 69 535–541[19]
Kull M, Kalikorm L and Lember M 2009 Body mass index determines sunbathing habits: implications on vitamin D levels Intern Med J. 39 256-258[20]
Goldner W S, Stoner J A, Thompson J, Taylor K, Larson L, Erickson J and McBride C 2008 Prevalence of vitamin D insufficency and deficiency in morbidly obese patients: a comparison with non-obese controls Obes Surg. 18 145-150[21]
Bolland M J, Grey A B, Ames R W, Horne A M, Gamble G D and Reid I R 2006 Fat mass is an important predictor of parathyroid hormone levels in postmenopausal women Bone 38 317– 321[22]
Edelstein S L and Barrett-Connor E 1993 Relation between body size and bone mineral density in elderly men and women Am J Epidemiol. 138 160–169[23]
Holick M F 2007 Vitamin D deficiency N Engl J Med. 357 266-281[24]
Norman A W 1998 Sun, season, skin pigmentation, vitamin D, and 25-hydroxyvitamin D: integral components of the vitamin D endocrine system Am J Clin Nutr. 67 1108-1110[25]
Holick M F 2001 Sunlight “Dilemma: risk of skin cancer or bone disease andmuscle weakness Lancet 357 4-6[26]
Macdonald H M, Mavroeidi A, Aucott L A, Diffey B L, Fraser W D,Ormerod A D and Reid D M 2011 Skin color change in Caucasian postmenopausalwomen predicts summer-winter change in 25-hydroxyvitaminD: findings from the ANSAViD cohort study J Clin Endocrinol Metab. 96 1677–1686[27]
Hollis B W 2005 Circulating 25-hydroxyvitamin D levels indicative of vitamin D sufficiency: implications for establishing a new effective dietary intake recommendation for vitamin D J Nutr. 135 317-322[28]
Masood S H and Iqbal M P 2008 Prevalence of vitamin D deficiency in South Asia Pak J Med Sci. 24 891-897[29]
Compston J E,Watts N B, Chapurlat R, Cooper C, Boonen S, GreenspanS, Pfeilschifter J, Silverman S, Diez-Perez A and Lindsay R 2011 Obesityis not protective against fracture in postmenopausal women: GLOW Am J Med. 124 1043–10501st Annual Applied Science and Engineering Conference IOP Publishing