Preparation and characterization of zinc oxide doped with ferrite and chromium
M. Ginting, S. Taslima, K. Sebayang, D. Aryanto, T. Sudiro, and P. Sebayang
Citation: AIP Conference Proceedings 1862, 030062 (2017); doi: 10.1063/1.4991166
View online: https://doi.org/10.1063/1.4991166
View Table of Contents: http://aip.scitation.org/toc/apc/1862/1
Published by the American Institute of Physics
Articles you may be interested in
A comprehensive review of ZnO materials and devices
Journal of Applied Physics 98, 041301 (2005); 10.1063/1.1992666
Effect of post-thermal annealing on the structural of ZnO thin films deposited using sol-gel spin-coating method AIP Conference Proceedings 1862, 030045 (2017); 10.1063/1.4991149
Structure, magnetic, and electrical properties of Zn1-xMnxO material AIP Conference Proceedings 1862, 030050 (2017); 10.1063/1.4991154
On the optical band gap of zinc oxide
Journal of Applied Physics 83, 5447 (1998); 10.1063/1.367375
Synthesis and characterization of Co-doped zinc oxide nanorods prepared by ultrasonic spray pyrolysis and hydrothermal methods
AIP Conference Proceedings 1862, 030056 (2017); 10.1063/1.4991160
Preparation and Characterization of Zinc Oxide Doped
with Ferrite and Chromium
M. Ginting
1, a), S. Taslima
2, K. Sebayang
2, D. Aryanto
1, T. Sudiro
1,
and P. Sebayang
11Research Center for Physics, LIPI, Serpong 15314, Indonesia
2Faculty of Graduate Study, University of Sumatera Utara, Medan 20155, Indonesia
a)Corresponding author: [email protected]
Abstract. In this paper, the effect of doping concentrations of Fe and Cr on ZnO powder was studied by using X-ray diffraction (XRD). The ZnO was doped using solid state reaction method with High Speedshaker Mill (HSM) and continued with sintering at 900°C for 4 hours. Samples doped with Fe and Cr have polycrystalline hexagonal wurtzite structure. XRD pattern of ZnO doped with Fe is not far different from that with Cr. The intensity decrease and the peak shifted to a higher 2θ angle indicate the change in the crystal parameters such as lattice parameters, crystalline sizes, and d-spacing.
INTRODUCTION
ZnO is an n-type semiconductor with a direct band gap of 3.37 eV at room temperature and has a large exciton binding energy (60 meV). It has the potential for a wide range of optoelectronic applications, solar cells, LEDs, UV lasers and gas sensors [1-2]. In recent years, ZnO was intensively studied as a material dilute magnetic semiconductor [3]. When ZnO is doped with the transition metal ions such as Mn, Fe, Cu, Cr, Co, and V, it shows ferromagnetic properties [4]. This occurs due to the spin exchange interaction, so that the ZnO shows its magnetic properties [5]. Chromium (Cr) and iron (Fe) are a transition metal with a unique chemical stability [6]. Room-temperature ferromagnetism (RTFM) in ZnO: Fe and ZnO: Cr has been widely studied, but only a few studies had been done on the structure of the ZnO after doping. It is well known that the nature of the material structures will affect other physical properties. Previous studies [6-10] suggest that the addition of doping Fe, Cr, or both, affect the structure of the resulted crystals. The structural changes of the material will change its magnetic and electrical properties.
Several methods have been used for the fabrication of ZnO doping transition metals with Fe and Cr, such as: sol-gel [6, 11], coprecipitation [12], solid state reaction [7-8], sputtering [1] and hydrothermal [13]. However, the method of solid state reaction is less expensive, simple in preparation and could be more easily to scaled-up [14]. This paper reports the XRD study on the fabricated ZnO: Fe and ZnO: Cr using solid state reaction.
EXPERIMENTAL DETAIL
RESULTS AND DISCUSSION
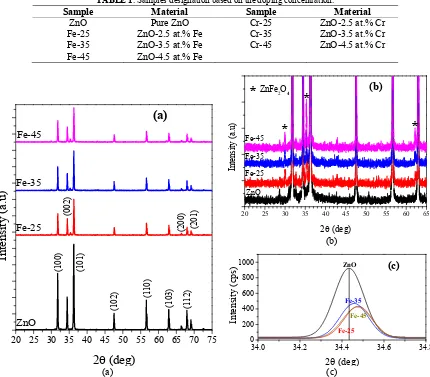
Figure 1 shows the XRD patterns of pure ZnO and ZnO doped with Fe (Fig. 1a), detail of the XRD pattern observation at the angle of 20° to 65° (Fig. 1b) and detail observation of the ZnO (002) peak (Fig. 1c). Pure ZnO and doped ZnO appeared as three dominant peaks at an angle 2θ of 31.81°, 34.47° and 36.29°, consecutively identified as the plane of (100), (002) and (101) (JCPDS No. 00-005-0664). There are also peaks at (102), (110), (103), (200), (112) and (201) with a low intensity. These results confirm that the preparation of pure ZnO and doped ZnO with Fe has a wurtzite hexagonal structure [15]. More detailed observations of XRD pattern in Fig. 1b, shows the peaks at around 2θ angle of 30.32°, 35.1°, and 62° indicating ZnFe2O4 phases (JCPDS No. 01-086-0508). The appearance of ZnFe2O4
phases might be due to the mechanical diffusion occurred during mixing and milling process. The sintering effect is also believed to cause the Fe ion diffusion into the lattice of ZnO, as also reported in Ref. [9]. The peak intensity of ZnFe2O4 increases with the doping concentration. The increase concentration of Fe dopant will also increase the value
of Fe ions diffusion in the ZnO lattice [9]. Fig. 1c is the fitting analysis done to the plane of (002).
It can be clearly seen that there is a peak shift towards the larger 2θ angle when ZnO doped with Fe. The position change of the diffraction peaks of ZnO doped with Fe due to the additional of dopant was also observed. These results indicate that the change in the lattice parameters of ZnO is due to the diffusion of Fe ions into ZnO lattice. The
TABLE 1. Samples designation based on the doping concentration.
Sample Material Sample Material
ZnO Pure ZnO Cr-25 ZnO-2.5 at.% Cr
calculated crystal parameters such as d-spacing, the average size of the crystals, the lattice parameter, Zn-O bond length and the unit cell volume of ZnO (002) for doping ZnO Fe and Cr are shown in Table 2. The d-spacing of the crystal planes (002) for the hexagonal structure is determined using the Equation 1 [16].
(
)
where a and c are a hexagonal crystal lattice parameters, h k l are miller indices. The value of the d-spacing is closely related to the presence of strain fields within the non-equilibrium grain boundaries inside of crystallite [15].
Based on the FWHM data from the diffraction peak of (002) plane, the average crystals size (D) can be calculated using Debbey Scherrer formula as given in Equation 2 [2],
θ
where β is the FWHM of the diffraction peak (002). In this work, the crystal size of ZnO doping Fe decreased from 53.51 nm to 50.84 nm with increasing the value of Fe concentration. The same result is shown in the preparation of Fe doping ZnO with a sol-gel method reported somewhere [17]. However, a different result is obtained when the ZnO doped with Cr, in which the crystal size is directly proportional to the increase of dopant.In Ref [10], it was reported that the ZnO crystal size was reduced as the number of Cr dopant increased. This is because of the ionic radius of Cr3+smaller than that of Zn2+ ions. The difference in the results might be due to the effects of heat treatment that was
performed to the sample. The grain size will also be different due to the agglomeration [15].
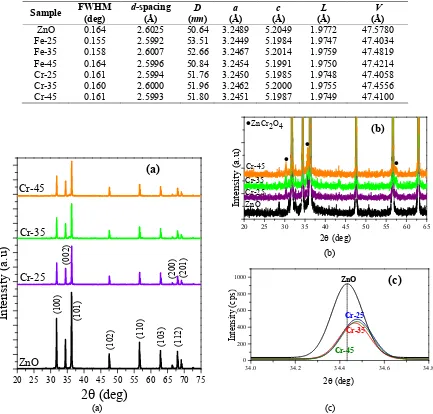
Figure 2 shows the XRD patterns of pure ZnO and ZnO doping Cr, the detail of the XRD pattern observation angle of 20 to 65° and the detail observation of the peak of ZnO (002). From Fig. 2a, it can be seen that the XRD patterns of ZnO doped with Cr has similarities with the XRD pattern of ZnO doped with Fe. This result also confirms that ZnO doped with Cr has a wurtzite hexagonal structure [15] with the dominant peaks intensity at planes (100), (002) and (101) (JCPDS No. 00-005-0664). The appearance of ZnCr2O4 secondary phase at ZnO doped with Cr is
also found at angle 2θ of about 30.32°, 35.1° and 57.5° (JCPDS No. 01-087-0028). The increasing value of ion Cr dopant will affect the number of Cr ion that was entered the ZnO lattice. This can be recognized by the increase of peak intensity (Fig. 2b). While details observation peak of ZnO at (002) plane, showed that there is also a shift to the greater value of 2θ (Fig. 2c). This can be indicated as the Cr ion is successfully substituted ion Zn in ZnO lattice. The ionic radii value of Cr3+ (0.64 Å) that is smaller than Zn2+ ion (0.74 Å) is believed to be the cause that the peaks is
shifted to a higher value of 2θ [1] also reported a similar results, with the increasing value of Cr dopant causes a shift in the diffraction peaks. Changes to the diffraction peaks may also indicate the change in crystal parameters [18].
Table 2 listed the calculated lattice parameters, such as bond length, the unit cell volume, and the average size of the crystals in the plane (002) for all samples included pure ZnO. The value of the lattice parameters for ZnO doped with Fe or Cr are smaller than the theory (JCPDS No. 00-005-0664) where the value of a = 3.249Å, and c = 5.205 Å. This confirmed that most of ion Fe or Cr was successfully substituted into the ZnO lattice. While the Zn-O bond length (L) can be estimated using Equation 3:
(
2)
(
( )
)
2 2system is calculated from Equation 4 [16]:
c a
L=0.866× 2× (4)
It is apparent in Table 2, the lattice parameters, unit cell volume, and the Zn-O bond distance changes with increasing Fe or Cr dopant. The crystal parameter value of ZnO doped with Fe or Cr, in general, is smaller than the value of pure ZnO. This indicates that the Fe3+ or Cr3+, which both have an ionic radii smaller than Zn2+ ions have
TABLE 2. Calculated lattice parameters, such as bond length, the unit cell volume and the average size of the crystals in the (002) plane for samples ZnO through ZnO doped Cr-45.
Sample FWHM
FIGURE 2. (a) XRD patterns of pure ZnO and ZnO doped with Cr, (b) detail of the XRD pattern observation angle of 20° to 65° and (c) detail observation of ZnO (002) peak.
charge imbalance in ZnO structure [17]. These results are shown in the XRD patterns, where the peak intensity decreases and the FWHM become wider by increasing the number of dopants.
CONCLUSIONS
The solid state reaction preparation method and XRD characterization of ZnO doped with Fe and Cr have been successfully carried out. XRD patterns of ZnO doped with Fe or Cr showed ZnO with wurtzite hexagonal structure as the main phase. The ZnO doped with Fe produces a secondary phase ZnFe2O4 while doping with Cr produce ZnCr2O4
REFERENCES
1. F. Chang-feng, C. Xi-ming, L. Lan, H. Lian-fu, and W. Xiaoguo, Optoelectron. Lett.6, 1-4 (2010). 2. S. M. Salaken, E. Farzana, and J. Podder, J. Semicond.34, 073003 (2013).
3. A. Zunger, S. Lany, and H. Raebiger, Physics3, 53 (2010).
4. K. Sato and H. Katayama-Yoshida,J. Appl. Phys.40, L334-L336 (2001).
5. S. Choudhury, S. Sain, M. K. Mandal, S. K. Pradhan, and A. K. Meikap, Mater. Res. Bull.77, 138-146 (2016). 6. P. Chand, A. Gaur, and A. Kumar, International Journal of Chemical, Molecular, Nuclear, Materials and
Metallurgical Engineering 8, 1317-1320 (2014).
7. R. Elilarassi and G. Chandrasekaran, Optoelectron. Lett.8, 109(1-4) (2012). 8. M. Meyer and L. C. Damonte, Powder Technol.286, 371-377 (2015).
9. S. Karamat, R. S. Rawat, P. Lee, T. L. Tan, and R. V. Ramanujan, Prog. Nat. Sci. Mater. Int.24, 142-149 (2014). 10. S. A. Ansari, W. Khan, M. Chaman, and A. H. Naqvi, Asian J. Chem. 23, 5622-5624 (2011).
11. W. Zhang, J. Zhao, Z. Liu, and Z. Liu, Appl. Surf. Sci.284, 49-52 (2013).
12. P. K. Sharma, R. K.Dutta, A. C. Pandey, S. Layek, and H. C.Verma, J. Magn. Magn. Mater.321, 2587-2591 (2009).
13. P. Chand, A. Gaur, and A. Kumar, Procedia Materials Science10, 97-102 (2015). 14. F. J. Owens, J. Magn. Magn. Mater.321, 3734-3737 (2009).
15. D. Aryanto et al., Proceedings of the 1st International Symposium on Current Progress in Mathematics and
Sciences 2015 (ISCPMS 2015), Depok, 2015, edited by T. Mart and D. Triyono (AIP Publishing, New York, 2016), Vol. 1729, p. 020039.
16. V. Pazhanivelu, A. Paul Blessington Selvadurai, R. Kannan, and R. Murugaraj, J Mater. Sci. Mater Electron.6, 5549-5556 (2016).
17. M. M. Hassan, W. Khan, A. Azam, and A. H. Naqvi, J. Lumin.145, 160-166 (2014).