Volume Target Delineation for Brain Tumor in Mri Images Using Active
Contour Segmentation Method
Catur Edi Widodo 1, Kusworo Adi 1, Aris Sugiharto 2, Qidir Maulana B. S.1 and Adi Pamungkas 1 1) Physics Department, Faculty of Science and Mathematics, Diponegoro University, Indonesia. 2) Computer Science Department, Faculty of Science and Mathematics, Diponegoro University, Indonesia.
E-mail: [email protected]
Abstract
Radiotherapy is a tumor treatment process using high dose of radiation. Hence, it is essential that radiotherapy is carefully planned with a Treatment Planning System (TPS). The first step in TPS is delineation that aims to get a better picture of the tumor and the target volume value. This research investigated volume target delineation for brain tumor against the MRI image of the head in axial position. Calculated target volumes include GTV (Gross Tumor Volume), CTV (Clinical Target Volume), PTV (Planning Target Volume), and OAR (Organ at Risk). Images were segmented using the active contour method. Segmentation result from each
Slice is then calculated for its area, which then in turn, integrated to get the target volume. This research yields calculated volume and 3D visualization of each target. These two parameters are parts of a Treatment Planning System (TPS)used as a guideline in radiotherapy.
Keywords: volume definition, brain tumor, active contour, axial
INTRODUCTION
Brain tumor is one of the most commonly tumors, especially in males. In the United States, brain tumor accounts for 85-90% of all central nerve system tumors. Incidence level of this disease is around 6.6 per 100,000 people per year, with a mortality rate of 4.7 per 100,000 people per year [1]. Brain tumor can be recognized using some modalities. One of them is Magnetic Resonance Imaging (MRI) that can clearly display soft tissues images.
Brain tumor is not always fatal as it comes in both benign and malignant form. Nonetheless, a proper and timely treatment is necessary to prevent any further complications. Brain tumor can be treated using high dose radiation that kills tumor cells. This treatment is known as radiotherapy. As it uses high dose of radiation, a precise planning must be made. A system that ensures this is the Treatment Planning System (TPS). The first step in TPS is delineation that aims to get a better picture of the tumor and the target volume value in 3D [2].
Delineation is commonly carried out by medical physicists or physicians. This is prone to lengthy procedures and is subjective in nature. It will be better if the process is done automatically. This goal is made possible with the presence of digital image processing that allows image interpretation to gain more information from it. Hence, digital image processing can be applied in the process of target volume
delineation. The stages of which include image segmentation (contouring), 3D image reconstruction, and target volume calculation [3,4].
Basyid et al., (2014) conducted a research on medical image segmentation to recognize cancer objects using the active contour method. This method employs a loop curve method that is able to move inside and outside. The segmentations for each target volume include GTV (Gross Tumor Volume), CTV (Clinical Target Volume), PTV (Planning Target Volume), and OAR (Organ at Risk). Segmentation results were then reconstructed and visualized in 3D [5].
Another researcher, Aslian et al., (2013) conducted a research on target volume delineation using active contour. This research was only limited to CTV delineation. Results show good accuracy and they also confirm that the active contour algorithm is capable of determining the CTV [6].
Research on the application of digital image processing has been conducted by many researchers across the globe [7,8,9,10,11]. Based on that earlier research this research carried out target volume delineation for brain tumor in MRI images using active contour segmentation method. The delineation process included calculation of GTV, CTV, PTV, and OAR on images of head in axial position. Contouring results are then reconstructed and visualized in 3D. Results of target volume calculation and visualization are parts of a Treatment Planning System (TPS) that serves as a guide in radiotherapy.
LITERATURE STUDY Volume Definition
Figure 2.1 Graphical representation of the volumes of interest, as defined [8,9].
Gross Tumor Volume (GTV)
The Gross Tumor Volume (GTV) is the gross visible/ demonstrable extent and location of malignant growth” [13]. The GTV is usually based on information obtained from a combination of imaging modalities (computed tomography (CT), magnetic resonance imaging (MRI), ultrasound, etc.), diagnostic modalities (pathology and histological reports, etc.) and clinical examination.
Clinical Target Volume (CTV)
The clinical target volume (CTV) is the tissue volume that contains a demonstrable GTV and/or sub-clinical microscopic malignant disease, which has to be eliminated. This volume thus has to be treated adequately in order to achieve the aim of therapy, cure or palliation [13].
The CTV often includes the area directly surrounding the GTV, which may contain microscopic disease and other areas considered to be at risk and requiring treatment (e.g. positive lymph nodes). The CTV is an anatomical–clinical volume and is usually determined by the radiation oncologist, often after other relevant specialists such as pathologists or radiologists have been consulted. The CTV is usually stated as a fixed or variable margin around the GTV (e.g. CTV = GTV + 1 cm internal margin is designed to take into account the variations in the size and position of the CTV relative to the patient’s dose is actually absorbed in the CTV [13].
The PTV includes the internal target margin [9] and an additional margin for set-up uncertainties, machine tolerances and intra-treatment variations. The PTV is linked to the characteristics of the radiation beam (i.e. penumbral areas and buildup region), as these will require an additional margin during treatment planning and shielding design.
Organ at Risk (OAR)
The organ at risk is an organ whose sensitivity to radiation is such that the dose received from a treatment plan may be significant compared with its tolerance, possibly requiring a change in the beam arrangement or a change in the dose. Specific attention should be paid to organs that, although not immediately adjacent to the CTV, have a very low tolerance dose (e.g. the eye lens during nasopharyngeal or brain tumor treatments). Organs with a radiation tolerance that depends on the fractionation scheme should be outlined completely to prevent biasing during treatment plan evaluation [12].
Active Contour
Active contour, also known as snake, is a segmentation method that uses the closed curved model capable of widening and narrowing. This method works by minimizing the energy related to the present contour as the amount both internal and external energy. Active contour can widen and narrow itself by minimizing the image energy using an external energy. It also affects the image characteristics such as edges. The energy that affects active contour is formulated as [15]:
whereas Eext is the external energy that that drags the contour wider or narrower to the desired object.
(
s
)
is a two while the second term makes the curve moves like thin plate. The external energy is formulated as [15]:2
where G is the image to be segmented. This system consists of a number of points connected and controlled by a straight line, as depicted in Fig. 2.2. Active contour is described as a controlled string of points.
drawn toward the features of the image due to the effects of internal energy.
Figure 2.2. Active contour as a group of controlled coordinate points [15].
METHOD Materials
The main material used in this research is an image of brain tumor from an MRI scanning in an axial position. It is 256 x 192 pixels in size and consists of 19 slices. Each slice is 0.5 cm thick, with a spatial resolution of 10.24 pixels/cm.
Instruments
The instruments used in this research include: Hardware
The hardware is a notebook of Intel (R) Core (TM) i3-5010U CPU @2.10 GHz and Installed memory (RAM) of 4.00 GB. Software
a. The software used to run image processing is Matlab R2015b. It is utilized to delineate brain tumor images and calculate target volumes.
b. The operation system used is Microsoft Windows 10 Enterprise 64-bit (10.0, Build 10586).
Image Processing
The image processing stages is given in Fig. 3.2.
Figure 3.2: Flow Chart of Image Processing
a. Image Slice Determination
The process begins with determining the image slice of the tumor and the organs that need to be protected (OAR) from each slice. Images that do not have tumor and OAR will not be segmented.
b. Masking Initialization
Masking initialization for MRI head image begins with determining the proper iteration. The initialization used in this research is an ellipse. This process results in a contour. c. Target Area Calculation
Calculation of target area is conducted using Simpson integration, which is calculating the area of each slice. d. Target Volume Calculation
Calculation of target volume
Image slice determination in the target volume
Image segmentation with active contour
Calculation of target area Is the any contour?
Finish Start
Slices of head image
Target volume and 3-D visualization
Yes
Target volume calculation is also conducted using Simpson integration. It is done by adding target areas and multiplying them with slice thickness. This process results in either axial, coronal, or sagittal target volume.
RESULT AND DISCUSSION Image Acquisition
Image acquisition is carried out by scanning a patient’s head for brain tumor using the modality of Magnetic Resonance Imaging (MRI)in the axial position. The axial image position in this research is of 256 x 192 pixels resolution with 19 slices and a slice thickness of 0.5 cm. This image has a spatial resolution of 10.24 pixels/cm. Each image slice in the axial position is given in Fig. 4.1.
Figure 4.1 Slices of head image in axial position.
Target Volume Delineation
Delineation process in this research consists of calculations for GTV (Gross Tumor Volume), CTV (Clinical Target Volume), PTV (Planning Target Volume), and OAR (Organ at Risk). Slices of axial image with tumors are numbered 12, 13, 14, 15, and 16, whereas slices of axial image with OARs are the left and right eyes that are numbered 4, 5, 6 and 7. Delineation process is conducted by contouring using active contour. This method starts with giving a mask in the form of circle on the target volume. This masking will then grow automatically to form an area in the target volume. Resulting samples of GTV, CTV, and PTV contours on slice number 16 is depicted in Fig. 4.2.
(a) (b)
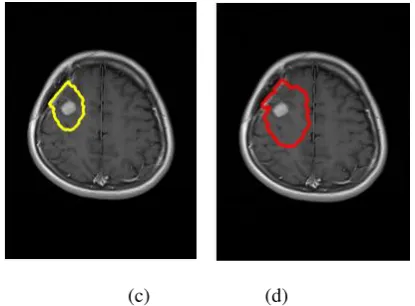
(c) (d)
Figure 4.2: Contouring results of the axial image on slice number 16 (a) Initial image (b) GTV contour (c) CTV contour, and (d) PTV contour.
Fig. 4.2 describes the process of axial image contouring for slice number 16. GTV contouring is done for the primary tumor with an initial circular masking. CTV contouring then ensues with 1 cm margin from GTV contouring, that is CTV = GTV+1 cm. For CTV contouring, the resulting area from GTV contouring is used as an initial masking. Next is PTV contouring with 1 cm margin from CTV, that is PTV = CTV+1 cm or PTV = GTV+2 cm. For PTV contouring, the resulting area from CTV contouring is used as an initial masking. Once GTV, CTV, and PTV contouring are done, the subsequent process is OAR1 and OAR 2 contouring. Contouring for each OAR is done with an initial circular masking. In this axial image slice, OAR 1 and OAR 2 are on the same slices, they are slices number 4, 5, 6, and 7. Resulting OAR contours are given in Fig. 4.3.
(a) (b) (c)
Figure 4.3 Contouring results of the axial image on slice number 6 (a) Initial image, (b) OAR 1 contour, and (c) OAR 2 contour.
resulting contours are then kept in a database for the next process of 3D image reconstruction and target volume calculation.
3D Image Reconstruction
3D image reconstruction starts with taking the 2D contour data that have been stored before. These target volumes are then reconstructed and visualized in 3D along with all slices of axial images. Visualization of target volume in 3D on the axial position is depicted in Fig. 4.4.
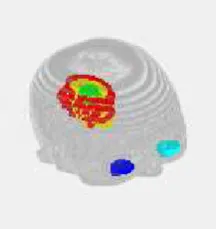
Figure 4.4 Target volume 3D visualization on the axial position.
Fig 4.4 depicts 3D visualization of all target volumes on the axial position. Green indicates GTV, yellow shows CTV, red represents PTV, blue depicts OAR 1, and cyan describes OAR 2.
Target Volume Calculation
Calculation of target volume begins with calculating the target area for each slice. Target area calculation itself starts with calculating the number of pixels that make up a segmented object. The resulting pixels are then converted into cm2 using
the following equation:
𝐴′= 𝐴 / 𝑟𝑒𝑠2 (4.1)
where
A’ = target area (cm2)
A = target area (pixel)
res = image spatial resolution (pixel/cm)
Results of target area calculation on the axial image slice are given in Table 4.1.
Table 4.1. Target volume calculation result on the axial image slice.
Target volume
Manual target area calculation (cm2)
GTV 12.9413
CTV 57.7068
PTV 97.4369
OAR 1 7.4673 OAR 2 7.6199
Volume
Target volume calculation is carried out by adding all target areas and multiplying them with slice thickness. The formula used for target volume calculation is:
𝑉 = 𝑆 × ∑ 𝐴 (4.2) where
V = target volume (cm3)
S = slice thickness (cm) A = target area (cm2)
Results of target volume calculation on the axial image slice are given in Table 4.2.
Table 4.2. Target volume calculation results on the axial image slice.
Target volume Manual target volume calculation (cm3)
GTV 6.4707
CTV 28.8534
PTV 48.7185
OAR 1 3.7337
OAR 2 3.8100
Table 4.2 shows that GTV calculation result is compared to those from CTV and PTV, while calculation result of OAR1 volume, which is the right eye, is almost the same as for OAR 2, which is the left eye. Calculation results for each target volume and their 3D visualizations can be used as guidance in the process of Treatment Planning System (TPS).
CONCLUSION
This research has delineated target volume head images from MRI scans on the axial position. The target volumes calculated comprise GTV (Gross Tumor Volume), CTV (Clinical Target Volume), PTV (Planning Target Volume), and OAR (Organ at Risk). Image segmentation was carried out using the active contour method. Segmentation results for each slice were then calculated for their area, which in turn were integrated, to obtain the target volume. The final outcomes are calculated target volume and 3D visualization of each target. Both results are parts of the Treatment Planning System (TPS) that provides guidance in radiotherapy.
ACKNOWLEDGMENT
This research was funded by the Indonesian Directorate General of Higher Education Program in 2016.
REFERENCES
[2] Barret, A., Dobbs, J., Morris, S., and Roques, T., 2009,
Practical Radiotherapy Planning, Hodder Arnold, an imprint of Hodder Education, an Hachette UK Company.
[3] Cherry, P. and Angela, D., 2009, Practical Radiotherapy, Physics and Equipment, 2nd Edition,
Wiley-Black Well, Singapore.
[4] Sarathi, M.P., Ansari, M.A., Uher, V., Burget, R., and Dutta, M.K., 2013, Automated Brain Tumor segmentation using novel feature point detector and seeded region growing, in: Telecommunications and Signal Processing (TSP), 36th International Conference on, IEEE, pp. 648–652.
[5] Basyid, F. and Adi, K. 2014, Segmentasi Citra Medis untuk Pengenalan Objek Kanker menggunakan Metode Active Contour, Youngster Physics Journal, Vol.3, No.3, Fakultas Sains dan Matematika, Universitas Diponegoro, Semarang.
[6] Aslian, H., Sadeghi, M., Mahdavi, S. R., Mofrad, F. B., Astarakee, M., Khaledi, N., and Fadavi, P., 2013,
Magnetic Resonance Imaging-Based Target Volume Delineation in Radiation Therapy Treatment Planning for Brain Tumors Using Localized Region-Based Active Contour, Vol. 87, Issue 1, Pages 195-201, International Journal of Radiation Oncology Biology Physics. [7] Maslebu, G., Adi, K., and Suryono, 2016, Using
computer aided system to determine the maximum depth of visualization of B-Mode diagnostic ultrasound image, Journal of Physics: Conference Series 694 (1), 012052.
[8] Maslebu, G., Adi, K., and Suryono, 2015, Effect of gain changing to maximum visualization depth on diagnostic ultrasound B-mode image, International Journal of Applied Engineering Research 10 (13), pp. 33449-33452.
[9] Pamungkas, A., Adi, K., and Gernowo, R., 2015, Identification of plasmodium falciparum development phase in malaria infected red blood cells using adaptive color segmentation and decision tree based classification, International Journal of Applied Engineering Research 10 (2), pp. 4043-4056.
[10] Adi, K., Pujiyanto, S., Gernowo, R., Pamungkas, A., and Putranto, A. B., 2014, Identification of plasmodium falciparum phase in red blood cells using artificial neural networks, International Journal of Applied Engineering Research 9 (22), pp. 13917-13924. [11] Adi, K., Pujiyanto, S., Nurhayati, O.D., and
Pamungkas, A., 2016, Beef quality identification using color analysis and k-nearest neighbor classification, Proceedings - 2015 4th International Conference on Instrumentation, Communications, Information
Technology and Biomedical Engineering, ICICI-BME 2015.
[12] Podgorsak, E. B., 2005., External Photon Beams: Physical Aspects in Radiation Oncology Physics: A Hand Book for Taechers and Student, Vienna, Publishing Section IAEA, Austria.
[13] International Commission on Radiation Units & Measurements (ICRU), I993, Prescribing, Recording, and Reporting Photon Beam Therapy, The International Commision on Radiation Units and Measurements 7910, Woodmont Avenue Bethesda, Maryland.
[14] International Commission on Radiation Units & Measurements (ICRU), 1999, Prescribing, Recording, and Reporting Photon Beam Therapy (Supplement to ICRU Reports 50), The International Commision on Radiation Units and Measurements, Woodmont Avenue Bethesda, Maryland.
[15] Caselles, V., Kimmel, R., and Sapiro, G., 1997,
![Figure 2.1 Graphical representation of the volumes of interest, as defined [8,9].](https://thumb-ap.123doks.com/thumbv2/123dok/3821812.1834562/2.595.70.255.80.198/figure-graphical-representation-volumes-defined.webp)
![Figure 2.2. Active contour as a group of controlled coordinate points [15].](https://thumb-ap.123doks.com/thumbv2/123dok/3821812.1834562/3.595.309.546.69.594/figure-active-contour-group-controlled-coordinate-points.webp)