Proposition of Regression Equations to
Determine Outdoor Thermal Comfort in Tropical
and Humid Environment
Sangkertadi
1and Reny Syafriny
1AbstractThis study is about field experimentation in order to construct regression equations of perception of thermal-comfort for outdoor activities under hot and humid environment. Relationships between thermal-thermal-comfort perceptions, micro climate variables (temperatures and humidity) and body parameters (activity, clothing, body measure) have been observed and analyzed. 180 adults, men, and women participated as samples/respondents. This study is limited for situation where wind velocity is about 1 m/s, which touch the body of the respondents/samples. From questionnaires and field measurements, three regression equations have been developed, each for activity of normal walking, brisk walking, and sitting.
Keywords tropical humid, outdoor, comfort, urban, pedestrian
Abstrak—Studi ini mengenai eksperimentasi ruang luar untuk menyusun persamaan regresi tentang kenyamanan termis manusia di ruang luar khususnya di iklim tropis lembab. Hubungan antara persepsi rasa panas, variabel-variabel iklim mikro (suhu udara, suhu radiatif, dan kelembaban) dan parameter tubuh (aktifitas, pakaian dan ukuran) dievaluasi dan dianalisis. Sebanyak 180 orang dewasa, laki-laki, dan perempuan berpartisipasi sebagai sampel atau responden. Studi ini dibatasi pada kondisi dimana angin hanya bertiup konstan sekitar 1 m/s yang menyentuh tubuh. Berdasarkan hasil kuesioner dan pengukuran lapangan, dapat dibuat 3 persamaan regresi masing-masing untuk aktifitas berjalan normal, berjalan cepat dan duduk diruang luar.
Kata kunciiklim tropis lembab, ruang luar, kenyamanan termis, kota, pejalan kaki
I.INTRODUCTION3
odel formulation for quantifying thermal comfort perception is, generally based on empirical approaches from laboratory studies on the subject (human) in an activity and obtain certain climatic conditions. It was during the last decades developed by experimentation in the rooms (indoor spaces), which became the subject of research aimed to develop and establishing criteria for technology and design of indoor spaces (architecture). The principal orientation of thermal comfort criteria is for standardization of buildings types and equipment that are energy efficient and environmentally friendly. Fanger's work [1] which produced the PMV, that is a scale of human thermal comfort inside a closed room, still used as reference by many authors. But in this case the problem of climate that occur in outdoor space may be different from the situation of an indoor space. The perception level of comfort by the human being in indoor space would be different if people are in the outdoor.
Similarly, the difference concerning perceptions of thermal comfort on geographical zones, where the problems of thermal comfort in cold climates will be different to that occurring in humid tropical climates. People who habitually live in a cold climate will feel the different comfort level compared to colleagues who live in a hot climate. Residents of tropical areas have feel cold at a temperature of 22 0C, while residents in cold a climates, at the same temperature may not yet feel cold.
In outdoor space (public open space/ pedestrian/ playground) which is also area of meeting place among
Sangkertadi and Reny Syafriny are with Department of Architecture, Faculty of Engineering, Universitas Sam Ratulangi, Manado, 95115, Indonesia. Email: [email protected] and [email protected].
different groups of communities, require comfort condition in order to support the success of such socializing. In general, humans are not individualistic, that is why they need public open space where they can realize the warmth of social relationships instinctively. Uncomfortable physical outdoor space will lead to disruption of such human instinctive and have an impact on social relations are not smooth as expected. If this desire is disrupted, people will psychologically feel uncomfort and may change the attitude significantly due to the will of nature that are not being met. One aspect of comfort in outdoor space of this context concerns the outdoor thermal comfort is also a major focus of this study. If people feel too hot or too cold in outdoor space, it will disturb their social relationships (communication, playing together) which are not comfortable among them. In a more technical view, the need for thermal comfort in outdoor, is discussed, since an increase of air temperature and humidity in urban areas. The increase of atmospheric temperature is actually due to the impact of global warming caused by human activities as the effects of urbanization and densities (people and buildings). Many of information shows that nowadays this has identified more than 50% of world population living in urban areas.
Efforts to develop methods of calculating the thermal comfort of outdoor space, has been done based on field studies in various climate (cold & moderate) but rather than in the humid tropical area. Hypothetically there are fundamental problems when apply such methods to the case of humid tropical climates where a significant deviation can occur (error of perception). Therefore the specific formulation is required for the calculation of outdoor thermal comfort in tropical and humid environment. Moreover this would be a valuable
contribution for development the theory of landscape, architecture and urban planning for the tropical humid environment.
This study has the aim to formulate the equation of the thermal comfort of pedestrians in outdoor space and in the humid tropical area. The study apply the methods of outdoor experimentation, questionnaires, measurements of the microclimate and statistical analysis. The location of this research is in the city of Manado (01°29' N, 124°51' E), Indonesia.
Research on modeling the thermal comfort calculations for outdoor space, especially in the case of humid tropical climate is still relatively rare, mostly more interested for the cases of indoor spaces. If anything, the model is based on empirical studies of outdoor space in cold and temperate climate areas, which are generally based on field studies in cities in America, Europe, Japan, China, and Australia. Such researches carried out for example by [3-7]. Model of calculation for thermal comfort that be generated through a number of studies by such researchers are not necessarily appropriate to be applied in cases of humid tropical climate, because of the possibility of differences in the perception of comfort by different people in different habitation.
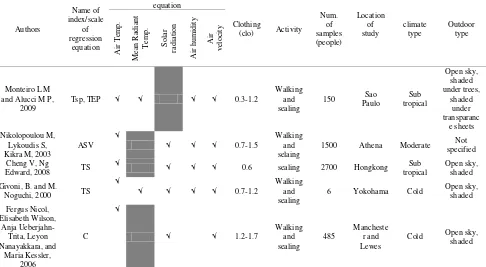
In the field of urban climate, Givoni [8] underlined how urban design may impact on comfort through urban heat island phenomenon. In 1998, Givoni [8] has also showed some regression equation concerning outdoor temperature in urban area which may influence of comfort in outdoor space, unfortunately he has not proposed equation of thermal comfort perception for outdoor at that time. Some of the researchers who focus on outdoor thermal comfort, have proposed regression equations to estimate the scale of outdoor thermal comfort, where the regression is functions of climate variables such are: solar radiation, air temperature, air humidity, wind speed, and radiant temperature, as shown in Table 1. In the table it appears that there is no study of outdoor comfort scale models that are specifically intended for the case of humid tropical climates. Some other researchers have also proposed the temperature index to measure the level of comfort for people who are at particular climatic environment. The temperature index (in 0C) is known as PET (Physiologically Effective Temperature) which is then used as the standard calculation of the thermal comfort of outdoor space in Germany [9], out_SET (Outdoor Standard Effective Temperature), and TEP (Effective Temperature Psychologically) by [10]. But again, the temperature index was also obtained through the data from field study conducted in the area where the environment is not humid tropical climates, so it remains to be evaluated for increase its precision when applied on a broader climate situation.
There are fundamental differences concerning method of calculation of the thermal comfort for indoor and outdoor. In outdoor there is a penetration of direct solar radiation which can affect significantly the level of human comfort. Contrary in the closed room, where the radiant temperature (from the internal surfaces: wall-ceiling-floor) has little difference with indoor air temperature, then the influence of the radiant temperature is not too strong for the thermal comfort level. In outdoor where the radiant temperature from
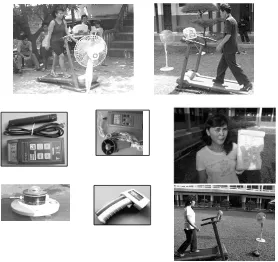
solar radiation (direct or indirect) can sting the surface of human skin so that logically may cause a feel of very uncomfortable for human being (Figure 1). In addition, air velocity in the outside is generally greater than in closed room, thus also affect the positive process of achievement of thermal comfort by convection and sweat evaporation. The people who have a habit to go outside from a closed room to get some fresh air and in order to get more feel comfortable by convective process, is a clear example in this case. People who walk in open space (pedestrian), likely need greater air velocity that can improve the feel of comfort by touching fresh air on the skin surface, particularly in the tropical and humid area. Fatigue due to walking activities, can be balanced by a sense of comfort by touching a fresh wind on the surface of human skin and encourage evaporation of sweat. A field study conducted by Arens E and Ballanti D [11] also found significant effect of wind speed on human comfort for people in walk activities in open space.
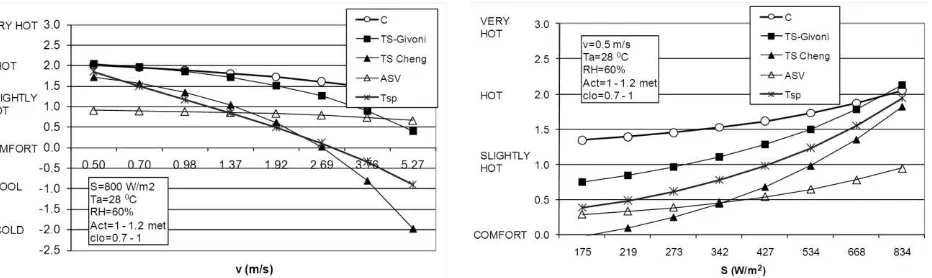
It is interesting to know the sensitivity of the models against the variations of the wind and sun's radiation, in which both climatic variables (wind flow and solar radiation from the sun) are believed to be sensitive in influencing perceptions of outdoor comfort. Through a simple numerical simulation, it is found that model Tsp [10] and model TS [12] is the most sensitive to wind speed (Figure 2). However, it is also shown that both Tsp and TS need air velocity 2.7 m/s to get a sense of comfort for people who are in outdoor and working a light activity (1 met), wearing a tropical cloth in approximately 0.7 to 1 clo with air temperature about 28 0
C. While the three other models are not sensitive to the wind and solar radiation, even by applying a wind speed of 5 m/s, have not been able to give a sense of comfort. Whereas, the wind speed limits that can disturb human at open space, is 5 m/s [11], from the view points of the mechanical movement of the winds that may disturb the movement of human in walking activity). Thus, the Tsp model [10] and the TS [12] will meet this criterion, because with the wind speed 2.7 m/s may give a thermal comfort. However, these results need to be re-evaluated when applied in tropical and humid areas, especially in areas that are fully exposed to direct sunlight.
models require to be developed or corrected when implemented for humid tropical case.
II.METHOD
Research’s protocol contains outdoor experiment, measurements and regression analysis. In outdoor experimentation, a treadmill was used as equipment or facility for the samples/ respondents/ subjects in walking activity. As noted that many of experimentations done by other researchers on the field of body thermal response and man biomechanics in moving/walking activity, usually use treadmill as equipment for the tests or examinations. For examples there are very good studies conducted by [2, 13-15] who used treadmill as equipment for modeling the activity of walking or running. Moreover from the study of [6] it is mentioned that the results obtained by treadmill modelling, have very small difference compared to the results by on land experimentation.
180 samples adults participated as respondents/subjects (aged between 17 to 50 years) consisted of 90 men and 90 women. All of them are in good health. Each subject's body was measured (weight and height). They were asked to dress a type of lightweight tropical clothing (0.5 Clo) as many as 90 subjects (45 men and 45 women), and 90 other subjects (45 men and 45 women) wear uniforms office (0.7 Clo).
The subjects were divided into 2 groups according to two types of location, that is in a place under the shade trees (protected from direct sunlight), and at other place where it was fully exposed to direct sunlight. These groups were then divided again into 3 sub groups of activities: normal walking, brisk walking and sitting. Table 2 shows this division of groups as well as respondents distribution.
We asked of their health situation and measured their height and weight before doing activity as sample/subject or respondent. All of the samples walked on treadmill with constant velocity 2.5 km/h that is assumed equivalent to be a speed of normal walking. A standing fan was used to blow a constant air velocity of about 1 m/s that touched directly at the body. The wind speed in this case is limited in the range "given" of 0.9 to 1.2 m/s which is a condition of "still air" or the wind blows enough and feels on the body.
Each respondent has been asked to walk for 2 minutes 5 times, with a pause of about 2 minutes each. After walking for 2 minutes, at a pause time, they asked to fill simple questionnaires concerning their thermal comfort perception and at the same time, measurement of surface skin temperatures, air temperature, humidity, land surface temperature and globe temperature were done. The body skin temperatures that were be measured were on chest, arms, calves, and thighs, in order to obtain the average value. Measurement equipments used were: thermo-hygrometer, anemometer, infrared thermometer, pyranometer and globe thermometer. Period and time of outdoor experimentation was from May to July 2011 at day time (08.00 am to 05.00 pm).
The data obtained from measurement and questionnaires were compiled and analyzed with focusing on the correlation among three groups: the value represent of thermal comfort perception, climate characterictics, and parameters of the human body. Then
proceed with regression analysis to obtain the regression equation Y = f (x, y), where Y is a number that indicates a sense of thermal comfort, and x is the climate variables (air temperature, mean radiant temperature, relative humidity, air velocity, and solar radiation), y is the parameters and variable of the body (height, weight, skin temperature and dress). Table 3 shows the definition of the thermal response and value of Y.
III.RESULTS AND DISCUSSION A. Normal Walking
At pause time, some of respondents already feel the fatigue which can be known from the questionnaires. At that time, then feel of comfort is associated with fatigue, so the data is not valid and have to be eliminated. The votes/answers of questionnaire for each respondent, so we have chance to get as many as 5x60 = 300 data votes/answers. However, because there are among respondents were feel fatigue, consequently reduce number of vote/answers, which in this case, the data finally obtained are 197 votes/answers of the respondents who walked normally, where 74 votes were obtained from the case in shaded situation and 123 votes/answers from activity under direct sunlight.
Range of air temperature at outdoor, surrounding the respondents was from 25.6 to 34.6 0C, and mean radiant temperature was from 27.9 to 57.2 0C (Figure 5-8).
Correlational analysis between the variables is to be a concern. The variables are: sense of comfort, air temperature, mean radiant temperature, air humidity, body size and temperature of the skin surface. The results of correlation analysis shown in Table 4, where the “highest” of correlation coefficient is the mean radiant temperature (Trm), ie, with correlation coefficient 0.4094 to the thermal perception value (vote value), which it means a correlation "less strong" between the two variables:Vote and Trm. But at overall, it is mean that Trm (mean radiant temperature) play the most important role as determinant variable, then followed by other variables that correlated "rather weak" ie, Ta (air temperature), and Clo (clothing factor). Other variables those are Adu (body size / area of human skin), v (wind velocity), RH (relative humidity) and Tsk (human skin temperature) do not adequate to influence, even it does not correlate or correlated very low with a level of comfort, where the coefficient of correlation to comfort level (vote), is relatively very small (Table 4).
from questionnaire was done, which is shown by Figure 9. It appears that the results by calculation are not far from the results of the questionnaire. However, if the results from the calculation are rounded or normalized, as in the questionnaire (-1,0,1,2,3), which is without decimal, then the outputs from regression calculation are more close to the results from questionnare. This needs to be carried out, given the response on "a comfort level" always valued "rounded", not "decimal", so that the calculation results using the regression equation should be rounded. So if YNormalWalking = 0.21, it is necessary to be normalized become YNormalwalking = 0, that is mean "feel comfortable". If the calculation of YNormalWalking = 0.57, it is necessary normalized become YNormalWalking = 1, that is "feel a slightly hot", so and so. So by way of normalized the calculation results from YNormalwalking when compared with the results of the questionnaire, there is no wide difference, as shown in Figure 10. Table 5 shows that there are differences and similarities between the results of questionnaires and by regression equation. The percentage comparison of the different results of calculations and the questionnare only achieve 39.09%, whereas the percentage of the similar results may reach 60.91% of the total 197 votes which were processed from 60 respondents. So as obtaining the same results (between calculation and vote) with percentage of greater than 50%, it can be said that the regression equation of YNormalWalking is a quite good. Furthermore Table 5, also described the comparison between the results of the regression and the references, and confronted to the results from questionnaire.
From the calculating results by using the reference using the formulas from references (Tsp, TS, and ASV), are different from the results obtained by the regression equations which is developed in this study. Tsp equation is, indeed close to YNormalWalking , due to the similarity of the base climate situation, where Tsp was developed from the results of field studies in sub-tropical climate that is not have a big difference with tropical humid climate. In contrast to other regression equations such as ASV, C, and TS, that showed a significantly different situation where the equations were developed based on the studies in locations where are not in tropical or sub tropical climate. Even the equations of C and TS that were developed and based from the researches in a cold environment, show very widely difference if compared to the results from questionnaire of this study (Table 5). 1. Brisk Walking
In the case of activity brisk walking with a speed of 5 km/h on a treadmill, there were 20 samples/respondents which walked under shading of trees and 40 samples/respondents which walked exposed to the direct sunlight. At the time of filling out the questionnaire after walking 2 minutes umpteenth time, some of respondents feel of fatigue/tired. At that time, the feel of uncomfortable has been associated with fatigue, so that the data have to be eliminated, because this is invalid data. It is underlined that the study is focused for the
people in normal condition without any feel of fatigue. If all the samples/respondents were not tired in each stage of activity, it would be able to get 5 (five) votes/answers of the questionnaire from each sample, we have chance to get as many as 5 x 60 = 300 data votes/answers. Consequently because of the respondents who got fatigue, lead to a reduced number of data votes/answers, which in this case, in the end, the data obtained only 213 votes/answers from the samples/respondents who walked speedy, consists of 73 votes from the samples who walked in a shaded area and 140 votes from the respondents who walked under the direct sunlight. The results of correlational analysis shown in Table 6, where the “highest” correlation coefficient is between the vote (comfort level) and the mean radiant temperature (Trm), ie, with correlation coefficient 0.403, which it means a correlation "less strong" between the two variables. If Trm will be used as inputs in the regression equation, then the variable Trm (mean radiant temperature) play the most important role as determinant variable in the equation, followed by another variable that correlated "rather weak" that is RH (relative humidity). Other variables those are: Adu (body size/area of human skin), v (wind velocity), and clo (clothing) do not adequate to influence, even it does not correlate or correlated very low with a level of comfort, where the coefficient of correlation to comfort level (vote), is relatively very small (Table 6).
In this case the range of air temperature at surrounding the body of respondents was from 25.8 to 33.1 0C, and mean radiant temperature was from 28.1 to 56.1 0C.
Based on the data from questionnaire, correlational analysis and climate measurement, regression equation for the case of brisk walking can be formulated as follows:
Y(BriskWalking) = -2.8627 + 0.052Ta + 0.0334Trm
+ 12349 RH + 0.0544Adu(R=0.42) (2)
The regression equation with R = 0.42, where is normally not good, but it is the best result in this case. 2. Sitting
In the case of sitting activity under shaded trees and not shaded while doing relax such as reading books, telling stories, etc performed by the 20 samples that were shaded under the trees and the 40 samples that are not shaded or their activities was under direct sunlight. There are only two people at the last minute were feeling tired so that their vote results can not be used. Thus, from the possibility of 300 answers, then have to be reduced become 298 answers that can be used as input to build a regression equation.
Y(Sitting) = -9.1878 + 0.2135Ta + 0.0544Trm
+ 1.8304 RH (R=0.76) (3) IV.CONCLUSION
The conclusions from the results of this study in principles are : (1) It has successfully formulated three regression equations of thermal comfort in outdoor space for people with activities of normal walking, sitting and brisk walking, limited for conditions where the wind blows with constant speed of about + 1 m/s. (2) There are significant differences between the characteristics of the regression equations of outdoor thermal comfort for various activities as well as different climates.
Significant difference between the results of the regression equation YNormalWalking with other references (Tsp, TS, C, and ASV) shows evidence of the hypothesis, where the calculation of outdoor comfort scale by the formulations that derived from the field studies in a climate not tropical humid, may not be used for situations in humid tropical climates. The regression equation, YNormalWalking that is developed from outdoor experimentation in humid tropical climate is most suitable for humid tropical climate situation with special
case for pedestrian that got a touch of wind about 1 m/s, dressed tropical clothing (0.5 to 0.7 Clo), whether shaded under trees or fully exposed to open-sky. YSitting, is the best regression equation which were found by this study with R=0.76. This is then a good recommendation for use in tropical humid area for people in sitting with moderate activity, and touched by wind blow about 1 m/s.
Contrary, YBriskWalking with R=0.42 is not a good regression equation. This equation may cause deviation when applied in a real situation.
Suggestion from this research is that the regression equations should also be developed by adding more variables values concerning of wind speed and type of clothing, in order to obtain more valid equations with greater value of regression coefficient.
ACKNOWLEDGEMENT
Gratitude and appreciation addressed to the Directorate of Research and Community Service (DP2M), Directorate General of Higher Education, Ministry of National Education of The Republic of Indonesia, for The Fundamental Research grant funding in 2011 and 2012 which produced this paper.
Figure 3. Outdoor experimentation and equipments for measurement
Figure 5. Distribution of air temperature measurement for each sample (Normal Walking shaded)
Figure 6. Distribution of mean radiant temperature for each sample (Normal Walking shaded)
Figure 7. Distribution of air temperature measurement for each sample
(Normal Walking unshaded) Figure 8. Distribution of mean radiant temperature for each sample (Normal Walking unshaded)
Normal WalkingUnshaded Normal WalkingUnshaded
Figure 9. Comparison the results by regression and from questionnaire Figure 10. Comparison the results by regression-normalized and from questionnaire
TABLE 1.
STUDIES ON REGRESSION EQUATION OF OUTDOOR THERMAL COMFORT BY SEVERAL RESEARCHERS
Authors
1500 Athena Moderate specified Not
Cheng V, Ng
ASV=Actual Sensation Vote, Tsp=Thermal Sensation Perception; TS=Thermal Sensation; C=Comfort perception
TABLE 2.
SAMPLES/ RESPONDENTS DISTRIBUTION
Activity clothing
0.5 clo
clothing 0.7 clo Male Female Male Female Normal Walking
under open sky
10 10 10 10
Normal Walking under shaded tree
5 5 5 5
Brisk Walking under open sky
10 10 10 10
Brisk Walking under shaded tree
5 5 5 5
Sitting under open sky
10 10 10 10
Sitting under shaded tree
5 5 5 5
TABLE 3. DEFINITION OF Y Y Thermal Comfort Perception -1 Cool
0 Comfort/ Neutral 1 Warm / Slightly hot
2 Hot
3 Very Hot
TABLE 4.
CORRELATION COEFFICIENTS BETWEEN VARIABLES (CASE: NORMAL WALKING)
Vote Adu Ta Trm RH v Clo Tsk
Vote 1
Adu 0.1028 1
Ta 0.2953 -0.2547 1
Trm 0.4094 -0.0515 0.1708 1
RH -0.01 0.3941 -0.6263 0.0307 1
v -.001 0.0447 0.2295 -0.1827 -0.2675 1
Clo 0.2876 0.3217 10-4 -0.0194 0.3216 0.2489 1
Tsk 0.0968 8 x 10⁻⁵ 0.2303 0.3172 -0.207 0.0108 -0.0216 1
TABLE.5
COMPARISON OF THE RESULTS
Regression equation and other fomulation for comparison
R
Percentage of results from
calculation compared to the
questionnaire
Nature of climate as case
Activity
Different Results
Same Results
YNormal Walking 0.56 39.09% 60.91%
Tropical
humid Normal Walking
Tsp (Monteiro & Alucci,
2009)
46.94% 53.06% Sub Tropical
Normal Walking & Sitting
ASV (Nikolopoulou, et
al, 2003) 47.72% 52.28% Moderate
Normal Walking & Sitting
TS (Givoni & Noguchi,2000)
94.92% 5.08% Cold
Normal Walking & Sitting
C (Fergus Nicol et al,
2006)
100% 0.00% Cold
Normal Walking & Sitting
TABLE 6.
CORRELATION COEFFICIENTS BETWEEN VARIABLES (CASE: BRISK WALKING)
Vote Ta Trm HR Adu Clo v
Vote 1
Ta -0.072 1 Trm 0.403 -0.203 1
HR 0.169 -0.578 0.239 1
Adu -0.016 0.097 -0.012 0.152 1
TABLE 7.
CORRELATION COEFFICIENTS BETWEEN VARIABLES (CASE: BRISK WALKING)
Vote Clo Adu Ta Trm v RH
Vote 1
Clo 0.2929 1 Adu 0.0415 -0.115 1
Ta 0.4772 0.0945 0.195 1 Trm 0.6785 0.2015 0.025
5
0.3393 1
v -0.208 -0.25 0.113 9
-0.068 -0.25 1
RH 0.0797 0.4703 -0.284 -0.375 -0.0639 -0.157 1
REFERENCES
[1] P. O. Fanger, Thermal Comfort, New York : McGraw-Hill, 1972.
[2] S. J. Lee and J. Hidler, “Biomechanics of overground vs. treadmill walking in healthy individuals”, Journal of Applied Physiology, vol. 104, 2008.
[3] A. Matzarakis, H. Mayer, and F. Rutz, “Radiation and Thermal Comfort”, in Proceeding of 6th Hellenic Conference in Meteorology, Climatology and Atmospheric Physics, 2003. [4] M. Nikolopoulou, S. Lykoudis, and M. Kikira, “Thermal
comfort in urban spaces: field studies in Greece”, in Proceedings of the fifth International Conference on Urban Climate, Lodz, Poland, September 2008.
[5] T. P. Lin, A. Matzarakis, and J. J. Huang, “Thermal Comfort and Passive Design of Bus Shelters”, in Proceeding of 23th PLEA, 2007
[6] G. Scudo and V. Dessi, “Thermal Comfort in Urban Space Renewal”, in Proceeding 23th PLEA, 2006.
[7] J. J. Spagnolo and R. De Dear, “A field study of thermal comfort in outdoor and semi-outdoor environments in subtropical Sydney Australia”, Building and Environment, volume 38, issue 5, May 2003.
[8] B. Givoni, Climate Considerations in Building and Urban Design, John Wiley & Sons, New York, 1998.
[9] H. Mayer and P. Hoppe, “Thermal comfort of men in different Urban Environments”, Theor. Appl. Climatology, vol. 38, 1987. [10] L. M. Monteiro and M. P. Alucci, “An Outdoor Thermal
Comfort Index for the Subtropics”, in Proceeding 26th PLEA, 2009.
[11] E. Arens and D. Ballanti, “Outdoor Comfort of Pedestrians in Cities”, in Proceedings of The Conference on Physical Environment, Upper Derby, PA, US, 1997.
[12] V. Cheng and E. Ng, “Wind for Comfort in High Density Cities”, in Proceeding of 24th PLEA, 2008.
[13] A. Ashjaran, A. Rashidi, and A, R. Ghazi-Saeidi, “Investigation on Some Ergonomics and Psychological Strains of Common Militarism Protective Clothing”, World Academy of Science, Engineering and Technology, vol. 77, 2011
[14] T. Fukazawa and G. Havenith, European Journal of Applied Physiology, vol. 106, no 1 2009.
[15] J. Vanhelst, G. Zunquin, D. Theunynck, J. Mikulovic, G. Bui-Xuan, and L. Beghin, “Equivalence of accelerometer data for walking and running: Treadmill versus on land”, Journal of Sports Sciences, vol. 27, Issue 7, 2009.