CHAPTER IV
RESEARCH FINDING AND DISCUSSION
In this chapter, the writer explained about the result of the study that consisted of theresult of thequestionnaire and the correlation between students’ learning motivation and writing learning strategy.
A. Research Finding
1. The result of Learning Motivations’ Questionnaire
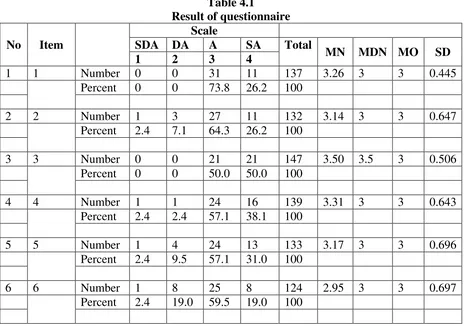
The questionnaire data was taken on September 2016 at English Department IAIN Palangka Raya. The sample used in this study was 42 students of English Study Program at IAIN Palangka Raya. The sample was given 15 simple questions which its result is summarized as follows.
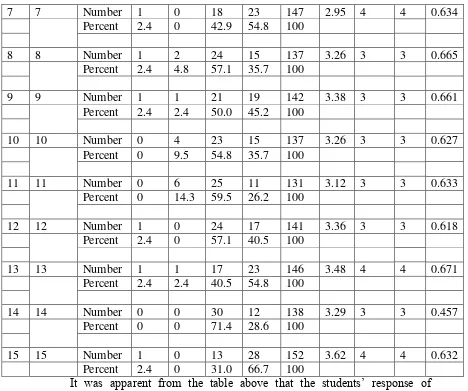
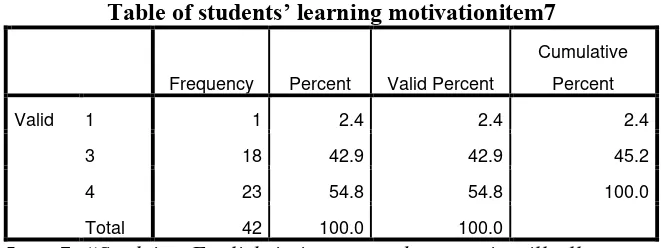
7 7 Number 1 0 18 23 147 2.95 4 4 0.634 Learning Motivation at IAIN Palangka Raya, as follows:
Table of students’ learning motivation item1
Frequency Percent Valid Percent
Cumulative
Percent
Valid 3 31 73.8 73.8 73.8
4 11 26.2 26.2 100.0
Total 42 100.0 100.0
Table of students’ learning motivationitem2
Frequency Percent Valid Percent
Cumulative strongly disagreed, 3 students (7.1%) disagreed, 27 students (64.3%) agreed, and 11 students (26.2%) strongly agreed.
Table of students’ learning motivationitem3
Frequency Percent Valid Percent
Cumulative
Percent
Valid 3 21 50.0 50.0 50.0
4 21 50.0 50.0 100.0
Total 42 100.0 100.0
Item 3, “I want to learn English so well that it will become natural to me”. There were 21 students (50.0%) agreed and 21 students (50.0%) strongly agreed.
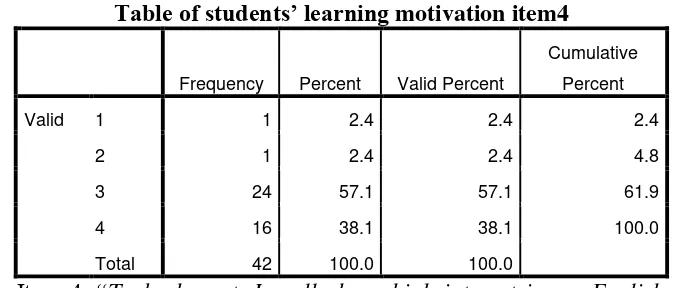
Table of students’ learning motivation item4
Frequency Percent Valid Percent
Table of students’ learning motivationitem5
Frequency Percent Valid Percent
Cumulative agreed, and 13 students (31.0%) strongly agreed.
Table of students’ learning motivationitem6
Frequency Percent Valid Percent
Cumulative agreed, and 8 students (19.0%) strongly agreed.
Table of students’ learning motivationitem7
Frequency Percent Valid Percent
Table of students’ learning motivationitem8
Frequency Percent Valid Percent
Cumulative disagreed, 24 students (57.1%) agreed, and 15 students (35%) strongly agreed.
Table of students’ learning motivationitem9
Frequency Percent Valid Percent
Cumulative
Item 9, “Studying English is important because it will be useful in getting a good job”. There were 1 student (2.4%) strongly disagreed, 1 student (2.4%), 21 students (50.0%) agreed, and 19 students (45.2%) strongly agreed.
Table of students’ learning motivationitem10
Frequency Percent Valid Percent
Cumulative
Table of students’ learning motivation item11
Frequency Percent Valid Percent
Cumulative
Item 11, “Studying English is important because other people will respect me more if I know English”. There were 6 students (14.3%) disagreed, 25 students (59.5%) agreed, and 11 students (26.2%) strongly agreed.
Table of students’ learning motivationitem12
Frequency Percent Valid Percent
Cumulative
Item 12, “I like my English class so much, I look forward to studying more English in the future”. There was 1 student (2.4%) strongly disagreed, 24 students (57.1%) agreed, and 17 students (40.5%) strongly agreed.
Table of students’ learning motivationitem13
Frequency Percent Valid Percent
Table of students’ learning motivation item14
Frequency Percent Valid Percent
Cumulative
Percent
Valid 3 30 71.4 71.4 71.4
4 12 28.6 28.6 100.0
Total 42 100.0 100.0
Item 14, “The more I get to know native English speakers, the more I like them”. There were 30 students (71.4%) agreed and 12 students (28.6%) strongly agreed.
Table of students’ learning motivationitem15
Frequency Percent Valid Percent
Cumulative
Percent
Valid 1 1 2.4 2.4 2.4
3 13 31.0 31.0 33.3
4 28 66.7 66.7 100.0
Total 42 100.0 100.0
Item 15, “Studying English is important because it will allow me to be more at ease with people who speak English”. There was 1 student (2.4%) strongly disagreed, 13 students (31.0%) agreed, and 28 students (66.7%) strongly agreed.
Figure 4.1
Based on the charts above, it showed that : 1. Intrinsic Motivation
a. The most students stated strongly agreed and agreed with “I want to learn English so well that it will become natural to me” as many 50.0%.
2. Extrinsic Motivation
4. Integrative Motivation
a. The most students stated agreed with the more I get to know native English speakers, the more I like them as many 71.4%.
2. The result of Writing Learning Strategy Questionnaire
The questionnaire data was taken on September 2016 at English Department IAIN Palangka Raya. The sample used in this study was 42 students of English Study Program at IAIN Palangka Raya. The sample was given 15 simple questions which its result is summarized as follows.
9 9 Number 0 16 20 6 116 2.76 3 3 0.692 Writing Learning Strategy at IAIN Palangka Raya, as follows:
Table of students’ writing learning strategies item1
Frequency Percent Valid Percent
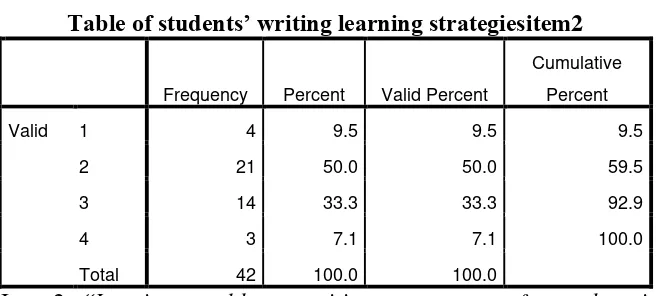
Table of students’ writing learning strategiesitem2
Frequency Percent Valid Percent
Cumulative often used this strategy, and 3 students (7.1%) always used this strategy.
Table of students’ writing learning strategiesitem3
Frequency Percent Valid Percent
Cumulative
Item 3 “I try out different ideas either orally or in writing to find out what I want to say”. There were 17 students (40.5%) sometimes used this strategy, 18 students (42.9%) often used this strategy, and 7 students (16.7%) always used this strategy.
Table of students’ writing learning strategiesitem4
Frequency Percent Valid Percent
sometimes used this strategy, 22 students (52.4%) often used this strategy, and 6 students (14.3%) always used this strategy.
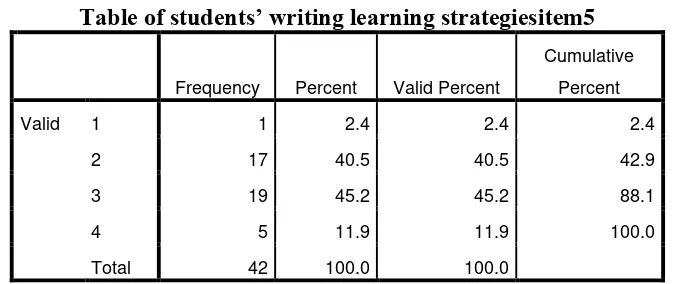
Table of students’ writing learning strategiesitem5
Frequency Percent Valid Percent
Cumulative to forget my ideas even if I experience spelling or grammatical problems”. There was 1 student (2.4%) never used this strategy, 17 students (40.5%) sometimes used this strategy, 19 students (45.2%) often used this strategy, and 5 students (11.9%) always used this strategy.
Table of students’ writing learning strategiesitem6
Frequency Percent Valid Percent
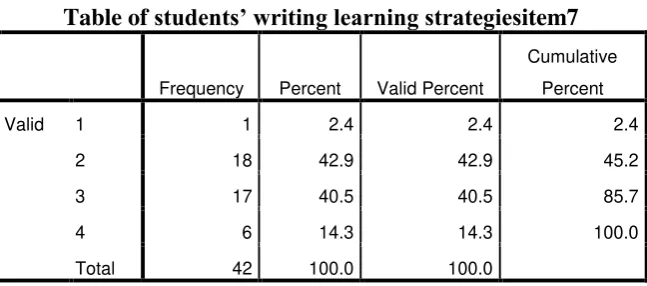
Table of students’ writing learning strategiesitem7
Frequency Percent Valid Percent
Cumulative student (2.4%) never used this strategy, 18 students (42.9%) sometimes used this strategy, 17 students (40.5%) often used this strategy, and 6 students (14.3%) always used this strategy.
Table of students’ writing learning strategiesitem8
Frequency Percent Valid Percent
Cumulative There were 11 students (26.2%) sometimes used this strategy, 24 students (57.1%) often used this strategy, and 7 students (16.7%) always used this strategy.
Table of students’ writing learning strategiesitem9
Frequency Percent Valid Percent
Cumulative
Table of students’ writing learning strategiesitem10
Frequency Percent Valid Percent
Cumulative
Table of students’ writing learning strategiesitem11
Frequency Percent Valid Percent
Cumulative ideas and organization and then grammar and spelling concerns”. There were 18 students (42.9%), 18 students (42.9%) often used this strategy, and 6 students (14.3%) always used this strategy.
Table of students’ writing learning strategiesitem12
Frequency Percent Valid Percent
Cumulative
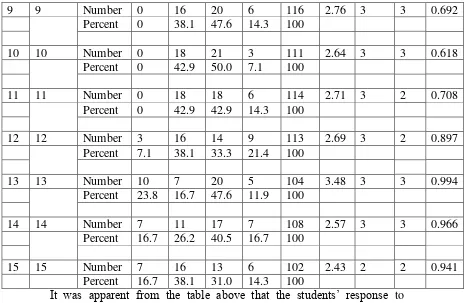
Item 12, “I motivate myself to keep writing by saying “come on”, “go on”,
students (38.1%) sometimes used this strategy, 14 students (33.3%) often used this strategy, and 9 students (21.4%) always used this strategy.
Table of students’ writing learning strategies item13
Frequency Percent Valid Percent
Cumulative
Item 13, “I try to overcome feelings of frustration, sadness, etc. When my writing is not as good as I would like to”. There were 10 students (23.8%) never used this strategy, 7 students (16.7%) sometimes used this strategy, 20 students (47.6%) often used this strategy, and 5 students (11.9%) always used this strategy.
Table of students’ writing learning strategiesitem14
Frequency Percent Valid Percent
Cumulative
Table of students’ writing learning strategiesitem15
Frequency Percent Valid Percent
Cumulative
Percent
Valid 1 7 16.7 16.7 16.7
2 16 38.1 38.1 54.8
3 13 31.0 31.0 85.7
4 6 14.3 14.3 100.0
Total 42 100.0 100.0
Item 15, “I give my writing to a friend or someone who is good at writing so that I have an opinion about my writing”. There were 7 students (16.7%)never used this strategy, 16 students (38.1%)sometimes used this strategy, 13 students (31.0%) often used this strategy, and 6 students (14.3%) always used this strategy.
The data above can be shown in the charts as follows:
Figure 4.2
0.00% 10.00% 20.00% 30.00% 40.00% 50.00% 60.00%
Writing Strategies
Based on the charts above, it showed that: 1. Memory strategies
a. Students whostated sometimes use strategiesrelate my composition topic to my background knowledge and I revise my old composition so as not to forget the mistakes I made and how to solve, both 50.0%.
2. Cognitive strategies
a. Students who stated often use strategies I reread frequently in an attempt to find out what I want to say as many 52.4%.
3. Compensation strategies
a. Students who stated often use strategies I make guesses when I can’t find the exact word I need as many 57.1%.
4. Metacognitive strategies
a. Students whostated often use strategies I am concerned with my lack of writing fluency and do something about it as many 50.0%.
5. Affective strategies
a. Students who often use strategies I have a set of priorities when revising my composition first, ideas and organization and then grammar and spelling concerns as many 50.0%.
6. social strategies
3. Result of Data Analysis
In the Result of Data Analysis was measured Testing of Normality, Homogeneity, and Linearity,
a. Testing of Normality, Homogeneity, and Linearity
The writer calculated the result of learning motivation and writing learning strategies test of the sample class by using SPSS 18.
The first step was testing the normality. It was used to know the normality of the data that was going to be analyzed whether both groups have normal distribution or not.
The next step was testing the homogeneity. It was used to know whether the sample class, that is decided, came from apopulation that had arelatively same variant or not. and the last step was testing linearity to know whether the variables were correlated linearly or not.
1. Testing Normality
Table 4.3
Testing of Normality One-sample Kolmogorov-Smirnov Test.
One-Sample Kolmogorov-Smirnov Test
Normal Parametersa,b Mean 124.8000 1.5000
Std. Deviation 15.77077 .50855
Most Extreme Differences Absolute .156 .337
Positive .156 .337
Negative -.147 -.337
Kolmogorov-Smirnov Z .856 1.847
Asymp. Sig. (2-tailed) .457 .002
a. Test distribution is Normal.
Based on the calculation using SPSS 18 program, the asymptotic significant normality of the data of the students’ learning motivation andwriting learning strategies score were 0.856 and 1.847. Then the normality both of the data were consulted with the table of Kolmogorov-Smirnov with the level of significance 5% (a=0.05). Since asymptotic significant of learning motivation = 0.856 and asymptotic significant of writing learning strategies= 1.847 ≥ a = 0.05, it could be concluded that the data were in normal distribution.
2. Test of Homogeneity of Variances
Table 4.4
Test of Homogeneity of Variances
Levene Statistic df1 df2 Sig.
.252 1 28 .620
Based on the result of homogeneity test, the Fvalue was 0.252 and the
significantvaluewas 0.620. The data were homogeneous if the significantvaluewas
higher than significant level a= 0.05. Since the significant value(0.252) was higher
that significant level a= 0.05, it could be concluded that the data were homogeneous. It meant that both of classes were in same variants.
3. Testing Linearity
Table 4.5
Testing Linearity Regression. ANOVA
Sum of Squares df Mean Square F Sig.
Between Groups 393.233 11 35.748 .304 .938
Within Groups 352.500 3 117.500
Based on the result of linearity test, the Fvalue was 0.304 and the
significantvalue was 0.938. The variables were correlated linearly if the
significantvalue was higher than significant level a= 0.05. Since the significant
value(0.938) was higher than significant level a= 0.05, it could be concluded that
the variables were correlated linearly.
b. Testing Hypothesis
The correlation students’ learning motivation and writing learning strategies of the sample class of the study were presented in the following table.
Table. 4.6
The description of learning motivation and writing learning strategies of the data achieved by the students of the sample class.
15 A15 152 102 23104 10404 15504 240374016
TOTAL 2083 1661 290005 184459 230693 3567741063
Averag
e 138.866667 110.7333333 19333.67 12297.27 15379.53 237849404.2
Highers
t Score 152 122 23104 14884 17052 290770704
Lowerst
score 124 100 15376 10000 12896 166306816
The writer used Pearson product moment correlation calculation with the significant level of the refusal of null hypothesis a= 0.05. The writer calculated by using manual calculation and also SPSS 18 program to test the hypothesis using Pearson product moment correlation. The criteria of ha were accepted when tobseved>ttableand ho was rejected when tobserved<ttable.
1. Testing hypothesis using manual calculation
To find out the correlation between learning motivation and writing learning strategies of the sample class, the writer used the person product moment correlation formula as follows:
𝑟𝑥𝑦 = 𝑁 𝑥𝑦 − 𝑥 . ( 𝑦)
{𝑁 𝑥2 − 𝑥 2} [𝑁 𝑦2− 𝑦 2 ]
𝑟𝑥𝑦 = 15.230693− 2083 . (1661)
15.290005− 2083 2} 15.184459− 1661 2
𝑟𝑥𝑦 = 3460395−3459863
(4350075−4338889) (2766885−2758921)
= 532
532
89085304
532
9438.5011521957
= 0.05636
Based on the manual calculation above, it was found that the rvalue was
-0.05636, then the rvaluewas consulted with the table of the interpretation coefficient
correlation r as follows:
Table 4.7
The Interpretation Coefficient Correlation r.
Interval Coefficient Level of Correlation
0,80 - 1,000 Very High
0,60 - 0,799 High
0,40 - 0,599 Fair
0,20 – 0,399 Poor
0,00 – 0,199 Very Poor
From the table of the interpretation coefficient correlation above, it can be seen that the rvalue 0.05636 was at the level “very poor” of correlation. So it meant
that the correlation between learning motivation and writing learning strategies of the sample class was avery poor correlation.
2. Testing Hypothesis using SPSS Program
Table 4.8
The calculation of Pearson Product Moment correlation using SPSS 18Program.
Learning
Motivation
Writing
Strategies
L.Motivation Pearson Correlation 1 .056
Sig. (2-tailed) .842
N 15 15
W.Strategies Pearson Correlation .056 1
Sig. (2-tailed) .842
N 15 15
The table showed the result of calculation using SPSS 18 program. from the table above, it meant that Ha was rejected. it was found that the result of rvalue= 0.056 was lower than rtable = 0.4821 at df 15 at the significant level of 5%
and 0.6055 at df 15 at the significant level of 1%.
From the data above, the calculation supported by scatter plot using SPSS 18. The result was as follow :
Table 4.9 Descriptive Statistics
Mean Std. Deviation N
Motivation 138.8667 7.29840 15
Writing Strategies 110.7333 6.15823 15
Table 4.10 Correlations
Motivation Writing Strategies
Pearson Correlation Motivation 1.000 .056
Writing Strategies .056 1.000
Sig. (1-tailed) Motivation . .421
Writing Strategies .421 .
N Motivation 15 15
Writing Strategies 15 15
From the result above, there was the high correlation between variable of X value was -0.056. The correlation value of learning motivation and writing learning strategies was 0.421. It means that it was negative correlation.
Table 4.11
a. All requested variables entered.
b. Dependent Variable: Motivation
From the table showed that the value of learning motivation and writing learning strategies entered and the variable showed that no one variable removed.
From the table above, the X value was 0.003 that the result from square of coefficient of correlation was (0.056)2 = 0.003136.The standart error of the estimeted was 7.56187.
The residual from the distribution was not normal, it meant that the data was spreaded out of the line. It showed that from the picture above, the data spreaded was not normall. It meant that the normality was rejected.
To conclude, it means that there is no significant contribution between learning motivation to the writing learning strategies of sample class.
3. Interpretation
concluded that the rvaluewas higher than the rtableat 5% and 1% significant level or
0.4821> 0.05636< 0.6055. It meant Ha was rejected and Ho was accepted. Furthermore, the result of calculation using SPSS 18 Program found that there was a negative correlation between students’ learning motivation and writing learning strategies. It proved by the value of rvaluewas lower than the rtableat 5%
and 1% significant level or 0.4821> 0.05636< 0.6055.
It can be interpreted based on the result of calculation that alternative hypothesis stating that there is a significant positive correlation between learning motivation and writing learning strategies of the fifth semester students of English study program students of IAIN Palangka Raya was rejected and the null hypothesis stating that there is a significant negative correlation between of learning motivation and writing learning strategies of the fifthsemester students of English study program students of IAIN Palangka Raya was accepted. It means that there is no significant correlation between learning motivation and writing learning strategies.
4. Discussion
strategies. ProductMoment correlation, it was found that the rvalue was 0.4821 and
the rtable was 0.05636. It meant that rvalue <rtable..It told that both students’ learning
motivation and writing learning strategies are correlated but in low interpretation. To support the result of testing hypothesis, the writer also calculated the hypothesis using SPSS 18 Program. The result of the analysis showed that the students who had high motivation, the using of their writing learning strategies are weak. It was proved by the value of rvalue = 0.4821 was lower than rtable= 0.056 at
df 15 at asignificant level of 5% and 0.6055. At df 15 at the significant level 1%. The findings of the study indicated that alternative hypothesis stating that there issignificant positive correlation between learning motivation and writing learning strategies of the fifth semester students of English study program students of IAIN Palangka Raya was rejected and the null hypothesis stating that there is a significant negative correlation between of learning motivation and writing learning strategies of the fifth semester students of English study program students of IAIN Palangka Raya was accepted. It meant that the students with high motivation did not theinfluence of their writing learning strategies. the rvalue
was 0.4821, it was interpreted as very poor correlation.
This finding is exactly consistent what Dornyei argues that it is important to remember that motivation is not fixed, and L2 teachers can work actively to improve L2 learners’ motivation.1In the process of learning, the students with high motivation did not affecttheir writing learning strategies.
The different result of the study to the theory which stated that someone will be asuccess in studying everything if there is desire (motivation) to learn might be caused the supporting factors in foreign language learning was very little or nothing. There were other factors which affected the students’ achievement such as the background of thefamily, the condition of theschool, etc.2
How authors motivate themselves differs widely, but motivation is presumably a necessary ingredient for attaining writing success. However, motivation is not a unitary construct, but rather is comprised of several related components, including self-efficacy beliefs, interest, perceived task value, attitudes, goal orientations, and attributions for success and failure. Also, there are potentially important mediators and moderators of the relationship between these motivation components and writing, as well as measurement issues that can obfuscate relevant and important findings.
By related the theory above, the writer conclude that motivation plays a very important role in the learning of English as a foreign language.So, when writing is used as a tool for intellectual and/or social development, students are more motivated.
2