CHAPTER IV
FINDINGS AND DISCUSSION
This chapter reports and discusses the outcome of the data analysis and presents the answers to the study’s research problems. The results and discussion
are ordered according to the two research problems. The main findings are presents below:
A. Description of The Data
1. The Result of Pre-Test and Post-Test Scores
The comparison pre-test and post test score of students’ vocabulary acquisitionwere presented in table 4.1 below:
Table 4.1
The Result of Pre-test and Post-test Scores
Experimental Class Control Class
Total 150 290 140 14 B-14 11 18 7
Mean 11,5 22,3 10,8 15 B-15 29 39 10
Lowest 6 12 16 B-16 19 25 6
Highest 18 30 Total 354 483 129
STDEV 4.034 6.074 Mean 22.12 30,18 8.1
Lowest 10 14
Highest 34 48
STDEV 8.156 10.008
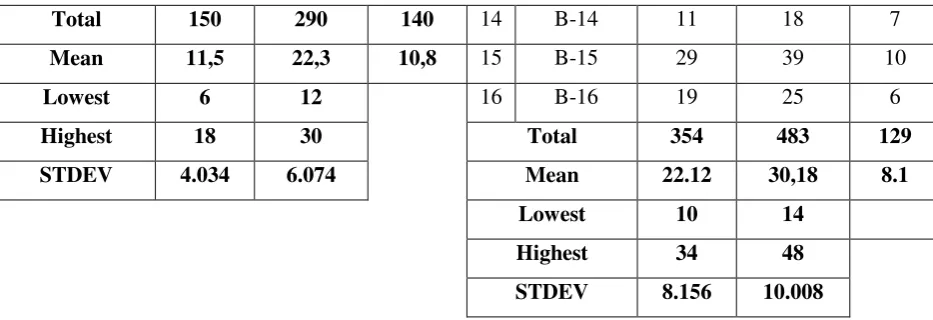
From the table above the mean scores of pre-test and post-test of experimental class were 11.5 and 22.3 respectively. Meanwhile, the highest scores pre-test and post-test of the experimental class were 18 and 30 respectively, then the lowest scores pre-test and post-test of the experimental class were 6 and 12. In addition, the mean scores pre-test and post-test of control class were 22.12 and 30.18 respectively. Afterward, the highest scores pre-test and post-test of control class were 34 and 48. And the lowest scores pre-test and post-test of the control class were 10 and 14 respectively.
2. The Result of Questionnaire
The Result of Questionnaire related to the students’ attitudes towards
incidental vocabulary learning to acquire the unknown word meanings in reading English texts and reading online newspapers, as shown below:
Table 4.2
The Result of Questionnaire about Attitudes towards Acquisition Words through Reading English Text
Reading English Texts
No Item Total Mean Percentage Level of Agreement
2 Q2 50 3,85 76,92 Moderately Agree
3 Q3 52 4 80 Agree
4 Q4 52 4 80 Agree
5 Q5 48 3,69 73,85 Moderately Agree 6 Q6 50 3,85 76,92 Moderately Agree 7 Q7 49 3,77 75,38 Moderately Agree 8 Q8 50 3,85 76,92 Moderately Agree
9 Q9 52 4 80 Agree
10 Q10 52 4 80 Agree
11 Q11 48 3,69 73,85 Moderately Agree
12 Q12 52 4 80 Agree
13 Q13 47 3,62 72,31 Moderately Agree 14 Q14 49 3,77 75,38 Moderately Agree 15 Q15 51 3,77 78,46 Moderately Agree
As shown in the table 4.2, the means of the students’ response to
questionnaire items 1-9 were between 3.69 and 4.00 ranging from agree to
moderately agree level. The students agreed that while reading English texts, they guessed the unknown word meanings from contextual clues in the text (mean = 4.00). The students moderately agreed that they acquired most vocabulary while reading English texts (mean = 3.92), and that English teachers should enhance vocabulary acquisition in context through reading (mean = 3.85). They moderately agree that they liked reading English texts in order to gain new words (mean = 3.85) and while reading familiar English texts, they could acquire vocabulary well (mean = 3.69). They
4.00). They moderately agree that the vocabulary they met while reading English texts could be remembered well (mean = 3.85) and that vocabulary acquisition in context gave them a sense of a word’s use and meaning (mean
= 3.77).
In terms of students’ concern about learning words incidentally
through reading to acquire the unknown word meanings, the results obtained from the questionnaire items 10-15 show that they worried about it to some extent. The means of their responses to these items were among 3.62-4.00 ranging from moderately agree to agree level. They were agreed that guessing unknown word meanings from the text context could lead to misinterpretation (mean = 4.00) and not knowing reading strategies made guessing unknown word meanings in the text context more difficult (mean = 4.00). They moderately agreed that not knowing guessing strategies made guessing unknown word meanings in the text context more difficult and took time and slowed down the reading process (mean = 3.62 and 3.69 respectively). They also moderately agreed that it was more difficult to guess the meaning of unknown words from the context when they were not familiar with the content of the text (mean = 3.77) and when they did not know the meanings of the words surrounding the target word (mean = 3.77).
Table 4.3
The Result of Questionnaire about Attitudes towards Acquisition Words through Reading Online Newspapers
Reading Online Newspapers
No Item Total Mean Percentage Level of Agreement
2 Q17 52 4 80 Agree
3 Q18 52 4 80 Agree
4 Q19 50 3,85 76,92 Moderately Agree 5 Q20 54 4,15 83,08 Agree 6 Q21 48 3,69 73,85 Moderately Agree 7 Q22 45 3,46 69,23 Moderately Agree 8 Q23 53 4,08 81,54 Agree 9 Q24 47 3,62 72,31 Moderately Agree 10 Q25 48 3,69 73,85 Moderately Agree 11 Q26 50 3,85 76,92 Moderately Agree 12 Q27 47 3,62 72,31 Moderately Agree 13 Q28 48 3,69 73,85 Moderately Agree
14 Q29 52 4 80 Agree
As seen in the table 4.3, the means of the students’ responses to the
questionnaire items 16-25 asking for their attitudes towards learning words incidentally through reading online newspapers to acquire the unknown word meanings were between 3.46-4.15 ranging from moderately agree to
(mean = 3.69) and that they could guess the meanings of unknown words while reading familiar news well (mean = 3.62). Moreover, they moderately agreed that they would read news in online newspapers to develop their vocabulary knowledge in the future (mean = 3.69). They were moderate in agreement that it was not difficult to guess the meaning of unknown word meanings while reading news in online newspapers (mean = 3.46) and they
agreed that words acquired from reading news in online newspapers could be retained well (mean = 4.08).
In terms of students’ concern about learning words incidentally
through reading news in online newspapers to acquire the unknown word meanings, the result obtained from the questionnaire items 26-29 reveal that they were upset about it to some an extent. The means of their responses to these items were among 3.62-4.00 which is the moderately agree to agree. They agreed that news in online newspapers did not motivate them to read because it used difficult vocabulary (mean = 3.85) and structures (mean = 3.62). It was difficult to guess the meanings of unknown word when they were not familiar with the content of the news (mean = 3.69) and they
B. Result of Data Analysis
1. The Result of Pre-Test Score
The students’ pre-test score were distributed in the following table in order to analyze the students’ knowledge before conducting the
treatment. The result of pre-test, as shown in table 4.4 below: Table 4.4
Pre-Test Score of Experimental and Control Class
Experimental Class Control Group
No Students'
Pre-Test Word Level Pre-Test Word
The table above showed that comparison of pre-test score achieved by experimental and control class students, both classes’ achievement were at the different level. It can be seen that from students’ score, the highest
scores were 18 and the lowest score was 6 of experimental class compared with control class, the highest scores were 34 and the lowest score 10.
a. The Result of Pre-Test Score of Experimental Class 1) Frequency Distribution
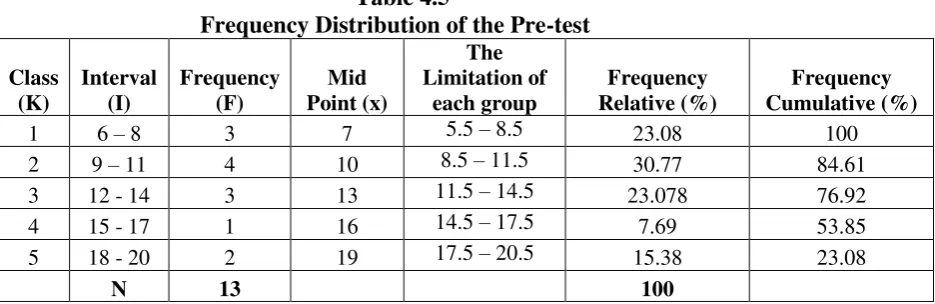
Based on the data above, it was known the highest score was 18 and the lowest score was 6. Afterwards, it was presented using frequency distribution, as shown in table 4.5 below:
Table 4.5
Frequency Distribution of the Pre-test
Class (K)
Interval (I)
Frequency (F)
Mid Point (x)
The Limitation of
each group
Frequency Relative (%)
Frequency Cumulative (%)
1 6 – 8 3 7 5.5 – 8.5 23.08 100 2 9 – 11 4 10 8.5 – 11.5 30.77 84.61 3 12 - 14 3 13 11.5 – 14.5 23.078 76.92 4 15 - 17 1 16 14.5 – 17.5 7.69 53.85 5 18 - 20 2 19 17.5 – 20.5 15.38 23.08
N 13 100
The frequency distribution of students’ pre-test score can also be
Figure 4.1
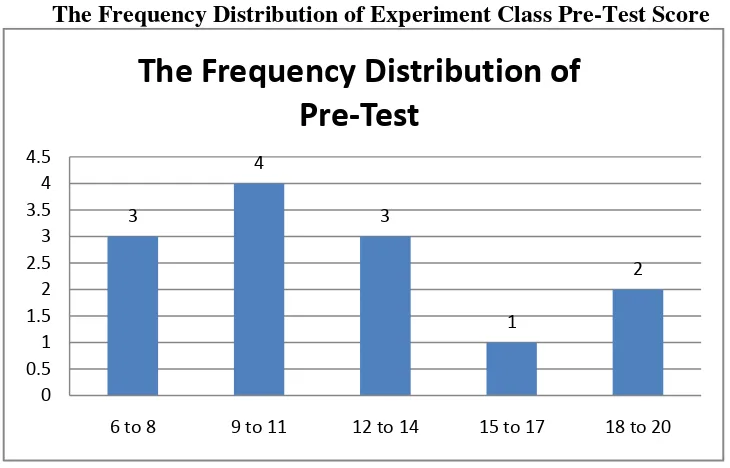
The Frequency Distribution of Experiment Class Pre-Test Score
It can be seen from the figure above about the students’ pre-test
score. There were three students who got score among 6-8. There were four students who got score among 9-11. There were three students who got score among 12-14. There was one student who got score among 15-17 and there were two students who got score among 18-20.
Based on the pre-test score of experiment class which is classified into word level, there were six students who got score among 6-10, so their word level was 100-1000 word level. There were seven students who got score between 11-18, so their word level was 1100-2000 word level.
3
4
3
1
2
0 0.5 1 1.5 2 2.5 3 3.5 4 4.5
6 to 8 9 to 11 12 to 14 15 to 17 18 to 20
The Frequency Distribution of
2) Normality Test
One-Sample Kolmogorov-Smirnov Test
Pretest_C
N 13
Normal Parametersa,b Mean 11,5385
Std. Deviation 4,03351 Most Extreme
Differences
Absolute ,147
Positive ,147
Negative -,099
Kolmogorov-Smirnov Z ,529
Asymp. Sig. (2-tailed) ,942
a. Test distribution is Normal. b. Calculated from data.
Based on the calculation used SPSS program, the asymptotic significance normality of experiment class was 0.942. Then the normality of experiment class was consulted with table of Kolmogorov- Smirnov with the level of significance 5% (α=0.05). Because asymptotic significance of
experiment was 0.942 ≥ 0.05. It could be concluded that the data was normal distribution.
b. The Result of Pre-Test Score of Control Class 1) Frequency Distribution
Table 4.6
The frequency distribution of students’ pre-test score can also be seen in
the following figure.
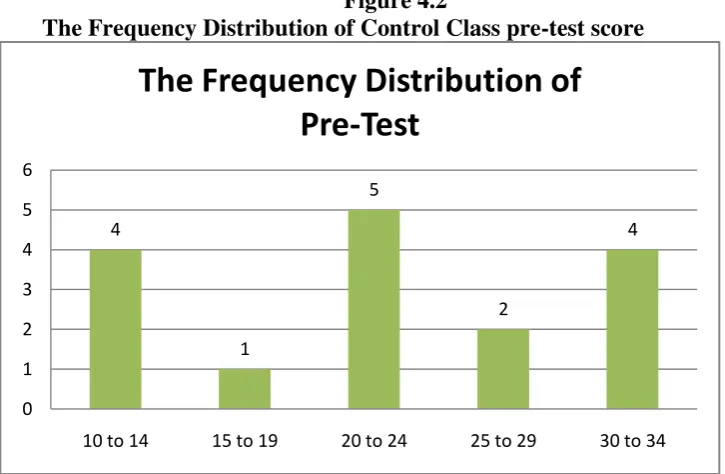
Figure 4.2
The Frequency Distribution of Control Class pre-test score
It can be seen from the figure above about the students’ pre-test score.
There were four students who got score among 10-14. There was one student who got score among 15-19. There were five students who got score among
20-24. There were two students who got score among 25-29. There were four students who got score among 30-34.
Based on the pre-test score of control class which is classified into word level, there were two students who got score10, so their word level was 100-1000 word level. There were three students who got score between 11-19, so their word level was 1100-2000 word level. There were eight students who got score between 21-30, so their word level was 2100-3000 word level. The last, there were three students who got score between 31-35, so their word level was 3100-4000 word level.
2) Normality Test
One-Sample Kolmogorov-Smirnov Test
Pretest_B
N 16
Normal Parametersa,b Mean 22,1875
Std. Deviation 8,25606 Most Extreme
Differences
Absolute ,162
Positive ,162
Negative -,130
Kolmogorov-Smirnov Z ,649
Asymp. Sig. (2-tailed) ,793
a. Test distribution is Normal. b. Calculated from data.
of experiment was 0.793 ≥ 0.05. It could be concluded that the data significance was 0.028. The significant of the Levene test statistic was lower than 0.05 (0.028 ≤ 0.05) or X2value ≥ X2table (5.406 ≥ 3.841). It meant that the scores were not violated the homogeneity.
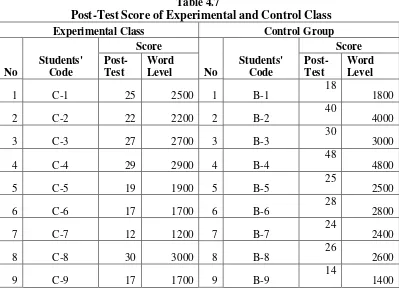
Table 4.7
Post-Test Score of Experimental and Control Class
Experimental Class Control Group
10 C-10 13 1300 10 B-10 31 3100
11 C-11 26 2600 11 B-11 41 4100
12 C-12 26 2600 12 B-12 45 4500
13 C-13 27 2700 13 B-13 31 3100
Total 290 14 B-14 18 18
Mean 22,3 15 B-15 39 39
Lowest 12 16 B-16 25 25
Highest 30 Total 483
STDEV 6.074 Mean 30,18
Lowest 14
Highest 48
STDEV 10.008
The table above showed that comparison of post-test score achieved by experimental and control class students. Both classes showed the different score, the highest score for the experimental class was 30 and 48 for the control class. And about the lowest score, for the experimental class was 12 and for the control class was 14. It meant that the experimental class and the control class have the different level in the term of word level after treatment. a. The Result of Post Test Score
1) Frequency Distribution
Table 4.8
Frequency Distribution of the Post-test
Class
The frequency distribution of students’ post-test score can also be seen in
the following figure.
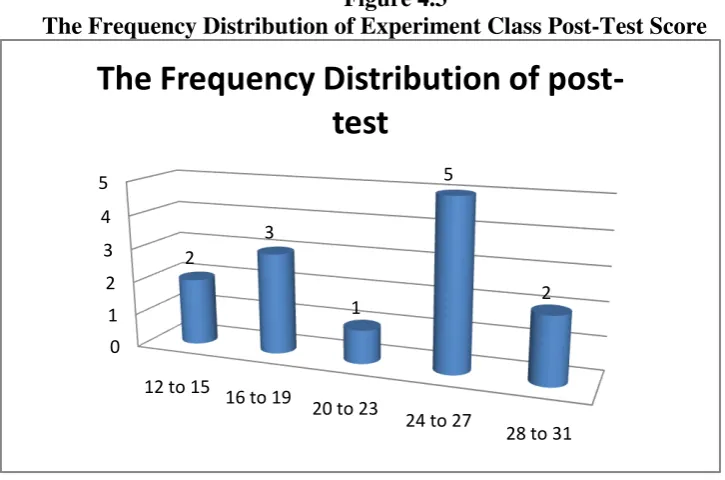
Figure 4.3
The Frequency Distribution of Experiment Class Post-Test Score
It can be seen from the figure above about the students’ post-test score.
among 20-23. There were five students who got score among 24-27. There were two students who got score among 28-31.
Based on the pre-test score of experiment class which is classified into word level, there were five students who got score12-19, so their word level was 11-2000 word level. There were eight students who got score between 22-30, so their word level was 2100-3000 word level.
2) Normality Test
One-Sample Kolmogorov-Smirnov Test
Posttest_C
N 13
Normal Parametersa,b Mean 22,3077
Std. Deviation 6,07433 Most Extreme
Differences
Absolute ,210
Positive ,117
Negative -,210
Kolmogorov-Smirnov Z ,756
Asymp. Sig. (2-tailed) ,617
a. Test distribution is Normal. b. Calculated from data.
Based on the calculation used SPSS program, the asymptotic significance normality of experiment class was 0.617. Then the normality of experiment class was consulted with table of Kolmogorov- Smirnov with the level of significance 5% (α=0.05). Because asymptotic significance of experiment was 0.617 ≥ 0.05. It
b. The Result of Post Test Score 1) Frequency Distribution
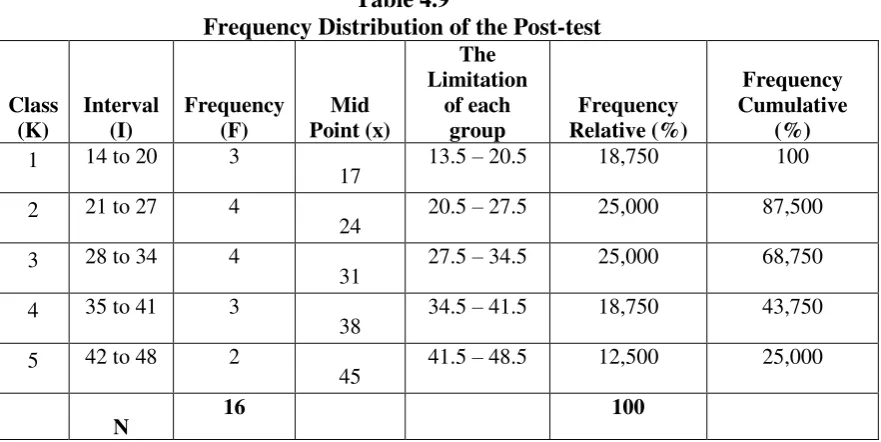
Based on the data above, it was known the highest score was 48 and the lowest score was 14. Afterwards, it was presented using frequency distribution, as shown in table 4.9 below:
Table 4.9
The frequency distribution of students’ post-test score can also be seen in
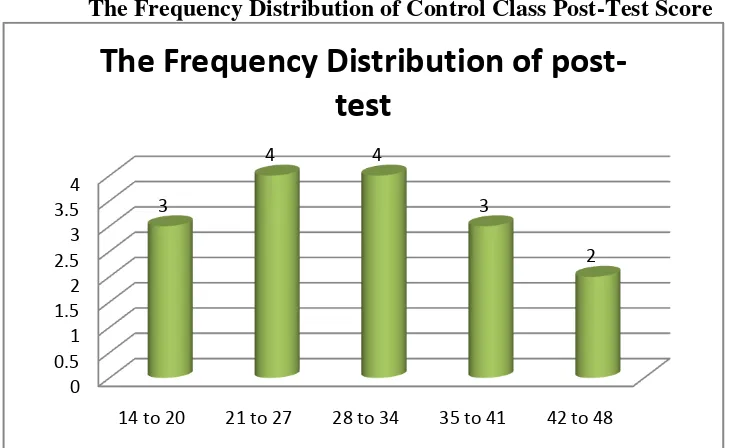
Figure 4.4
The Frequency Distribution of Control Class Post-Test Score
It can be seen from the figure above about the students’ post-test score.
There were three students who got score among 14-20. There were four students who got score among 21-27. There were four students who got score among 28-34. There were three students who got score among 35-41. There were two students who got score among 42-48.
Based on the post-test score of control class which is classified into word level, there were three students who got score14-18, so their word level was 11-2000 word level. There were six students who got score between 24-30, so their word level was 2100-3000 word level. There were four students who got score between 31-40, so their word level was 3100-4000. And there were three students who got score between 41-48, so their word level was 4100-5000.
0 0.5 1 1.5 2 2.5 3 3.5 4
14 to 20 21 to 27 28 to 34 35 to 41 42 to 48 3
4 4
3
2
The Frequency Distribution of
2) Normality Test
One-Sample Kolmogorov-Smirnov Test
Posttest_B
N 16
Normal Parametersa,b Mean 30,1875
Std. Deviation 10,00812 Most Extreme
Differences
Absolute ,155
Positive ,155
Negative -,123
Kolmogorov-Smirnov Z ,621
Asymp. Sig. (2-tailed) ,836
a. Test distribution is Normal. b. Calculated from data.
Based on the calculation used SPSS program, the asymptotic significance normality of control class was 0.836. Then the normality of control class was consulted with table of Kolmogorov- Smirnov with the level of significance 5% (α=0.05). Because asymptotic significance of control was 0.836 ≥ 0.05. It could
be concluded that the data was normal distribution. c. Homogeneity Test
Test of Homogeneity of Variance Levene
Statistic df1 df2 Sig.
IVA Based on Mean 2,538 1 27 ,123
Based on Median 2,292 1 27 ,142
Based on Median and with adjusted df
2,292 1 24,645 ,143
Based on trimmed mean
2,517 1 27 ,124
than 0.05 (0.123 ≥ 0.05) or X2value ≤ X2table (2.538 ≤ 3.841). It meant that the scores were homogeneous.
d. Testing Hypothesis
The researcher used Paired Sample T Test to test the hypothesis with significance level α= 0.05. The researcher used manual calculation and SPSS 18.0
Program to test the hypothesis using Paired Sample T Test and mean formula. The criteria of Ho was rejected when t value ≥ t table or -t value ≤ -t table and Ho was accepted if t value ≤ t table or -t value ≥ -t table. Then the criteria Ha is accepted when tvalue ≥ ttable or -t value ≤ -t table, and Ha is refused when tvalue ≤ ttable or -t value ≥ -t
table.
To measure the effect of reading online newspaper toward the students’
vocabulary acquisition incidentally, SPSS 18.0 statistic program was conducted in this study.
Based on the SPSS 18.0, the result shown below:
Paired Samples Statistics
Mean N
Std. Deviation
Std. Error Mean Pair 1 Before Reading Online
Newspapers
11,54 13 4,034 1,119
After Reading Online Newspapers
22,31 13 6,074 1,685
Paired Samples Correlations
N
Correlatio
n Sig.
Beside that, the researcher also used mean formula to know the students’ attitudes. The mean score of the students attitude showed that the students’
respond in reading English texts and reading online newspaper were moderately agree to agree respectively. The mean score for reading English texts was 3.62-4.00 and for reading online newspapers was 3.46-4.15. Beside that, the students gave positive attitudes while in teaching learning process also.
C. Discussion
The result of analysis showed that there was significant effect of reading online newspapers toward students’ vocabulary acquisition
incidentally by the third semester students of the English Education Department at IAIN Palangka Raya. It was shown that reading online newspapers gave significant effect toward students’ vocabulary acquisition
incidentally. With the significant value was higher than alpha (-(2.179) ≤ -6.150 ≥ -(3.055)).
There were several reasons why reading online newspaper can effect to students’ vocabulary acquisition incidentally, those are:
comprehension.74 Beside that, students can gain the unknown words incidentally. The finding suitable with Huckin and Coady state in Wilaiwan that incidental vocabulary acquisition through reading refers to the acquisition of unknown vocabulary as a by-product of reading.75
Second, by reading online newspapers, the students can guess the unknown words from the context, because of the contain of newspaper related with their life. Thus, the students can improve their vocabulary acquisition easily. The finding appropriate with the finding of Juhari Sham’s study which used newspapers as an authentic reading material
indicated that authentic reading materials were effective in helping the students to enhance and enrich their vocabulary acquisition.76
So, by reading online newspapers can improve their vocabulary size because of the students can acquire new vocabulary while they reading it, incidentally.
The last, from this finding, students showed the positive attitude while or after reading, not only reading English texts but also online newspapers. However, not over all the learning process had positive attitude especially in the term of how to guess the unknown words itself. This finding support the previous study from Wilaiwan’ finding on her
study that the result obtained on the 29-item questionnaire reveal that the
74
K. Michael Hibbard & Elizabeth A. Wagner. Assessing and Teaching Reading Comprehension and Writing, 3-5. Vol 4. 2003. Eye On Education: London. p. 1
75
Wilaiwan Lebkatem. loc. cit. p. 5 76
Juhari Sham bin Jusoh. 2016.
https://www.academia.edu/28041647/USING_AUTHENTIC_READING_MATERIALS_TO_
subjects had positive attitudes towards learning words through reading both type of the texts. However they showed some concerns about this vocabulary learning process and found it disconcerting especially when they did not know the word surrounding the target words and the content of the text. 77 Beside that, the students gave positive attitude when they followed the teaching learning process. Because, to measure the students attitudes which used questionnaire is not enough, but the process is important one.