34
CHAPTER III
RESEARCH METHOD
In this chapter, the writer presents research type, research design, variables of study, population and sample, reserach instruments, technique for collecting data and technique for analyzing data.
A. Research Type
This study is classified into quantitative research. Quantitative research deals with question of relationship, cause and effect, or current status that writer can answer by gathering and statistically analyzing numeric data. It can be further classified as experimental and non-experimental.1
It was the study which compare the vocabulary mastery between the students who join English course and those do not join English course at tenth grade of SMAN 1 Pangkalan Bun, in order to find the similarities and the differences. The writer found of casual-effect based relationship or casual comparative research (Expost Facto research).
In this study the writer took the tenth grade of SMAN 1 Pangkalan Bun as subject of the study. The subjects were divided into two groups based on the student who join Englih course and do not join it. Then the two groups were tested to know the differences on their English vocabulary mastery.
1
35
B. Research Design
The writer uses the ex post facto method to do this research. Ex Post Facto research is a type of research that attempts to determine the causes for, or consequence of, differences that already exist in groups of individuals2. In doing this research, the writer will select students where their English course from randomly and then placed the chosen students into one of two groups, it based on who join in English course and those do not join in English course. The group will receive the same tests based on their syllabus of Englih subject then the writer compared the result of their tests. The design is as follows:
to = MD SEMD Where:
MD = Mean of Difference, The average of the various between variable I and variable II, it can obtain with the design is as follows : MD = ∑D
N
∑D = The sum of the various of varibale I(X) and variable II(Y) and it can obtain with the design is as follows: D = X – Y
N = Number of Cases
SEMD = Standard Error, it can obtain with the design is as follows: SEMD = SDD
√ N – 1
SDD = Standard Deviatation, it can obtain with the design is as follows:
2Ibid.,
36 SDD = √ ∑D2 – ∑D 2
N N
C. Variable of the Study
Based of this research, there are no dependent and independent variables. It just because this research does not focus on the treatment who will be given to the subject of study. Therefore, this research uses continuous variables. If a variable can take on any value between its minimum value and its maximum value, it is called a continuous variable. Continuous variables can have an infinite number of different values between two given points. As shown above, there cannot be a continuous scale of children within a family. If height were being measured though, the variables would be continuous as there are an unlimited number of possibilities3.
D. Population of Study
Population is the larger group to which a researcher wishes to generalize, it includes all members of a defined class of people, events, or objects4. Population of this research is the tenth grade of SMAN 1 Pangkalan Bun.
3
Dierkes, Meinolf; Hans Weiler and Ariane Antal (1987). Comparative Policy Research. Gower. p. 62.
4
37
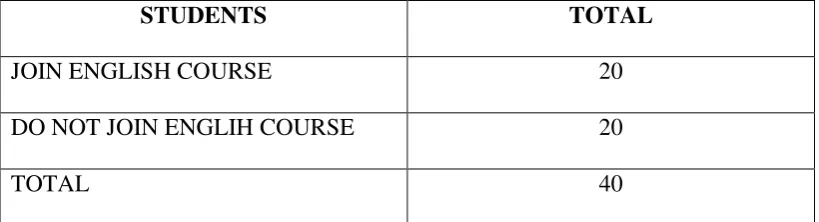
Table 3.1 Number of Respondent
STUDENTS TOTAL
JOIN ENGLISH COURSE 20
DO NOT JOIN ENGLIH COURSE 20
TOTAL 40
In this sense the writer took the tenth grade of SMAN 1 Pangkalan Bun who join English course and those do not join it. Containing 40 students (20 students from join English course and 20 students from do not join English course). The respondents were taken using purposive sampling, because the sample of this study were taken based on the certain purpose. Those are the students who join English course and those do not join English course.
Purposive sampling technique called "sampling technique with specific considerations'. This technique can be interpreted as a sampling process to determine in advance the number of samples to be taken, then the sample selection is done on the basis of specific objectives, provided it does not deviate from the characteristic-characteristics of the sample set.5 The writer used purposive sampling because it is a technique to take sample based on the sample’s
characteristics.
According to Sugiyono, the writer took 40 students, because before did this research the writer did not know how much the students who join English
5
Sugiyono, Metode Penelitian Kuantitatif, Kualitatif Dan R & D (Bandung: Alfabeta,
38
course. Therefore, the writer used purposive sampling so that the writer can know how much the students who join English course. Then, the writer took the total of students who do not join English course similar with students who join English course.
E. Research Instrument
In this study, the data collection was conducted while the students in the second semester. The data needed to prove and support this study. By this collecting data, the writer can compare the English vocabulary mastery between the students who join English course and those do not join English course at tenth grade of SMAN 1 Pangkalan Bun. There ia a instrument that is used in this study, it is writing test.
1. Writing Test
Test is a systematic procedure for measuring a sample of behavior presumed to represent an educational or psychological characteristic6. The main data of this study is the data of the students’ ability in mastering vocabulary. In order to get the data, the writer conducted a test. It is conducted after the writer measure the validity and the reliability of the test instrument.
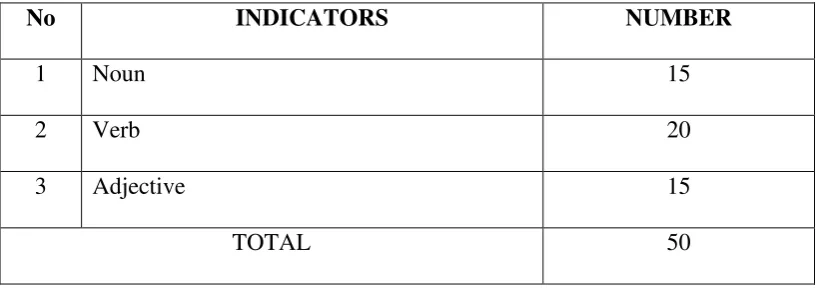
The test was constructed in the form of multiple choices which consisted of 50 items test. 15 items test of noun, 20 items test of verb, and 15 items test of adjective as shown in table 3.2. The writer took these three kinds
6Ibid.,
39
of vocabulary because they were included as three main forms of word. three main forms of word consist of noun, verb, and adjective7.
Table 3.2 The Content Specification of Test Items
No INDICATORS NUMBER
1 Noun 15
2 Verb 20
3 Adjective 15
TOTAL 50
According to Schmitt, the writer took the test to know the differences in mastering vocabulary of students who join English course and those do not join it used the form as three main forms of word, they are noun, verb, and adjective.
The writer gave the test to the students who join English course and those do not join English course(subject of the study). Based on the result of the test, it was known that the highest score of students who join English course was 89, the lowest score was 55, the mean score of the test result was 71,15. Whereas, the highest score from students who do not join English course was 87, the lowest score was 63, and the mean score was 74, 5. For more detail are shown in the Chapter IV.
7
40
2. Research Instrument reliability
The writer will examine the reliability of the item by using Kuder-Richardson formula 20 (K-R 20), which is based on the proportion of correct and incorrect responses to each of the items on a test and the variance of the total score. The formula is :
rxx =𝐾𝑠𝑥𝑠2−𝑋 (𝐾−𝑋 )
𝑥2(𝐾−1))
where :
rxx = reliability of the whole test K = number of items in the test
𝑠𝑥2 = variance of scores on the total test (squared standard deviation)
𝑋 = mean of the scores
3. Research Instrument validity
Validity is defined as the extent to which scores on a test enable one to make meaningful and appropriate interpretations.8
The validity of the test material in this research will be check by content validity. It is a form of validity which is based on the degree to which a test adequately and sufficiently measures the particular skill or behavior is set out to measure.
The first validity was construct validity, the writer assessed construct validity by having some colleagues such as teacher in the school were I did the research and the lecturer who has credibility to judge the instrument. In short, the writer did not do the try out of the instrument.
8
41
F. Data collection
The writer use interval data. Interval data is a data of measurement that orders objects or events and has points equidistant from one another9.To get collecting the objective data, the writer applies the steps as follows:
1. The writer observed the class. 2. The writer determined the class.
3. The writer gave the test to the students. 4. The writer gave score to the students’ answer. 5. The writer analyzed the obtained data using t-test. 6. The writer interpreted the analysis result.
7. The writer concluded the English vocabulary mastery of students who join English course and those do not join English course, whether there is difference or not, it based on the obtained data.
G. Data Analysis
The writer analyzes the data in three steps. There are individual scores, Conversion of Percentage Ranges, and then match t-test. To analyze the data, the writer apllies the steps as follows :
1. The writer collected the main data (score);
2. Before the writer arranged the distribution of frequency table, the writer determined the Range of Score, the Class Interval, and Interval of Temporary, using formula10:
9Ibid.,
42 a. The Range of Score (R)
R = H – L + 1 Where :
H = Highest score L = Lowest score
3. The writer arranged the collected score into the distribution of frequency of score table.
4. The writer calculated Mean, Median, and Modus using formula. a. Mean
∑X Mx =
N Where:
Mx = Mean value
Σfx = Sum of each midpoint times by it frequency
N = Number of case 11 b. Median
Mdn = ℓ + 1 2𝑁−𝑓𝑘𝑏
𝑓𝑖 𝑋𝑖
Where :
Mdn = Median
ℓ = Lower limit (lower limit from score that contain Median)
10
Abdulrahman Ritonga, Statistic Terapan Untuk Penelitian, Jakarta: Lembaga Penerbit Fakultas Ekonomi UI, 1987, p. 56.
11
43
fkb = Cumulative frequency that reside below the score that contain Median
ft = Genuine frequency N = Number of case
u = Upper limit (upper limit from score that contain Median)
fkb = Cumulative frequency that reside above the score that contain Median.12
c. Modus
Mo = ℓ + 𝑓𝑎 𝑓𝑎+𝑓𝑏 𝑥𝑖
Where : Mo = Modus
ℓ = Lower limit (lower limit from interval that contain Modus) fa = Frequency that reside above interval that contain Modus fb = Frequency that reside below interval that contain Modus u = Upper limit (upper limit from interval that contain Median) I = Interval class.13
5. The writer calculated the standard deviation using the formula: SD = ∑𝑓𝑥2
𝑁 -
∑(𝑓𝑥)2
𝑁
Where :
SD = Standard Deviation
12Ibid
., p. 97
13Ibid
44
∑𝑓𝑥2 = Sum of the multiplication result betwen each skor frekuency with
the squared deviation score. N = Number of cases 14
6. The writer calculated the variance homogeneity15: F = 𝑇𝑒𝑏𝑖𝑔𝑔𝑒𝑠𝑡 𝑣𝑎𝑟𝑖𝑎𝑛𝑐𝑒
𝑇𝑒𝑠𝑚𝑎𝑙𝑙𝑒𝑠𝑡 𝑣𝑎𝑟𝑖𝑎𝑛𝑐𝑒
7. The writer calculated the data by using t-test to test the hypothesis of the study.
8. The writer used the level of significance at 5%. If the result of test is higher than t table, it means Ha is accepted but if the result of test is lower than t table, it means Ho is accepted.
9. The writer used t test to conclude the answer of the problem of the study. a. If the tobserved is equal or higher than t value in the table ( with t table
sign), so the null hypothesis stating that there is no Mean difference from the both sample is rejected. It means the difference is significant. b. If the tobserved is lower than ttable, it means the null hypothesis stating that
there is no Mean difference from the both sample is accepted16. It means the difference is not significant.
10.The writer calculated the degree of freedom with the formula17: Df= ( N1 + N2- 2)
Where :
14Ibid.,
p.181.
15
Sugiyono, Metode Penelitian Pendidikan(Pendekatan Kuantitatif, Kualitatif, Dan R&D), Bandung: Alfabeta, 2007, p. 273.
16
Anas Sudijono, Pengantar Statistik Pendidikan , p. 284-285.
45 Df = degree of freedom
N = Number of cases
11.The writer determined the significant level of t observed by comparing the tobserved with the ttable.