46 CHAPTER IV RESULT OF THE STUDY
This chapter discusses about the Research Finding and Discussion. Research finding in this case consisted of Description of the Data of student who join English course, Description of the Data of student who do not join English course, and the result of data analyze (testing hypothesis using manual calculation and testing hypothesis using SPSS 19 program).
A. Description of the Data
This section described the obtained data of the difference in the english vocabulary mastery by the students who join in English course and those do not join in English course at tenth grade of SMAN 1 Pangkalan Bun. The presented data consisted of Mean, Median, Modus, Standard Deviation, Standard Error, and reliability value.
47
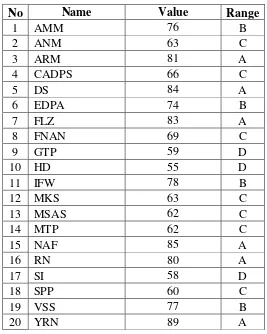
Table. 4.1 Description Data of Students who Join English Course
No Name Value Range
1 AMM 76 B
2 ANM 63 C
3 ARM 81 A
4 CADPS 66 C
5 DS 84 A
6 EDPA 74 B
7 FLZ 83 A
8 FNAN 69 C
9 GTP 59 D
10 HD 55 D
11 IFW 78 B
12 MKS 63 C
13 MSAS 62 C
14 MTP 62 C
15 NAF 85 A
16 RN 80 A
17 SI 58 D
18 SPP 60 C
19 VSS 77 B
20 YRN 89 A
Based on the data above, it can be seen that the students’ highest score was 89 and the student’s lowest score was 54. To determine the range of score, the class interval, and interval of temporary, the writer calculated using formula as follows:
The Highest Score (H) = 89 The Lowest Score (L) = 55
48
The Class Interval (K) = 1 + (3.3) x Log n = 1 + (3.3) x Log 20 = 1 + 4,293399
= 5,293399
= 5 Interval of Temporary (I) =𝑅
𝐾 =
35 5
= 7
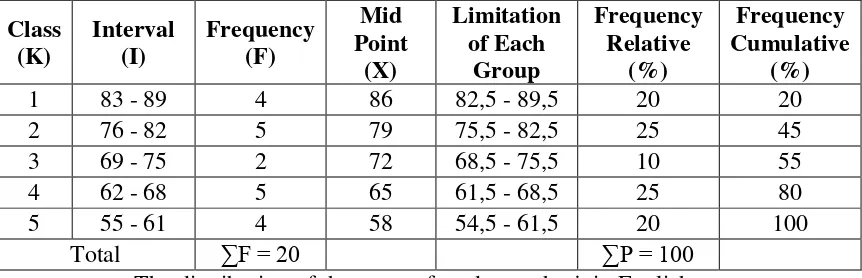
Thus, the range of score was 35, the class interval was 5, and interval of temporary was 7. It was presented using frequency distribution in the following table:
Table 4.2 Frequency Distribution of Students who Join English Course Test Score
Class (K)
Interval (I)
Frequency (F)
Mid Point
(X)
Limitation of Each
Group
Frequency Relative
(%)
Frequency Cumulative
(%)
1 83 - 89 4 86 82,5 - 89,5 20 20
2 76 - 82 5 79 75,5 - 82,5 25 45
3 69 - 75 2 72 68,5 - 75,5 10 55
4 62 - 68 5 65 61,5 - 68,5 25 80
5 55 - 61 4 58 54,5 - 61,5 20 100
Total ∑F = 20 ∑P = 100
49
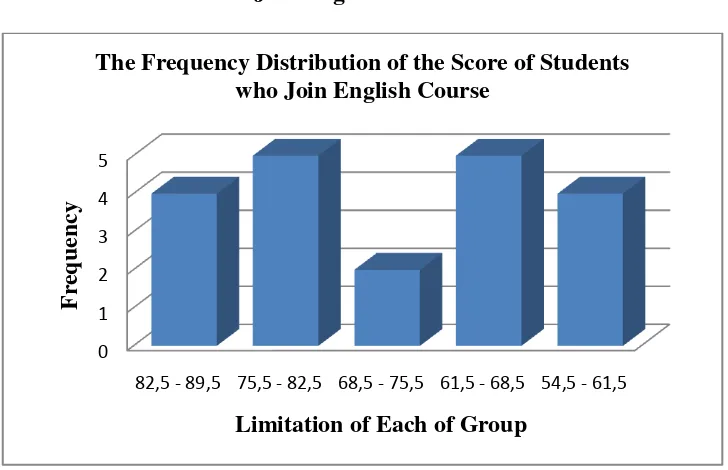
Figure 4.1 The Frequency Distribution of the Score of Students who Join English Course
It can be seen from the figure above about the score of students who join English course. There are four students who got score between 54,5 – 61,5. There are five students who got score between 61,5 – 68,5. There are two students who got score between 68,5 – 75,5. There are five students who got score between 75,5 – 82,5. There are four students who got score between 82,5 – 89,5.
The next step, the writer tabulated the scores into the table for the calculation of mean, median and modus as follows :
Table 4.3 The Calculation of Mean, Median and Modus of students who Join English Course Test Score
Interval (I)
Frequency (F)
Mid Point
(x)
Fx X' FX' Fka Fkb
83 - 89 4 86 344 2 8 4 20
76 - 82 5 79 395 1 5 9 16
0 1 2 3 4 5
82,5 - 89,5 75,5 - 82,5 68,5 - 75,5 61,5 - 68,5 54,5 - 61,5
F
re
q
u
en
cy
Limitation of Each of Group
50
69 - 75 2 72 144 0 0 11 11
62 - 68 5 65 325 -1 -5 16 9
55 - 61 4 58 232 -2 -8 20 4
N= 20 ∑Fx= 1423 ∑FX’= 0
a. Mean
Mx = ∑fx
𝑁
= 1423 20
= 71,15 b. Median
Mdn = ℓ + 1 2𝑁−𝑓𝑘𝑏
𝑓𝑖 𝑋𝑖
= 68,5 + 1 220−9
2 𝑋 7
= 68,5 + 1 2 X 7 = 72
c. Modus
Mo = u - 𝑓𝑎
𝑓𝑎+𝑓𝑏 𝑥𝑖
= 68,5 - 4 4+2 𝑥7
= 68,5 - 2 3 𝑥7
= 68,5 - 4,667 = 63,333 a. Reliability
rxx = 𝐾𝑠𝑥2−𝑋 (𝐾−𝑋 )
𝑠𝑥2(𝐾−1))
51 = 5724 ,5+1529,725
5610 ,01
= 1,29
The calculation above showed off mean value was 71,15, median value was 72, modus value was 63,333, and reliabilty value was 1,29. Then, the writer tabulated the scores of student’s who join English course into the table for the calculation of standard deviation as follows: Table 4.4 The Calculation of Standard Deviation of the Students who Join
English Course Test Score Interval
(I)
Frequency (F)
Mid Point
(X)
X' Fx' X'2 Fx'2
83 – 89 4 86 2 8 4 16
76 – 82 5 79 1 5 1 5
69 – 75 2 72 0 0 0 0
62 – 68 5 65 -1 -5 1 5
55 – 61 4 58 -2 -8 4 16
Total ∑F = 20 ∑Fx’ = 0 ∑Fx’2= 42
Standard Deviation SD = 𝑖 ∑𝑓𝑥′2
𝑁 -
∑(𝑓𝑥)2
𝑁
= 7 42 20 -
(0)2 20 = 7 2,1
= 7 x 1,449 = 10,143
2. The Description of Students who Do Not Join English Course
52
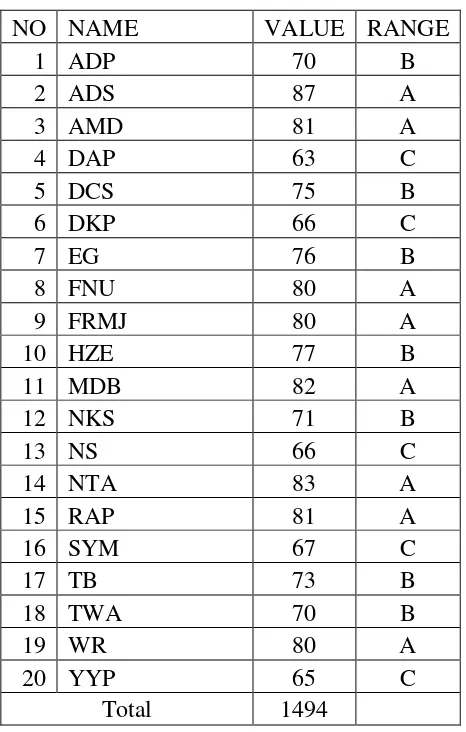
of central tendency (mean, median, and mode) and the measurement of deviation standard.In order to analyze the vocabulary mastery by students who do not join English course, it can be first distributed by the following table:
Table 4.5 The Description Data of the Students who Do Not Join English Course Test Score
NO NAME VALUE RANGE
1 ADP 70 B
2 ADS 87 A
3 AMD 81 A
4 DAP 63 C
5 DCS 75 B
6 DKP 66 C
7 EG 76 B
8 FNU 80 A
9 FRMJ 80 A
10 HZE 77 B
11 MDB 82 A
12 NKS 71 B
13 NS 66 C
14 NTA 83 A
15 RAP 81 A
16 SYM 67 C
17 TB 73 B
18 TWA 70 B
19 WR 80 A
20 YYP 65 C
Total 1494
53
score, the class interval, and interval of temporary, the writer calculated using formula as follows:
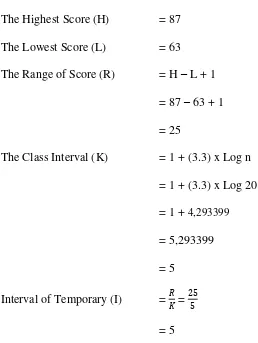
The Highest Score (H) = 87 The Lowest Score (L) = 63
The Range of Score (R) = H – L + 1 = 87 – 63 + 1 = 25
The Class Interval (K) = 1 + (3.3) x Log n = 1 + (3.3) x Log 20 = 1 + 4,293399
= 5,293399 = 5
Interval of Temporary (I) =𝑅
𝐾 =
25 5
= 5
Thus, the range of score is 25, the class interval is 5, and interval of temporary is 5. It is presented using frequency distribution in the following table:
Table 4.6 Frequency Distribution of Students Graduated from Public School Test Score
Class (K)
Interval (I)
Frequency (F)
Mid Point
(X)
Limitation of Each
Group
Frequency Relative
(%)
Frequency Cumulative
(%)
1 83 - 87 3 85 82,5 - 87,5 15 15
2 78 - 82 5 80 77,5 - 82,5 25 40
3 73 - 77 4 75 72,5 - 77,5 20 60
54
5 63 - 67 5 65 62,5 - 67,5 25 100
Total ∑F = 20 ∑P = 100
The distribution of the score of students who join English course can also be seen in the following Chart.
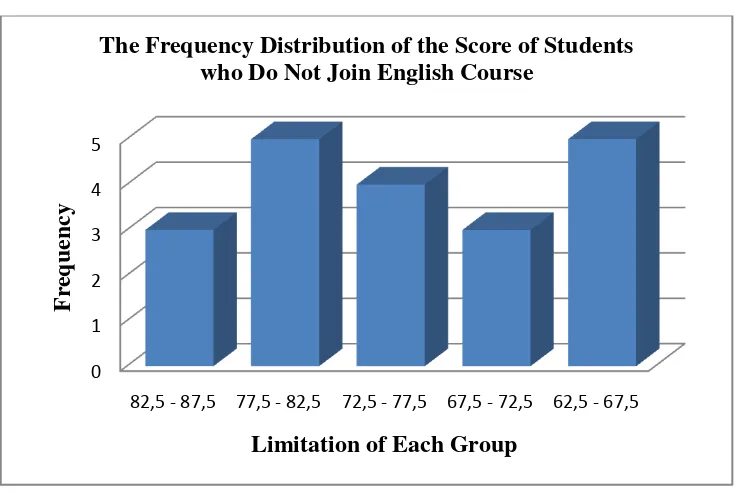
Figure 4.2 The Frequency Distribution of the Score of Students who Do Not Join English Course
It can be seen from the figure above about the score of students who join English course. There are five students who got score between 62,5 – 67,5. There are three students who got score between 67,5 – 72,5. There are four students who got score between 72,5 – 77,5. There are five students who got score between 77,5 – 82,5. There are three students who got score between 82,5 – 87,5.
The next step, the writer tabulated the scores into the table for the calculation of mean, median and modus as follows :
0 1 2 3 4 5
82,5 - 87,5 77,5 - 82,5 72,5 - 77,5 67,5 - 72,5 62,5 - 67,5
F
re
q
u
en
cy
Limitation of Each Group
55
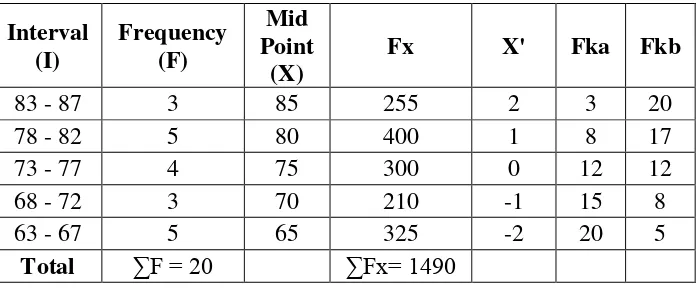
Table 4.7 The Calculation of Mean, Median and Modus of students who Do Not Join English Course
Interval (I)
Frequency (F)
Mid Point
(X)
Fx X' Fka Fkb
83 - 87 3 85 255 2 3 20
78 - 82 5 80 400 1 8 17
73 - 77 4 75 300 0 12 12
68 - 72 3 70 210 -1 15 8
63 - 67 5 65 325 -2 20 5
Total ∑F = 20 ∑Fx= 1490
a. Mean
Mx = ∑fx
𝑁
= 1490 20
= 74,5 b. Median
Mdn = ℓ + 1 2𝑁−𝑓𝑘𝑏
𝑓𝑖 𝑋𝑖
= 72,5 + 1 220−8
4 𝑋 5
= 72,5 + 2,5
= 75 c. Modus
Mo = u - 𝑓𝑎
𝑓𝑎+𝑓𝑏 𝑥𝑖
= 82 - 3 3+4 𝑥5
56 = 82 - 2,142
= 79,86 d. Reliability
rxx =𝐾𝑠𝑥𝑠2−𝑋 (𝐾−𝑋 )
𝑥2(𝐾−1))
= 50 6,97
2− 74,7(50−74,7)
6,972(50−1))
= 5724 ,5+1529,725 2380 ,5
= 1,79
The calculation above showed off mean value was 74,5. Median value was 75, modus value was 79,86, and the reliabilty value was 1,79.
Then, the writer tabulated the scores of student’s who join English course into the table for the calculation of standard deviation as follows:
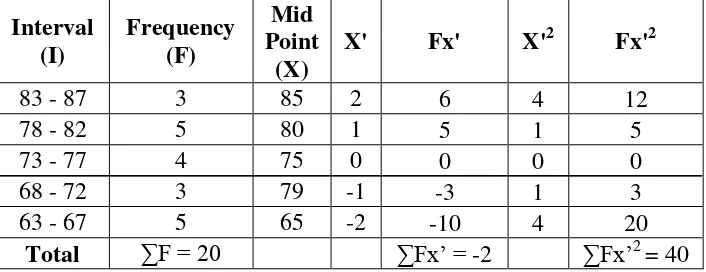
Table 4.8 The Calculation of the Standard Deviation of Students who Do Not Join English Course
Interval (I)
Frequency (F)
Mid Point
(X)
X' Fx' X'2 Fx'2
83 - 87 3 85 2 6 4 12
78 - 82 5 80 1 5 1 5
73 - 77 4 75 0 0 0 0
68 - 72 3 79 -1 -3 1 3
63 - 67 5 65 -2 -10 4 20
Total ∑F = 20 ∑Fx’ = -2 ∑Fx’2 = 40
Standard Deviation SD = 𝑖 ∑𝑓𝑥′2
𝑁 -
∑(𝑓𝑥)2
𝑁
= 5 40 20 -
57 = 5 x (1,414 – 0,1)
= 5 x 1,395 = 6,974
3. The Result of Data Analyze
In order to calculate the ttest, the writer used both manual calculation and SPSS 19 Program Calculation. Both results are expected to support the correct calculation each other.
a. Testing Hypothesis Using Manual Calculation
After knowing Standard Deviation of group I and group II, the writer calculated the “t” value to examine the hypothesis. But, first of all the writer calculated the variance homogeneity in order to adjust the
formula in calculating the “t” value. It is caused there are some formula to examine the comparative hypothesis with two sample, they are separated variance, pooled variance, and sample paired. Furthermore, in
58
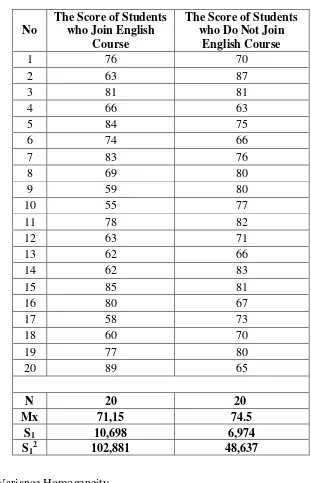
Table. 4.9 The Data of Test Scores of Students who Join English Course and those Do Not Join English Course in Tenth Grade of
SMAN 1 Pangkalan Bun
No
The Score of Students who Join English
Course
The Score of Students who Do Not Join
English Course
1 76 70
2 63 87
3 81 81
4 66 63
5 84 75
6 74 66
7 83 76
8 69 80
9 59 80
10 55 77
11 78 82
12 63 71
13 62 66
14 62 83
15 85 81
16 80 67
17 58 73
18 60 70
19 77 80
20 89 65
N 20 20
Mx 71,15 74.5
S1 10,698 6,974
S12 102,881 48,637
1) Variance Homogeneity F = 𝑇𝑒𝐵𝑖𝑔𝑔𝑒𝑠𝑡 𝑉𝑎𝑟𝑖𝑎𝑛𝑐𝑒
𝑇𝑒𝑆𝑚𝑎𝑙𝑙𝑒𝑠𝑡 𝑉𝑎𝑟𝑖𝑎𝑛𝑐𝑒
59 = 2,11
Moreover, the result variance homogeneity was compared with F table on numerator df ( 20-1 = 19) and denominator df (20 -1 = 19). Based on those df with significant 5%, than the percentage of F table was 2,17. It found that Fvalue was smaller than Ftable (2,11 < 2,17). Therefore, it can be said that the variance of those two groups was homogeneous.
Since the number of sample of those two groups was same ( N1 = N2 ), and the variance was homogen. Thus, the testing of t observed was used Pooled variance formula.
2) Testing of Normality test
Normality test is a test to know about what the writing test had given to the students normally, it showed on :
60
Table 4.10 Normality test of Students who Join Englsih Course
No x Z table Z f(Zi) f(kum) s(Zi)
F(zi)-S(zi)
1 53 -1,67834 0,4452 0,0548 1 0,05 0,0048
2 58 -1,21471 0,3907 0,1093 2 0,1 0,0093
3 59 -1,12198 0,3708 0,1292 3 0,15 -0,0208
4 60 -1,02926 0,3508 0,1492 4 0,2 -0,0508
5 62 -0,8438 0,3051 0,1949 5 0,25 -0,0551
6 62 -0,8438 0,3051 0,1949 6 0,3 -0,1051
7 63 -0,75108 0,2764 0,2236 7 0,35 -0,1264
8 63 -0,75108 0,2764 0,2236 8 0,4 -0,1764
9 66 -0,4729 0,1844 0,3156 9 0,45 -0,1344
10 69 -0,19472 0,0793 0,4207 10 0,5 -0,0793
11 74 0,268905 0,1064 0,6064 11 0,55 0,0564
12 76 0,454356 0,1736 0,6736 12 0,6 0,0736
13 77 0,547082 0,2088 0,7088 13 0,65 0,0588
14 78 0,639808 0,2389 0,7389 14 0,7 0,0389
15 80 0,825259 0,2967 0,7967 15 0,75 0,0467
16 81 0,917985 0,3212 0,8212 16 0,8 0,0212
17 83 1,103436 0,3665 0,8665 17 0,85 0,0165
18 84 1,196162 0,3849 0,8849 18 0,9 -0,0151
19 85 1,288888 0,4015 0,9015 19 0,95 -0,0485
20 89 1,659791 0,4525 0,9525 20 1 -0,0475
Total 1422 71,1 10,78449 0,0736 0,19 mean
STDEV Ltest Ltable
61
b) Normality test of Students who Do Not Join E`nglish Course Table 4.11 Normality test of Students who Do Not Join
Englsih Course
No x Z table Z f(Zi) f(kum) s(Zi)
F(zi)-S(zi)
1 63 -1,67757 0,4535 0,0465 1 0,05 -0,0035
2 65 -1,3908 0,4177 0,0823 2 0,1 -0,0177
3 66 -1,24742 0,3944 0,1056 3 0,15 -0,0444
4 66 -1,24742 0,3944 0,1056 4 0,2 -0,0944
5 67 -1,10404 0,3643 0,1357 5 0,25 -0,1143
6 70 -0,67389 0,2486 0,2514 6 0,3 -0,0486
7 70 -0,67389 0,2486 0,2514 7 0,35 -0,0986
8 71 -0,53051 0,2019 0,2981 8 0,4 -0,1019
9 73 -0,24375 0,0948 0,4052 9 0,45 -0,0448
10 75 0,043015 0,016 0,516 10 0,5 0,016
11 76 0,186396 0,0753 0,5753 11 0,55 0,0253
12 77 0,329778 0,1293 0,6293 12 0,6 0,0293
13 80 0,759923 0,2764 0,7764 13 0,65 0,1264
14 80 0,759923 0,2764 0,7764 14 0,7 0,0764
15 80 0,759923 0,2764 0,7764 15 0,75 0,0264
16 81 0,903305 0,3159 0,8159 16 0,8 0,0159
17 81 0,903305 0,3159 0,8159 17 0,85 -0,0341
18 82 1,046687 0,3531 0,8531 18 0,9 -0,0469
19 83 1,190068 0,383 0,883 19 0,95 -0,067
20 87 1,763595 0,4608 0,9608 20 1 -0,0392
Total 1494 Mean 74,7 STDEV 6,974389
Lhitung 0,1264 Ltable 0,19
The table showed that Ltest=0,01264 < Ltable=0,19, then the data of students who do not join English course distributed normally.
3) Testing of t observed (to) t = 𝑋 −𝑋1 2
𝑛1−1 𝑆12+ 𝑛2−1 𝑆22 𝑛1 +𝑛2−2
1 𝑛1+
62 t = 71,15− 74,5
20−1102 ,881 + 20−148 ,637 20 +20−2
1 20+
1 20
t = −3,5
1954 ,739 + 924 ,103 38
1 20+
1 20
t = −3,5 2878 ,842
38 0,1
t = −3,5 2878 ,842
38 0,1
t = −3,5 2,752
t = - 1,271
3) The degree of Freedom Df = N1 + N2 – 2
= 20 + 20 – 2 = 38
Df 38 at 5% level of significant = 2,024
(Ho was accepted)
Based on the result above, it can be presented by the following table: Table 4.13 The Result of Tobserved
t0 tt Df
-1,271 2,024 38
Where :
to : The value of tobserved tt : The value of ttable
63 Df : Degree of Freedom
Since the calculated value of tobserved (-1,271) was lower than t table at 5% (2,024) significant level or -1,271 < 2.024, it could be
interpreted that Ha stating that there is significant difference in English vocabulary mastery between students who join in English course and those do not join in English course was rejected and Ho stating that there is no any significant difference in English vocabulary mastery between who join in English course and those do not join in English course was accepted. It meant that there is no any significant difference in English vocabulary mastery between who join in English course and those do not join in English course at tenth grade of SMAN 1 Pangkalan Bun.
b. Testing Hypothesis Using SPSS 19 Program
Meanwhile, the calculation of Ttest using SPSS 19 Program can be seen in the following table :
Group Statistics Group
N Mean Std.
Deviation
Std. Error Mean
Join English Course 20 71,15 10,698 2,392
64
Independent Samples Test
Nilai Ujian Equal variances
assumed
Equal variances not assumed Levene's Test
for Equality of Variances
F 8,600
Sig. ,006
t-test for Equality of Means
T -1,243 -1,243
Df 38 32,679
Sig. (2-tailed) ,221 ,223
Mean Difference -3,550 -3,550
Std. Error Difference 2,856 2,856
95% Confidence Interval of the Difference
Lower -9,331 -9,362
Upper 2,231 2,262
65 B. DISCUSSION
The result of the analysis showed that there is no any significant difference in the English vocabulary mastery between the students students who join in English Course and those do not join in English course at tenth grade of SMAN 1 Pangkalan Bun. It could be proved from students’ score that the score of students who join in English course was not significant difference with the score of students who do not join in English course. It was found the mean of students who join in English course (X1) was 71,15 and the mean of students who do not join in English course (X2) was 74,5. Furthermore, the deviation standard of students who join in English course was 10,698 and the deviation standard of students who do not join in English course score was 6,974. Then, those results were compared using T-test with pooled variant formula and it was found that tobserved was -0,127 and ttable was 2,024. It meant, from the computation was found that tobserved < ttable.
Furthermore, the result of ttest calculation using SPSS 19 also showed that there is no anysignificant difference of English vocabulary mastery by the students who join in English Course and those do not join in English course at tenth grade of SMAN 1 Pangkalan Bun. It is proved by the value of tobserved that was lower than t table at 5% significance level ( -1,243 < 2,024).
66
emphasized1. It is different with the process in getting vocabulary in students who do not join in English course. It is suspected that the students who join in English course have higher score than the students who do not join in English course, but as a matter of fact, it was not. There is no any significant difference in the English vocabulary mastery between the students who join in English Course and those do not join in English course at tenth grade of SMAN 1 Pangkalan Bun.
According to Krashen, to be able to mastery vocabulary, students do not need a formal learning. Enough with the experience of communicating directly with the language, they can master it2. The result of this research support the
Krashen’s theory that stated if the students want to mastery English, especially
mastering vocabulary is not only in formal learning (school and course institution) but also the students are able to learn with their experience or another ways. The result show that there is no any significant difference between the students who join English course and those do not it in mastering vocabulary.
In the view of behaviorism approach, the ability to speak and understand a language by students obtained through the stimuli from the outside environment3. Thus, it can be a corelation that the student's vocabulary development is also dependent on the inputs received from the child outside.
Based on Chaer’s opinion that said to mastery vocabulary, the students can get from their environment. The students have each characteristics in learning vocabulary, not only in english course they are able to get many vocabulary, but also they are able to get in their environment. On the other word, English course
1
Mulyani, Model Pemerolehan Bahasa Asing , P. 133-134. 2
Krashen, English Made Easy, P. 26. 3
67
does not affect too much in student’s vocabulary if the students are taking the
course is not seriously.
In the other theory, according to Evelyn’s opinion students who take lessons in language course institutions are able to improve in terms of mastering vocabulary, phraseology, and pronunciation4. Therefore, in these days many parents who engage their children in language courses, so that their children can master many languages.
Based on the finding out of this research does not support of Evelyn’s opinion, because after the researcher analyzing the score of the students who join English course and those do not join it in mastering vocabulary, at tenth grade of SMAN 1 Pangkalan Bun does not find the significant difference between them or there is no any significant difference between them in mastering vocabulary.
The last, although in English course there is a special characteristic which different with who do not join in English course. Beside tutorial, strictly the students are controlled by the situation and condition in the English course. Thus, they do not have another choice to speak without using foreign language that must be used in their course conversation. Moreover, from language section of Englsih course also gives motivation to the students so that they use foreign language (English) to communicate in their course conversation. It will accelerate the successful of foreign language acquiring. By this statement is implied that the students who join in English course have mastered many vocabularies and there is a significant difference in the English vocabulary mastery with the students who
4
68
do not join in English course. Meanwhile, the statistical finding of this study doen not supported this statement, the result of this study showed that the students who join in English course’s score was almost same with the students who do not join
in English course’s score.
There is no any significant difference scores between the students who join in English course and who do not it in mastering vocabulary and the after the writer asked them, the writer are able to conclude some factors why there is no significant difference score between the students who join English course and who do not it in mastering vocabulary at tenth grade of SMAN 1 Pangkalan Bun, they
1. For the students who join English course
a. First, the material who students get in English course does not match with the material that they get in school. It effected the students achievement and their comprehensif in English subject.
b. Second, the students who join the course is not from their own self, but their parents ask them to join the English course so that the students are able to improve their skills in English, in fact the students join English course is not seriously.
c. Third factors is when the students in English course, their tutors do not teach them how to mastery vocabulary.
69
e. The fifth factors is they are week in memorizing, pronouncing, and translating the vocabulary.
2. For the students who join English course
a. The students who do not join English course are able to learn more about vocabulary from music, cinemas, reading books, and games that they always do in their daily life.
b. The students have methods to mastery vocabulary.