33
In this chapter the writer explains about research design, approach of the study, population and sample, data collection technique, data collection procedure, instruments of the study, instrument try out, instruments validity, instruments reliability, level of difficulty, and data analyze procedure.
A. Research Design
This study applied quasi-experimental design was not based on the random assignment of the subjects to the experiment group and control group. The design was chosen on the situation of the subject of the study.1
B.Approach of the Study
Base on the study, the writer used quantitative approach because the aim of the study to measure the effect of using multiple choice items test to the
students’ scores in learning vocabulary to the eighth grade students of SMP
Muhammadiyah Palangka Raya.2
The writer used nonrandomized control group pre-test post-test design. The design consisted of two groups that were chose without random, they were experimental group and control group. Both of groups were given pre-test before having treatment. The experimental group was given treatment ( teaching vocabulary by using multiple choice items test ) and the control group was not given treatment ( teaching vocabulary without using multiple choice items test ). After given the treatment for experiment class and without given the treatment for
1
Putri Dian Purnami Karang, Improving Reading Comprehension Denpasar : English Education Study Program Faculty of Teacher Training and Education Mahasaraswati University, p. 162
2
control class, both groups ( experiment and control group ) were given post-test. Finally, the result of post-test was compare used T-test.
The scheme of experimental design can be seen in the following table.3
Table 3.1 The Design of Experimental Research
Group Pre-test Treatment Post-test
Experiment Group Y I X Y 2
Control Group Y 1 - Y 2
Where :
E : Experiment Group C : Control Group X : Treatment Y 1 : Pre- Test Y 2 : Post- Test
C. Population and Sample
1. Population
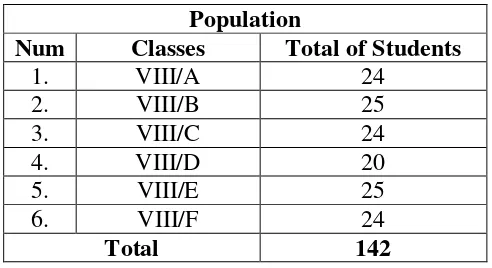
A population isdefined as all members of any well-defined class of people,events, or objects.4The population of this study was the students of the eight grade student of SMP Muhammadiyah Palangka Raya. There are 142 of the eighth grade students that devided into six classes.
Table 3.2 The Number of Eight Grade Students of SMP
Muhammadiyah Palangka Raya
3
Donald Ary dkk, Introduction To Research In Education, Canada : Wadsworth, 2010
4
Donald Ary, Lucy Cheser Jacobs, Chris Sorensen, Introduction to Research in Education,
Population
Num Classes Total of Students
1. VIII/A 24
2. VIII/B 25
3. VIII/C 24
4. VIII/D 20
5. VIII/E 25
6. VIII/F 24
Total 142
2. Sample
According to Arikunto, sample is some or represent of population that is researched.5 It is a group selected from population for observation in a study.
On this study, the writer determined two classes into two groups. Class VIII/1 and VIII/4 were chosen as the sample. They were 24 students of VIII/1 as experiment class and 20 students of VIII/4 as control class..
Based on the explanation above, the writer took two classes VIII/1 and VIII/4 which will be related to this study. The sample of the study was chosen by using cluster sampling, cluster sampling is to list all the members of a target population and select the sample from among them.
Table 3.3 Number of Sample
NO Group Class of student Number of students
5
1 E VIII/1 24
2 C VIII/4 20
Total Number 44
E : Experiment Group
C : Control
D.Data Collection Technique
The technique to cellecting the data, the writer used a test and
documentation. The writer used a test as technique to find data of students’ scores,
it was consisted of 30 items of multiple choices. Documentation used to find the number of students, condition of school, condition of students and syllabus.
E.Data Collection Procedure
To get the data, the writer used some ways in this study. Those ways were:
1. The writer observed to the school and interviewed to the English teacher in SMP Muhammadiyah Palangka Raya. The interview done to get the data about the number of class, the number of students, and the teaching learning process.
2. The writergave try out to VIII 3, where the question consisted of 50 items.
3. The writer took score the result of try out.
6. The writer gave pre-test to both of classes. The writer taught to the experiment class by Using Multiple choice test in two meetings.
7. The writer taught the control class by using W5+1H method based on method that usually used by English teacher in SMP Muhammadiyah Palangka Raya also in two meetings.
8. The writer gave post-test to the both of groups. It consisted of 30 items of multiple choices.
9. The writer took scores from the pre-test and post-test done and analyzed the data obtained.
10. The writer interpreted and concluded the result of data analysis.
F. Instruments of the Study
Instruments of the study are tools or facilities that was used by the writer in collecting the data. The writer used multiple choice test about descriptive text as
an instrument to collect data because the students’ vocabulary score is known by
using the test
G.Instruments Try Out
The writer conducted try out of instrument to know the reliability, validity and level of difficulty. The try out consisted of 50 items of multiple choice items., which was administred to the VIII/3 students of SMP Muhammadiyah Palangka Raya. The procedure of instrument try out as follows:
3. The writer analyzed the obtained data to know the instrument validity, instrument reliability, and index of difficulty.
H.Instruments Validity
The validity of a test is extent to which it measures what is supposed to measure and nothing else.6 An instrument is considered to be a good one if it meets some requirement. One of them is validity. Provide a true measure of a particular skills it is intended to measure, to the extent that is measures external knowledge and other skills at the same time, and it will be a valid test
Validity on this study is distinguished into some kinds as follows:
1. Face Validity
Face validity is an estimate of whether a test appears to measure a certain criterion; it does not guarantes that the test actually measures
phenomena in that domain. The test is intended to measure the students’
vocabulary scores in the eighth grade: it should cover material in the eighth grade. It is based on syillabus and the test using English.
2. Construct Validity
This type of validity assumes the existence of certain learning theories or constructs underlying the acquisition of abilities and skills.7If a test has contruct validity, it is capable of measuring certain specific characteristic in accordance with a theory of language behavior and learning. Construct validity refers to the extend to which operationalization of a construct ( e.g. practical test develop from a theory and syillabus ) do
6
JB. Heaton, Writing English Language Test, England: Longman, h.153
7
actually measure what the theory says they do. The question that given to the students which related to the syillabus it was consistend of 30 items were constructed base on the descriptive text to gain the students vocabulary scores.
No Kinds of vocabulary Based on syllabus of SMP
Muhammadiyah Palangka Raya Quantification
1 Noun/Noun Phrase 7
2 Adjective/ Adjective Phrase 11
3 Verb/Verb Phrase 3
4 Adverb of Time 2
5 Adverb of Place 5
6 Preposition/Preposition Phrase 2
Total 30 Items
3. Content Validity
The content validity has something to do with questions as to how eduquately the text content sample larger domain of situation at presents. In the other words a test is supposed to be valid in terms of its content when it is developed as to contain eduquately representive sample of the course, the objective, and the items. The text is base on the material that contains short functional text about descriptive text. It was made based on the curriculum applied in SMP Muhammadiyah palangka Raya.
I. Instruments Reliability
Reliability is necessary characteristics of any good test: for it to bevalid at all, a test must first be reliable as measuring instrument.8If the test is administered to the some candidates on different occasions (with no language practice work talking place between this occasions), then, to the extent that it produces different results, it is not reliable.
Reliability measured in this way is commonly referred to as test/ reliability. In short, in order to be reliable, a test must be consistent in its measurements. There are number of ways in estimating test reliability. In this study, the reliability of the test was measured by ANATES V4 aplication program. The result of the data had obtained that the result of average calculationis 28,08, the result of standard deviation calculationis 7,22, the result of correlation calculation XY is 0,71, and the result of reliability test calculationis 0,83.
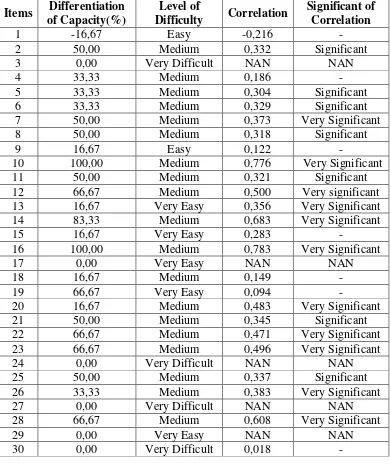
J. Level of Difficulty
Arikunto state the index of difficulty is used to know whether the students can accepted the test or not, whether the test are too easy, accepted or too difficult for them.
To measure the validity, reliability and level of difficulty ot instruments, the writer used ANATES VERSI 4. Anater is a computer application program that function to analyze test item especially for multiple choice test. This program was
8
developed by Karno To.9Based on ANATES application the significant correlation is valid items and level of difficulty is sufficient, it means the items can used for the test in pre-test and post-test between experiment and control class. The content of test items were then show in the following table:
Table 3.4. Analysis Recapitulation Items Research Instruments
Items Differentiation of Capacity(%)
Level of
Difficulty Correlation
Significant of Correlation
1 -16,67 Easy -0,216 -
2 50,00 Medium 0,332 Significant
3 0,00 Very Difficult NAN NAN
4 33,33 Medium 0,186 -
5 33,33 Medium 0,304 Significant
6 33,33 Medium 0,329 Significant
7 50,00 Medium 0,373 Very Significant
8 50,00 Medium 0,318 Significant
9 16,67 Easy 0,122 -
10 100,00 Medium 0,776 Very Significant
11 50,00 Medium 0,321 Significant
12 66,67 Medium 0,500 Very significant
13 16,67 Very Easy 0,356 Very Significant
14 83,33 Medium 0,683 Very Significant
15 16,67 Very Easy 0,283 -
16 100,00 Medium 0,783 Very Significant
17 0,00 Very Easy NAN NAN
18 16,67 Medium 0,149 -
19 66,67 Very Easy 0,094 -
20 16,67 Medium 0,483 Very Significant
21 50,00 Medium 0,345 Significant
22 66,67 Medium 0,471 Very Significant
23 66,67 Medium 0,496 Very Significant
24 0,00 Very Difficult NAN NAN
25 50,00 Medium 0,337 Significant
26 33,33 Medium 0,383 Very Significant
27 0,00 Very Difficult NAN NAN
28 66,67 Medium 0,608 Very Significant
29 0,00 Very Easy NAN NAN
30 0,00 Very Difficult 0,018 -
9
Items Differentiation of Capacity(%)
Level of
Difficulty Correlation
Significant of Correlation
31 50,00 Medium 0,471 Very Significant
32 -16,67 Medium -0,027 -
33 66,67 Medium 0,630 Very Significant
34 83,33 Medium 0,671 Very Significant
35 33,33 Medium 0,304 Significant
36 0,00 Medium 0,021 -
37 0,00 Very Easy NAN NAN
38 50,00 Easy 0,524 Very Significant
39 0,00 Very Easy NAN NAN
40 83,00 Medium 0,683 Very Significant
41 83,00 Medium 0,460 Very Significant
42 50,00 Medium 0,396 Very Significant
43 66,67 Medium 0,432 Very Significant
44 83,33 Medium 0,557 Very Significant
45 50,00 Medium 0,354 Very Significant
46 33,33 Medium 0,301 Significant
47 33,33 Medium 0,357 Very Significant
48 -33,33 Medium -0,253 -
49 33,33 Medium 0,296 Significant
50 16,67 Very Difficult 0,263 -
K.Data Analyze Procedures
To analyze the data in this study, the writer used quantitative statistical technique as follow:
1. In this study, the writer used statistical of T-test to determine the final to (t-observation). That was done to measure the last score of experiment and control group by using T-test. T-test was used to measure the differencesbetween the mean scores of the experimental class and control
class of the eight grade student’s post-test of learning vocabulary in
reading text.10
2. Before the writer calculated the result of both groups, sample data must have the normal frequency distribution. The writer did normality test and variance homogeneity test.
a. Normality Test
Test normality was needed to know whether the data that analyzed distributed normal or not. It was important to take kind of statistic used. In this study, the writer used the SPSS 20.0 for windows to analyze the normality distribution of the scores with the steps as follows: stating the hypothesis and setting the alpha level at 0,05 (sig.2-tailed) analyzing the normality distribution using Kolmogorov-Smirnov formula in SPSS for windows.
10
Lia Maretnowati, The Effectiveness of Pre-Reading Activity (Questioning and Viewing Pictures)
b. Variance Homogeneity Test
In analyzing the variance homogeneity of the scores, the writer used the Levene Test formula in SPSS 20.0 for windows. Comparing the probability with the level significance for testing the hypothesis. If the probability > the level of significance (0,05) the null hypothesis is accepted, variance of the experimental and control class are homogenous.
3. The result of between experiment and control class was calculated by T-test ondependent sample. The result of between experiment and control class is calculated by T-test formula as follows:
Where:
M = The Average of Students Score SD = Standard Deviation
SE = Standard Error
X = Experiment Class
Y = Control Class
If t-test (the value) > t table, it means Ha is accepted and Ho is rejected.
If t-tes (the value) < t table, it means Ha is rejected and Ho is Accepted.
4. Discussing and conclusion the result of data analysis.
The result of between experiment and control class was calculated by t-test independent sample with SPSS 20.0 for windows.
After collecting the data by using test, the writer analyzesthe result of the test. To find out the result of the test, the writer usessome statistic and takes steps the following:
a. Identifying the students` mistake by reading the students worksheetone by one
b. Giving the score, in determining this, the writer will find the percentage of each problem type.
Statistical procedures are steps that used statistically to analyze the students` scores. To interpret the result of the students` worksheet,I used statistical procedures as follows:
a. Mean
The mean is the average of group scores. It is used to determine theposition of the students in achieving or mastering the given materials.The way to compute the mean is adding all the students` scores thendividing this sum by the number of the test takers. The formula used tocompute the mean is as follows:
Where: X : Mean
Σx : Sum of Any Test Score
N : Sample
b. Mean Deviation of experimental Class The formula is as follow:
Where:
Mx : Mean of Experimental Class
ΣX : Total of Deviation of Experimental Class
N : Number Students of Experiment Class c. Mean Deviation of Control Class
The formula is as follow:
Where:
MY : Mean of Control Class
ΣY : Total of Deviation of Control Class
N : Number Students of Control Class
d. To find out the deviation of each post test score from pre test score of experimental class.
The formula is as follow:
Where:
Σχ2 : Deviation of Each Post Test Score from Pre Test of Experimental
Mx = Σx N
MY = ΣY N
Class
N : Number Students of Experimental Class
e. To find out the deviation of each post test score from pre test score of Control class.
The formula is as follow:
Where:
Σy2 :Deviation of Each Post Test Score From Pre Test of Control Class
N : Number of Students of Control Class
f. In hypothesis testing, the writer uses T-test formula. The T-test whichis used in this research is as follows:
Where:
Mx : Mean Deviation of Experimental Class MY : Mean Deviation of Control Class
Σχ2 : Deviation of Each Post Test Score from Pre Test of Experimental
Class
Σy2 : Deviation of Each Post Test Score from Pre Test of Control Class
ΣY2 = ΣY2 – (ΣY)2 N
T -test = _____ Mx- My _____
Σχ2 + Σy2_1_ + _1_