61 A. Description of Data
In this chapter, there were some descriptions would present the data which had been collected from research in the field. The important point of this chapter was to answer the problem of the study. It would be described the data analyze based on the obtained data of improvement the students’ vocabulary after and before taught by usingflashcard media. The presented data consisted Pre Test (Students Pre Test Score, Frequency Distribution, Mean, Median, Modus, Standard Deviation, Standard Error of Pre Test),Post Test (Students Post Test Score, Frequency Distribution, Mean, Median, Modus of Post Test, Standard Deviation, Standard Error of Post Test), Result of Data Analysis and the figure.
1. The Result of the Pre-Test
The pre-test was conducted to find out the data of the students‟ level mastery in mastering English vocabulary before the treatment given. The result of the test is presented in the table below.
Table 4.1
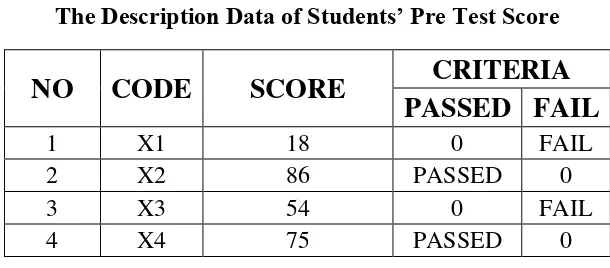
The Description Data of Students’ Pre Test Score
NO
CODE
SCORE
CRITERIA
PASSED FAIL
1 X1 18 0 FAIL
2 X2 86 PASSED 0
3 X3 54 0 FAIL
5 X5 43 0 FAIL
6 X6 61 0 FAIL
7 X7 50 0 FAIL
8 X8 86 PASSED 0
9 X9 68 0 FAIL
10 X10 75 PASSED 0
11 X11 43 0 FAIL
12 X12 54 0 FAIL
13 X13 75 PASSED 0
14 X14 54 0 FAIL
15 X15 32 0 FAIL
16 X16 68 0 FAIL
17 X17 61 0 FAIL
18 X18 82 PASSED 0
19 X19 32 0 FAIL
20 X20 54 0 FAIL
21 X21 57 0 FAIL
22 X22 68 0 FAIL
23 X23 32 0 FAIL
24 X24 36 0 FAIL
25 X25 18 0 FAIL
26 X26 54 0 FAIL
TOTAL 1446 6 20
AVERAGE 55.58
PERCENTAGE 23,08 76,92
Table above was describing the score of each students and show the students who passed and failed the test,. It can be seen that there were six students who passed the test or 23.08% and there were 20 students who failed the test or about 76.92%.
fewer than 70. It meant that, most students still did not master about vocabulary especially name of animals.
Table 4.2
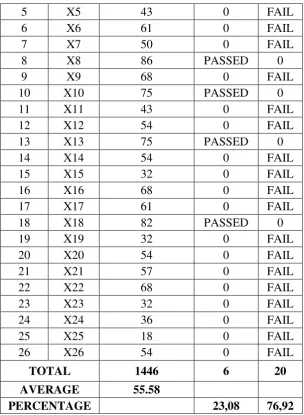
The Frequency Distribution of the Pre Test Score
Class
Table above was describing how percentage of sudents in each scores. It can be seen the higher percentage in score between 51-62 there were 8 students and about 19,23% in percentage.The distribution of students’ pretest score can also be
seen in the followingfigure.
Figure 4.1
The Frequency Distribution of the Pre Test Score. 0
74,5-86,5 62,5-74,5 50,5-62,5 38,5 - 50,5 26,5 - 38,5 14.5 - 26,5
From the table and figure about the pre test score of students,it could be seen that there are 6 students who got score 74.5-86.5. There are 3 students who got score 62.5-74.5. There are 8 students who got score 50.5-62.5. There are 3 students who got score 38.5-50.5. There are 4 students who got score 26.5-38.5 and there are 2 students who got score 14.5-26.5
The writer tabulated the score into the table for the calculation of mean, median, and modus as follows:
Table 4.3
The table for calculating Mean, Median and Modus of The Pre Test Score.
I F X FX Fkb Fka
75-86 6 80,5 483 26 6
63-74 3 68,5 205,5 20 9
51-62 8 56,5 452 17 17
39-50 3 44,5 133,5 9 20
27-38 4 32,5 130 6 24
15-26 2 20,5 41 2 26
∑F= 26 ∑fX= 1445
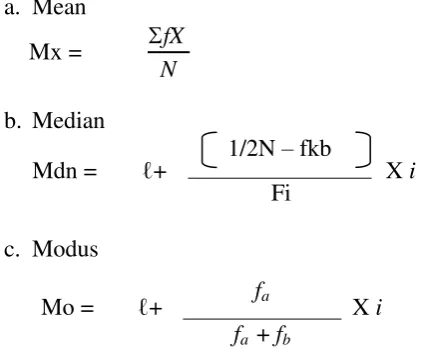
From the table above, it could be calculate the mean, median and modus of the pretest. The result of mean calculation was 55. 58. The result of median calculation was 56.5.The Result of modus calculation was 56.5. The process of calculation used formula below:
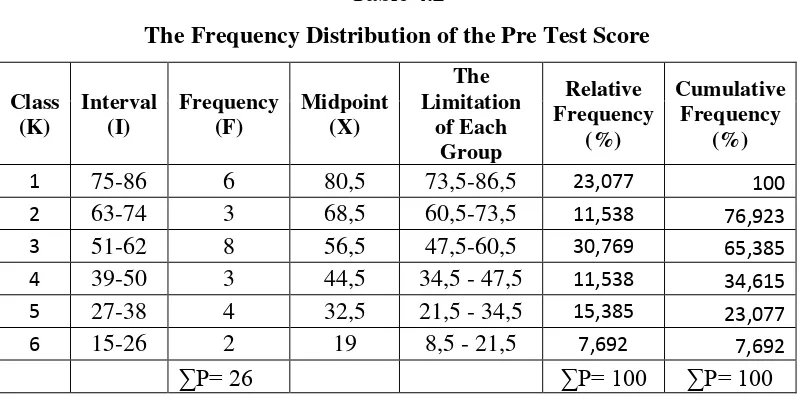
a. Mean Mx =
N fX
b. Median
Mdn = ℓ+ 1/2N – fkb X i
c. Modus
Mo = ℓ+ fa X i
fa + fb
The detail process of calculation can be seen in appendix at the Data Calculation of posttest Scores.
Afterward, the writer tabulated the score of pretest into the table of the calculation of standard deviation and the standard error as follows:
The Table 4.4
The Table of Calculation of the standard Deviation and the Standard Error of the Pre test by calculate mean first. The process of calculation used formula below:
c. Standard Error SEM =
1 SD
N
Based on the table above and the result of calculation, it found the standard deviation of pretest score was 18.63 and the standard error of pretest score was 3.726
2. The Result of Post Test
In order to analyze the mastery of students’ vocabulary after conducting
treatment. In the following table it showed that there was an improvement of the students in mastering English vocabulary after giving a treatment by the use of flashcard Media.
Table 4.5
The Description Data of Students’ Post Test Score
NO CODE SCORE CRITERIA
PASSED FAIL
1 X1 61 0 FAIL
2 X2 100 PASSED 0
3 X3 93 PASSED 0
4 X4 93 PASSED 0
5 X5 71 PASSED 0
6 X6 71 PASSED 0
7 X7 82 PASSED 0
8 X8 100 PASSED 0
9 X9 89 PASSED 0
10 X10 96 PASSED 0
11 X11 100 PASSED 0
12 X12 93 PASSED 0
13 X13 96 PASSED 0
15 X15 75 PASSED 0
16 X16 93 PASSED 0
17 X17 57 0 FAIL
18 X18 100 PASSED 0
19 X19 75 PASSED 0
20 X20 64 0 FAIL
21 X21 75 PASSED 0
22 X22 96 PASSED 0
23 X23 50 0 FAIL
24 X24 71 PASSED 0
25 X25 93 PASSED 0
26 X26 86 PASSED 0
TOTAL 2142 21 5
AVERAGE 82,39
PERCENTAGE 80,77 19,23
The table above was describing the score of each student who passed and failed the test. It shows, there were twenty one students who passed the test or about 80.77% in percentage and there were five students who failed the test or about 19.223% in percentage.
From the data explained above, it can be seen that the students’ highest
score was 100 and the students’ lowest score 50. However, based on the evaluation
Table 4.6
The Frequency Distribution of the Post Test Score
Class
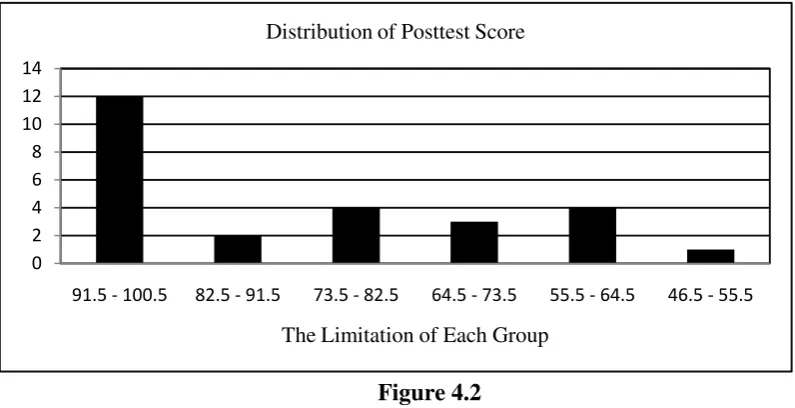
Table above was describing how percentage of sudents in each scores. It can be seen the higher percentage in score between 92-100 there were12 students and about 46.154% in percentage.The distribution of students’ pretest score can also be seen in the followingfigure.
Figure 4.2
The Frequency Distribution of the Post Test Score.
From the table and figure about the pre test score of students above. It
There are 3 students who got score 64.5-73.5. There are 4 students who got score 55.5-64.5 and there is 1 student who got score 46.5-55.5.
Afterward, the writer tabulated the score into the table for the calculation of mean, median, and modus as follows:
Table 4.7
The table for calculating Mean, Median and Modus of PostTest Score.
I F X FX Fkb Fka
92-100 12 96 1152 26 12
83-91 2 87 174 14 14
74-82 4 78 312 12 18
65-73 3 69 207 8 21
56-64 4 60 240 5 25
47-55 1 51 51 1 26
∑F= 26 ∑fX= 2136
From the table above, it can be calculated the mean, median, and modus of the post test score. The result of mean calculation was 82.154. the result of median calculation was 87. The result of modus calculation was 91.5.The process of calculation used formula below:
a. Mean Mx =
N fX
b. Median Mdn = ℓ+
1/2N – fkb
X i
Fi c. Modus
Mo = ℓ+ fa X i
The detail process of calculation can be seen in appendix at the Data Calculation of posttest Scores.
Afterward, the writer tabulated the score of pretest into the table of the calculation of standard deviation and the standard error as follows:
The Table 4.8
The Table of Calculation of the Standard Deviation and the Standard Error of the Post Test by calculate mean first. The process of calculation used formula below:
Based on the table above and the result of calculation, it found the standard deviation of posttest score was 15.03 and the standard error of posttest score was 3.006.
3. The Result of Calculation T-test using Manual Calculation
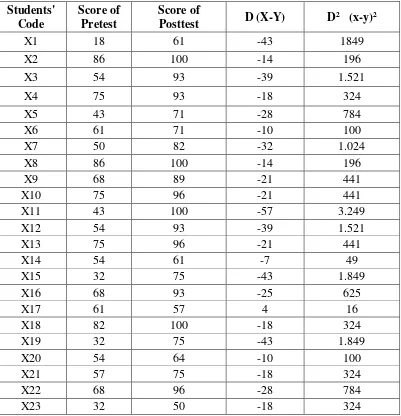
By using Manual Calculation, the data could be first distributed by the following table:
Table 4.9
The calculation Data of Pretest and Posttest
X24 36 71 -35 1.225
X25 18 93 -75 5.625
X26 54 86 -32 1.024
TOTAL 1445 2142 ΣD= -706 ΣD2= 26205
AVERAGE 55.23 82.39
From the table above, the data could be inserted into the formula of Mean, Median and Modus below:
SEMD=
1 SD
N
SEMD=
25 16.448
SEMD= 5 16.448
SEMD= 3.290 d. T observe
t0 =
𝑀𝐷 𝑆𝐸𝑀𝐷
t0 =
−27.154 3.290
t0 = 8.253
Degree of Freedom
df = N-1
df = 26-1
df = 25
5% tO 1%
2.060 < 8.253 > 2.787
The detail process of calculation can be seen in the appendix at the Calculation data of Pretest and Post Test. Based on the result of Manual calculation, it can be presented by the following table.
MD SDD SEMD to tt 5% Df
27.154 16.448 3.290 8.253 2.060 25
Where:
MD = Mean of difference
SDD = Standard Deviation of Mean of Difference
SEMD = Standard error of Mean of Difference
to = The Value of tobserrve
tt = The Value of ttable
df = Degree of Freedom
Since the calculated value of tobserved (8.253) was higher than ttable a 5%
(2.060) significant level or 8.252> 2.060.
B. DISCUSSION
In teaching learning process, media is a tool using by the teacher to teach the students. Media can make a good interaction between teacher and students. From the result of analysis, it can be seen from the score of students how the use of media giving positive effects for students vocabulary. It meant media has important role in teaching learning process.
(X=55.23< Y=82.38). It indicated that the students’ score increased after conducting treatment. In other words, teaching vocabulary by using Flashcards media gave significant effect toward the students’ vocabulary. Related toAzharArsyad(chapter II page 24), Basuki, Farida(chapter II page 26), and also Suyanto(chapter II page 26).
Meanwhile, after the data was calculated using the ttest formula using manual calculation showed that the tobserved was 8.253. By comparing the tobserved with the ttable, it was found that the tobserved was higher than ttable at 5% level significance or tobserved = 8.253>ttable=2.060.
Besides those findings, using flashcards to teach vocabulary alsoinfluenced the students’ motivation. The students’ motivation increased
during theaction. They kept enthusiastic, happier, and more interest to the lesson. Besides,the students could focus to the teacher more and followed the teacher’sinstructions. They were also more active to state their answers or
opinions. Theyalso became brave and confident to compete in class activity.