CHAPTER III
RESEARCH METHODOLOGY
In this chapter, the writer will presents, time and place of the study, research design, approach, population and sample, data collecting procedure, instrument of the study, instrument try out, data analysis procedure.
A. Time and Place of the Study
The study conducted in academic year 2014 to collect all the data accurately and briefly. The writer needed the times to do observation and collecting the data in this study for two months, from 5 September 5 October 2014. The writer took the place of the study at MTs Muslimat NU Palangka Raya, because this school got “A” accreditation criteria in academic.
B. Research Design
In this study, the writer used quasi-experimental design. Because there are many situations in educational research in which it was not possible to conduct a true experiment. Neither full control over the scheduling of experimental conditions nor the ability to randomize can be always realized. Therefore, the writer this design because of permitting the research to reach reasonable conclusions even thought full control is not possible.1 And to avoid the selection bias that can seriously threaten the internal and external validity such as maturation, instrumentation, and pretesting, the writer occupied the pretest and posttest at the same period of time. It means, the writer held the pretest of the
1
experiment and control group at the same time and after giving all the treatment of the experiment group and teaching the control group, immediately the writer held the post test.
The study was non-randomized control group, pretest-posttest design. Is one of the most widely used quasi-experimental designs in educational research.2 There are two groups in this model, control group and experiment group. Both of groups are given pre-test to measure the score of the students before the treatment has given. They are symbolized by Y1 and Y1. It meant, the control group has not given the treatment but another conventional strategy as usual and post-test has given for both of groups to measure the difference score of students between control and experiment group after the treatment are symbolized by Y2 and Y2. Moreover, the design can be drawn in the following scheme below:
Table 3.1
The Scheme of Quasi Experimental Design
Nonrandomized Control Group, Pretest-Posttest Design Subject
(Not Randomized)
Sample Pretest Treatment Posttest
E Class A Y1 X Y1
C Class C Y2 - Y2
2Ibid
Where :
E : Experiment Group C : Control Group Y1 : Pre-Test Y2 : Post-Test
X : Treatment
- : Without Treatment
In this experiment, the writer taught the students with the same material. Therefore, the use Total Physical Response Method is applied on experiment group only, and for the control group the writer applyed Direct Method.
C. Approach
The writer conducted this study by applying quantitative approach, because this approach was appropriate to collect statistical data to answer the problems of the study.
As Fowler in Creswell states,
“A survey design provides a quantitative or numeric description of some
fraction of the population – the sample – through the data collection process
of asking questions of people. This data collection, in turn, enables a
researcher to generalize the finding from sample responses to a population.3
D. Population and Sample
3
a. Population
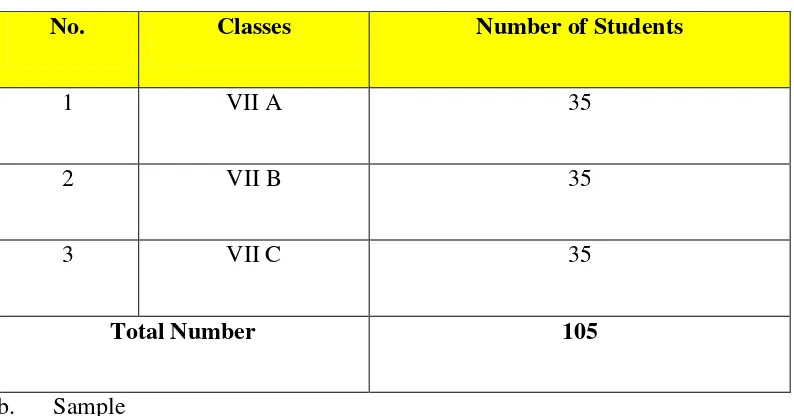
According to Arikunto, The Populationn is the whole of the research subject.4 The population in this study was all of the seventh Grade students at MTs Muslimat NU Palangka Raya. It consisted of two classes, they were VIII-A and VII-C. Based on the documentation of MTs Muslimat NU Palangka Raya, the number of population of the students could be seen in the table below.
Table 3.2
The Number of the seventh Grade Students in MTs. Muslimat NU Palangka Raya
No. Classes Number of Students
1 VII A 35
2 VII B 35
3 VII C 35
Total Number 105
b. Sample
Sampel adalah satuan kelompok terkecil yang diberi perlakuan dan member
respon secara mandiri.5 (Sample is a set of smalled group which is given treatment and give respond as self-supporting). The writer looks all of the population as sample, because the total number of the population was 75 students
4
Suharsimi Arikunto, Prosedur Penelitian Suatu Pendekatan dalam Pendidikan Bahasa, P. 108
5
from two classes of the seventh Grade Students of MTs Muslimat NU Palangka Raya. So, this research was also determined as the population research. The population sampling was used in this study and based on that case, the writer determined the class of experimental and control group by raffling two classes at the seventh grade students to be experiment or control group classes
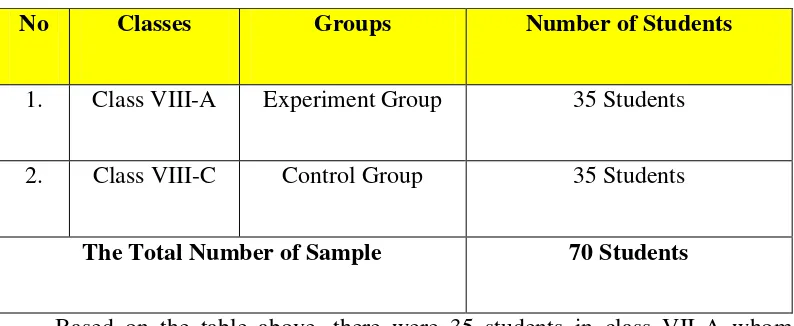
The sample of the study is as shown in the following table Table 3.3
The Sample of the Study
No Classes Groups Number of Students
1. Class VIII-A Experiment Group 35 Students
2. Class VIII-C Control Group 35 Students
The Total Number of Sample 70 Students
Based on the table above, there were 35 students in class VII-A whom taught using TPR Method, and there were 35 students too in class VII-C whom taught using Direct Method. And total number of students was 70 students.
E. Data Collecting Procedure
In this study, the writer used some procedures to collect the data. The procedures consist of some steps as follow:
The writer divided the class into experiment group.
The Writer gave pretest to experiment group.
The writer taught the experiment group or gives treatment by using TPR.
The writer gave posttest both of the groups and gives score.
The writer started to analyzes by using statistical analysis the data.
The writer tested the hypothesis.
The writer interpreted the data.
The writer concluded the result of the study of the effect of using Total
Physical Response (TPR). 2. Control Group
The writer divided the class into control group.
The Writer gave pretest to control group and give score.
The writer taught control group or give treatment without using TPR.
The writer gave posttest both of the groups and gives score.
The writer started to analyzes by using statistical analysis the data.
The writer tested the hypothesis.
The writer interpreted the data.
Data Collection Procedure
-F. Instrument Of the Study
Total Physical Response Method Use at MTs Muslimat NU Palangka Raya
Experiment Group Control Group
Pre-Test Pre-Test
Using Direct Method Using
Total Physical Response
Method
Treatment Treatment
Post-Test Post-Test
Analysis the Data Using T-test
To collect the data, the writer needs some instrument that support in collecting the data. The data is very important to support and prove the study itself. The data can be helped the writer to find the aims of the study, they are to measure the effect of using Total Physical Response on vocabulary size at the eighth grade students of MTs Muslimat NU Palangka Raya. To know the interpretation of calculated result, finally, there is one technique to get it.
1. Test
According to Donal Ary:
“Tes adalah serentetan pertanyaan atau latihan serta alat lain yang
digunakan untuk mengukur keterampilan, pengetahuan, intelegensi,
kemampuan atau bakat yang dimiliki oleh individu atau kelompok”.6 (Test is a set of questions or exercises, and other instrument that is used to measure skill, knowledge, intelligence, ability or talent of individual or group). In this case the writer will be using multiple choice tests.
In this study the multiple choice test will be used to measure the student’s vocabulary size. Every student needs minimal five minutes to answer one of the questions. For posttest, the experiment group will be giving the same test with the control group according the material in syllabus.
The mayor data in this study are the student’s vocabulary size score those
were taken from pretest and posttest. The pretest was used to measure the student’s vocabulary size each group before the treatment is applied by the writer.
6
The treatment was applied in experiment group. Furthermore, the posttest was the last test will be given to each group of control group and experiment group. 2. Documentation
Documentation was purpose to get data from the location of the study directly, consist of activity report, photos, and the relevant data in the study. The document were needed such as the students name list, source of book which the teacher used, and English syllabus. All those data was collected from the documents available at MTs Muslimat Nu of Palangka Raya.
G. Instrument Try Out
The instrument try out is important because the result of try out is used to analyze and to measure the instrument whether the test has some criteria of qualified test or not. The writer tried out the test instrument before applying to the real sample in the study. The test given at class VII B in the seems school and teacher. From the measurement of validity of the try out that was contained 30 items were known that there were 26 valid items and 4 invalid items.
1. Test Type
meaning.7 The writer use multiple-choice that consists of 30 items. All the questions will adapted from internet and the book used at MTs Muslimat NU Palangka Raya where the study will be conduct.
They were 5 items about verbs, 5 items about noun, 10 items about command word, and the last 10 items about negative command. (See details in appendix 4).
2. Instrument Validity
The validity of a test is the extent to which it measure what it is supposed to measure and nothing else.8 Simply, it can be said that a test will be valid, if it measures accurately what is intended to measure. Therefore, related to study, the test is aim to measure the student’s vocabulary size. Validity has three distinct
aspects, all of which are important. They are: content validity, face validity, and construct validity.9
a. Content Validity
A test is said to have content validity if its content constitutes a representative sample.10 It refers to the extent to which the instrument represents the content of interest. In the other words, it is concerned with the questions how well does the content of the instrument represent the entire universe of content
7
Harold S. Madsen, technique in testing, New York: Oxford University Press, 1983, p.16
8
Harold S. Madsen, technique in testing, New York: Oxford University Press, 1983, p.16
9
Arthur Hughes, Testing For Language Learners, Great Britain: Cambridge University press, 1989, p. 22.
10
which might be measured.11 Specifically, in this study, the test must be makeup of constructs underlying the acquisition of abilities and skills.13 It is concerned with the extent to which a test measures a specific trait or construct. Specifically, the construct validity measure vocabulary size.14 It is type of validity that is essential for tests that are used to individuals on certain abilities.
To measure the validity of the test measurement in multiple choice and
Donald Ary, Introduction to research in Education; third edition,…. 1985, p 214 12
Ibid,. p. 27
13
J.B Heaton, Language Testing, 1974, p. 154
14
Notes:
r xy : The coefficient of correlation
∑ : Sum of score in X distribution
∑ : sum of score in Y distribution
∑ : sum of squared score in X distribution
∑ : sum of squared score in Y distribution
∑ : sum of product of paired X and Y score
N : Number of paired X and Y score15
After the value of coefficient correlation (r xy) had found, then it was calculated using the measurement of Test-t with formula:
Tobserved =
√ √
Where:
t = the value of tobserved
r = the coefficient correlation of the result of robserved
n = the total number of students
15
The distribution of (ttable) at alpha 5 % and the degree of freedom (n-2) with the measurement of validity using these criteria :
tobserved > ttable = Valid
tobserved < ttable = Invalid
To know the validity level of the instrument, the result of the test was interpreted to the criteria correlation index (r) as follow:
The criteria of interpretation for the validity:
0.800 – 1.000 = Very High Validity
0.600 – 0.799 = High Validity
0.400 – 0.599 = Fair Validity
0.200 – 0.399 = Poor Validity
0.00 - 0.199 = Very Poor Validity 16
The result of validity measurement of tesst instrument based on the criteria as follows:
(a) If the value of tobserved is greater than ttable , it means that the test item is valid and it can be used as the instrument of the study.
(b) If the value of tobserved is lower than ttable , it means that the test item is invalid and it cannot be used as the instrument of the study.
16Ibid
From the measurement of validity of the try out that was contained 30 items were known that there were 26 valid items and 4 invalid items. For the detail explanation, it can be seen at appendix 7.
3. Instruments of Reliability
Reliability is necessary characteristic of any good test: for it to be valid at all, a test must first be reliable as a measuring instrument.17 To measure the reliability test , the researcher will use two formulations for multiple choice and writing test or essay. The formulation for multiple choice, the researcher applied KR-21 formulation as explained below:
(
1-
)
Where:
r11 = reliability of instrument
K = the total number of test items
M = mean of score
V.t = the total varians.18
The last decision was comparing the value of r11 and rt :
r11 > rt = reliable r11 < rt = not reliable
17
J.B Heaton, Language testing, 1974, p. 155.
18
From the measurement of first instrument try out reliability was found that the r11 value = 0.831 was greater than rtable = 0.369 or 0.831 > 0.369. It meant the whole numbers of test items were reliable and it was determined as high reliability. For measurement of try out of writing test reliability, the researcher used inter-rater reliability. Inter-rater is two raters to score the students writing to get the score composition as fairly and consistently as possible. The first rater was Nor Halisah, a friend of the researcher who also conducted an experiment in writing and error analysis and the second rater was the researcher of the study. In order to find concurrent reliability used Product Moment Correlation. For the detail explanation of the instrument reliability calculation could be seen in the appendix.
4. Index of Difficulty
According to Heaton the index of difficulty or facility value is the fraction or percentages of the students who answered the item correctly.19 It is used to show how easy or difficult the particular item proved in the test. Furthermore, this analysis provides insight into the instruction as well as evaluating the test item themselves. It is calculated by using the formula: 20
F.V=
19
J.B Heaton, Language testing, 1974, p. 172.
20Ibid
Where:
F.V = facility value
R = represent the number of correct answer N = the number of students taking the test
To interpret, Thondike and Elizabeth in sodijono give the rule of interpretation as following:21
F.V < 0, 30 : Difficult 0, 30-0, 70 : Fair F.V > 0, 70 : Easy 5. Test of Normality
Normality is used for estimating parametic or non parametic test will be used to analyze the data obtained. Normality is a test normal to whether or not the distribution of research data. Therefore, the writer used SPSS 16 program to measure the normality of the data.
6. Homogeneity
Homogeneity test aims to test the equality (homogeneity) some samples.22 The writer used SPSS 16 program to measure the homogeneity of the data.
H. Data Analysis Procedure
The writer analyzed the data by applying some procedure in the following: a. Collecting the data of the students’ tests result.
21
Anas sudijono, Pengantar Evaluasi Pendidikan, Jakarta :PT. Raja Grafindo Persada, 2007, p.320.
22
b. Giving score to the students’ test result by using the formula:
Score: x 100%
B : frequency of the correct answers
N : number of test item.
c. Tabulating the students’ score into distribution of frequency in the table, then find out the mean of students’ score, standard deviation, and standard
error of variable X1 (Experimental group) and X2 (Control group).
d. Calculating the data by using t-test to test the hypothesis of the study, whether the uses total physical response method (TPR) Gave effect to the students’ score or not. To examine the hypothesis, the writer used t-test. Test “t” or “t” Test is statistical test which is used to examine the truth or
falseness of null hypotheses states that between two of Sample Mean taken randomly from the same population, there is no significant different. 23 “t test” is used to measure whether total physical response method (TPR) give effect to students’ english score using theformula as follows: 24
M1 – M2
to =
SEm1 – m2
Note:
M1 – M2 : The difference of two means
23
Anas Sudijono, Pengantar Statistik Pendidikan,Jakarta : Raja Grafindo Persada, 1987, p.278.
24
SEm1 – m2 : The standard error of the difference between two means To know the hypothesis is accepted or rejected using the criterion: If t-test (the value) ≥ ttable,it means Ha is accepted and Ho is rejected. If t-test (the value) < ttable,it means Ha is rejected and Ho is accepted.
e. Interpreting the result of t-test. Previously, the writer counted the degrees of freedom (df) with the formula: 25
df = (N1 + N2 – 2)
Note: df : degrees of freedom
N1 : Number of subject group 1 N2 : Number of subject group 2
2 : Number of variables
After that, the value of ttest was consulted on the ttable at the level of significance 1 % and 5 %. In this research, the writer used the level of significance at 5 %. If the result or t-test is higher than ttable, it means Ha is accepted.
f. The writer made the conclusion of data analysis obtained.
g. In addition, the writer used SPSS 16 program to compare the data. h. Discussing and concluding the result of data analysis.
25