Jejak Vol 10 (1) (2017): 103-120. DOI: http://dx.doi.org/10.15294/jejak.v10i1.9130
JEJAK
Journal of Economics and Policy
http://journal.unnes.ac.id/nju/index.php/jejak
Determinants of Household Food Security in Urban Areas
Sarah Ayu Mutiah1, Istiqomah2
1,2Faculty of Economics and Business, Universitas Jenderal Soedirman, Indonesia
Permalink/DOI: http://dx.doi.org/10.15294/jejak.v10i1.9130
Received: August 2016; Accepted: November 2016; Published: March 2017
Abstract
Food security at household level is a very important precondition to foster the national and regional food security. Many people migrate to urban areas in the hope of improving their welfare. Generally people think that in the city there are more opportunities, but the opposite is true. The problem is more complex in the city especially for people who do not have adequate skills and education. This study aims to address whether age of household head, household size, education level of household head, income, and distribution of subsidized rice policy affect the food security of urban poor households in Purbalingga district. A hundred respondents were selected from four top villages in urban areas of Purbalingga with the highest level of poverty. Using binary logistic regression, this study finds significant positive effect of education of household head and household income and significant negative effect of household size and raskin on household food security, while age of household head has no significant effect on household food security. The results imply the need for increased awareness of family planning, education, improved skills, and increased control of the implementation of subsidized rice for the poor.
Key words : household food security, urban poverty, determinants.
How to Cite: Mutiah, S., & Istiqomah, I. (2017). Determinants of Household Food Security in Urban Areas. JEJAK:
Jurnal Ekonomi Dan Kebijakan, 10(1), 103-120. doi:http://dx.doi.org/10.15294/jejak.v10i1.9130
© 2017 Semarang State University. All rights reserved
Corresponding author :
Address: Jl. HR. Boenyamin 708, Grendeng, Purwokerto, Banyumas, Central Java, Indonesia 53122
E-mail: [email protected]
INTRODUCTION
Food is a principal basic need for humans that must be met at all times. Therefore, the right to acquire adequate food is one of human rights, as mentioned in Article 27 of the Constitution 1945 and in the Declaration of Rome (1996). The considerations underlied the issuance of Act No.7/1996 on Food that has been revised by Act No.18/2012. As one of the basic needs and human rights, food has a very important role for the life of a nation. The availability of food that is smaller than the need would create economic instability. Furthermore, various social and political turmoils may also occur as a result of food insecurity. According to Act No.18/2012, food security is defined as fulfilled condition of food for the country up to the individuals, which is reflected in the availability of adequate food, both in quantity and quality, safe, diverse, nutritious, equitable, and affordable and does not conflict with religion, beliefs, and culture, to be able to live healthy, active, and productive in a sustainable manner.
The Indonesian Government has issued Government Regulation No.68/2002 on food security, which states that food security is very important to establish Indonesian high quality, independent, and prosperous human resources through the availability of adequate, safe, good-quality, nutritious, varied food and is distributed evenly throughout Indonesia at affordable prices. The basis of the concept of national food security is at household level, meaning that food security at household level is a very important precondition to foster the national and regional food security (Arifin, 2004). Household food security is the ability of the household and all its members to obtain sufficient food for healthy and active
life.Household food security is an important level because, although an area is categorized as food secure, food security does not necessarily reach down to household level (Ariani and Handewi, 2003; Widayaningsih and Barokatuminalloh, 2016).
Food insecurity does not only occur in the countryside but also in urban areas. Many people migrate to urban areas in the hope of improving their welfare. Generally people think that in the city there are more opportunities, but the opposite is true. The problem is more complex in the city especially for people who do not have the skills and education needed, such as unemployment and slum resulting in fragility of household food security (Neni Widayaningsihand Barokatuminalloh, 2011). Household food security is associated with poverty. This is because poverty is a condition when a person or group of people are unable to meet their basic rights to maintain and develop a dignified life (January, 2014).Piaseu and Mitchell (2004) find thatin Thailand, only 44.2 percent of urban poor households are food secure, 39.2 percent food insecure without hunger, 13.6 percent insecure with moderate hunger, and 3 percent insecure with severe hunger.
Mohammadi et al. (2011) find that food insecure households in Iran have lower incomes than food secure households.
Various policies have been implemented by the government in order to alleviate poverty and food insecurity.Based on the letter of Coordinating Ministry for People Welfare No. B-2143/KMK Dep.II /XI/2007, one of the alternatives to deal with poverty is embodiedthe policy of rice for the poor, the distribution of subsidized rice. Neni Widayaningsih and Barokatuminalloh (2011) who did a study in the subdistrict of Sumbang, Banyumas show that 85 percent of households reported increased food security due to the policy. Central Java Province is one of the provinces with quite high poverty. The average proportion of poor people living below poverty line during 2013-2014 in Central
Java ranks first among provinces in Indonesia as depicted at Table 1.
In Central Java province, Purbalingga is one of the districts having a pretty high number of poor people. Based on the data from the Statistics Agency (BPS) of Central Java, the proportion of poor people in Purbalingga occupies the second largest among its neighboring districts: Banyumas, Cilacap, Banjarnegara, and Kebumen - which are well-known as Barlingmascakeb (Banjarnegara, Purbalingga, Banyumas, Cilacap, and Kebumen) region, as shown at Table 2.
Table 2 shows that the poverty rate in Purbalingga during 2013-2014 ranks second after Kebumen with an average of 20.14 percent. From 2013 to 2014, poverty rate in the region has decreased.
Table 1. Top 5 poverty rate in Indonesia 2013-2014
No Provinces
Proportion of people living below poverty line (percent)
Average (percent) 2013 2014
1 Central Java 19.97 16.45 18.21
2 East Java 17.04 17.12 17.08
3 West Java 15.34 15.28 15.31
4 North Sumatera 4.87 4.90 4.89
5 East Nusa Tenggara 3.53 3.57 3.55
Source: Indonesian Central Statistics Agency.
Table 2. Poverty rate in Barlingmascakebregion 2013-2014
No District Poverty rate (percent) Average (percent) 2013 2014
1 Kebumen 21.32 20.50 20.91
2 Purbalingga 20.53 19.75 20.14
3 Banjarnegara 18.71 17.77 18.24
4 Banyumas 18.44 17.45 17.95
5 Cilacap 15.24 14.21 14.73
However, the rate in Purbalingga is still higher than Banjarnegara, Banyumas, and Cilacap. Although being classified as a small town, Purbalingga have considerable economic activity as compared to other districts in Barlingmascakeb. The well-known economic activities in Purbalingga include exhaust, wig, and artificial eyelashes production. Despite its substantial economic activities, Purbalingga has been facing the problem of poverty. According to BPS in 2011, based on the classification of poverty, Purbalingga has 426 extremely poor households, 808 poor households, 1,118 near-poor households, and 2,596 near-poor vulnerable households. Poverty issue is related to food security because it is associated with the ability to access food. The poor, due to their low income, cannot afford to buy sufficient district are age ofhousehold head, household size, education of household head, householdincome, and the riceforthe poor policy. According to some studies, when household heads are in the productive age, theirproductivity is higher, thus higher household food security (Sukandar, 2006; Gebre, 2012). The bigger the household size, the more food is needed, leading to food insecurity (Sukandar, 2006; Becquey, 2011; Aidoo, 2013). Higher education of household head facilitates access to a good job, so as to encourage the achievement of food security in the household (Becquey, 2011; Gebre,2012; Chinnakali, 2014). Higher income of a household will increase household access to food and in turn will improve household food security (Neni Widayaningsih and Barokatuminalloh, 2011; Mohammadi et al,
2011). In addition, raskin policy will affect household food security conditions, as raskin will increase the availability of food in the household (Sasongko, 2009;Neni WidayaningsihandBarokatuminalloh,
2011).Based on the above description, this study aims to address the research question whether age of household head, household size, education level of household head, household income, and raskin policy affect food security of urban poor households in Purbalingga.
Food security according to Act No. 18/2012 on food is defined as fulfilled condition of food for the country up to the individual, which is reflected in the availability of adequate, both in quantity and quality, safe, diverse, nutritious, equitable, and affordable food and does not contradict religion, beliefs, and culture, to be able to live healthy, active, and productive. The Act also clarifies and strengthens the achievement of food security by achieving food sovereignity, food resilience, and food safety.
treatment process as well as the conditions of hygiene, culture or habit of feeding primarily to individuals requiring any kind of special meals.Distribution of food within the household is according to the needs of each individual (growth, pregnancy, lactation, etc.), and the health status of each household member.
According to the Ministry of Health (2005) in addition to the direct impact on morbidity and mortality, malnutrition also has impacts on growth, intellectual development, and productivity. Malnourished children at the age of five will grow shorter and malnutrition impairs growth and development of the brain leading to low level of intelligence because 80 percent of brain growth occurs during the mother's womb until the age of 2 years. Another impact of malnutrition is reduced productivity by 20-30 percent.According to Purwantini (2014), the proportion of malnourished children is inversely related to income. The smaller the population income, the higher the percentage of children who are malnourished, and vice versa. Poor nutrition may lead to poverty through low productivity.
Many methods can be used to measure household food security.According to LIPI (2004), the measurement of food security is calculated by combining four indicators of food security, namely the adequacy of food availability, stability of food availability, food accessibility and food safety. The combination of the adequacy of food availability and frequency of meals provide an indicator of the stability of food availability. Furthermore, the combination of the stability of food availability with access to food provides continuity indicators of food availability. Food security is measured by combining indicators of continuity of food availability and food quality. Levels of household food security are categorised at Table 3.
Table 3 shows that the level of household food security can be divided into three categories, namely:
a) Food-secure households are those which have a supply of staple staple continuously (measured on a food supply for a period of time of the harvest to the next harvest with the frequency of meals 3 times or more per day and direct access) and have expenditures for animal and vegetable protein or animal protein only.
Table 3. Measurement of food security based on the stability of food availability and quality
Continuity of food availability
Food quality: Consumption of protein Animal and
vegetable protein/ani mal protein
only
Vegetable protein
only
No consumption
of animal/ vegetable
protein
b) Less food-secure households are thosewhich have continuous supply of staple food but have expenditure for vegetable protein only, or those with less continuous supply of staple food and have expenditures for animal and vegetable protein.
c) Food-insecure households are those with continuous supply of staple food, but have no expenditure for protein, or those with less continuous supply of staple food and have expenditure for vegetable protein only, or no consumption of protein at all, or those with uncontinuous supply of staple food regardless of whether they consume protein or not.
Measurement of food security at the household level can be determined quantitatively and qualitatively. Quantitative methods according to Smith (2002) in Fathonah TY and Nuraini WP (2011) are performed using household expenditure survey and individual food intake. In quantitative methods, there are four variables used:household energy consumption, level of energy sufficiency, food diversification, and the proportion of food expenditures.
Assessment of food quality has been developed in the USA by using questionnaires. According to Bickel et al (2000) in Fathonah TY and Nuraini WP (2011),
assessment of household food security qualitatively can be done by asking the incidence of behavioral conditions and subjective reactions, namely:
a) Concerns that the household food budget or food supply may not be sufficient.
b) The perception that the consumption of adults or children in the family is not sufficient in terms of quality.
c) Incidence of reducing adult food consumption within the household or the consequences arising from the reduction in food intake.
d) Incidence of reducing food consumption or the consequences arising from the reduction in food intake in children in a household.
The content of the questions in the questionnaire were then categorised into food security scales consisting of four categories of severity as shown at Table 4.
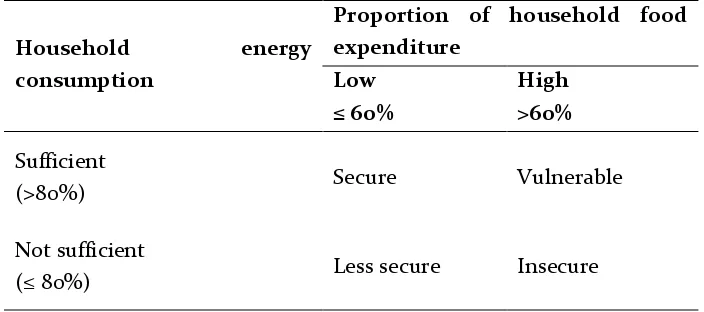
Measurement of household food security can be done using methods developed by Jhonson and Tole (1991) in Ariani and Handewi (2003) by combining the two indicators of food security:average food expenditure and energy consumption.The threshold for average household energy consumption is 80 percent, while that of food expenditure limit is 60 percent of total expenditures. The indicator can be seen at Table 5.
Table 4. Householdfood security scale based on severity
Scale of household
food security Criteria
Secure A household does not show any or only little evidence of food insecurity
Insecure without hunger
There is little or no reduction in food intake for each household member
Insecure with moderate hunger
When food intake of adults in the family is reduced resulting in recurrent famine
Insecure with severe hunger When households with children reduce food intake resulting in hunger for children
Table 5. Measurement of household food security based on household energy consumption and proportion of household food expenditure
Household energy consumption
Proportion of household food expenditure
Low High
≤ 60% >60%
Sufficient
(>80%) Secure Vulnerable
Not sufficient
(≤ 80%) Less secure Insecure
Source : Jhonson and Tole(1991).
According to Kennedy (2003), there are three fundamental difference in the components of food security between urban and rural areas. First, the availability of food in urban areas comes from production in rural, and suburban areas and import. The food provided in urban areas, either through national or international supply channels, determine the food available for purchase by the public.Urban food supply systems can involve a complex distribution chain. Complex distribution chains involving wholesalers, secondary buyers, distributors, and vendors. On the one hand, these complex networks create jobs for residents of the city, but on the other hand, these increase the price paid by consumers. Therefore, the urban poor households are vulnerable to changes in prices for earnings and cash reserves are limited.
Second, urban access to food is divided into access and choice of food as well as access and food pattern. In access and choice of food, for people who live in urban areas, access to food depends on the ability of households to buy food. Kennedy (2003) showed that most career women have little time to prepare food and long distances between home and place
of work spend a lot of time. The condition affects access and food patterns in urban Africa. Due to the fast-paced urban lifestlye, many urban consumers rely on fast food. Street food plays an important role in food access strategies of the urban poor.The cost of a traditional staple foods are often higher in urban areas than the cost of processed foods. It contributes to shifting food patterns observed in urban areas (Ruel and Garrett, 1999) in Kennedy (2003). People in urban areas consume more processed and prepared foods that in general contain more fat, sugar, salt, preservatives, and have less fiber and micronutrient content. Reasons for the shift towards processed food in urban areas is due to the convenience, availability and price.
Third, the use of urban food can be measured by looking at the individual's health status. The health status is influenced by access to services, i.e. primary health care, education, drinking water, sanitation systems and general environmental conditions. Food security conditions in urban environments is often the subject of attention, because the urban street food is often prepared in unhygienic conditions, and can carry disease outbreaks in food.
heads. This is in line with the results of Gebre (2012) that the age of the household head negatively affect food security. The logic is that the younger are more productive than the older leading to the achievement of food security of the household. Based on previous research and the logics, the following hypothesis is proposed:
H1 : Age of household head is negatively associated with household food security.
Gebre (2012), Aidoo et al (2013), Becquey et al (2011), and Murage et al (2010) showed that there is a negative relationship between household size and household food security. That means that households having fewer number of members have a better chance to secure food compared to those with many members. The bigger the household size, the more the need for food. When this need is not met, then the status of the household has little chance to be on food security condition. Based on previous research and the logical thinking, the following research hypothesis is proposed:
H2 : Household size is negatively associated with household food security.
According to Mohammadi et al (2010), Becquey et al (2011), Gebre (2012), and Chinnakaliet al (2014), there is a positive relationship between education and household food security. This means that households with higher levels of educationhave a better chance to be in a state of food security than those with low education level. The higherthe level of one’s education, the higher his/her access to obtain information. Furthermore, people who hold a higher education tend to choose nutritious, safe and healthy food, which encourage the achievement of household food security. Based on previous research and the logical
thinking, the following research hypothesis is proposed:
H3 : Education of household head is positively associated with household food security.
Piaseu and Mitchell (2004), Mohammadi et al (2010), Becquey et al (2011), Neni Widayaningsih and Barokatuminalloh (2011), Ana Kartika and Dini Ririn (2013), and Chinnakaliet al (2014), indicate that there is a positive relationship between household income and food security. This means that the higher the income, the higher the chance of household food security status. The higher the household income, the more likely the household to buy food with the bigger quantity and better quality. Based on previous research and the logical thinking, the following research hypothesis is proposed:
H4 : Household income is positively associated with household food security.
According to Neni Widayaningsih and Barokatuminalloh (2011) raskin can provide benefits to improve household food security. Results of research by Sasongko (2010) in Madura, East Java, shows that the policy has reduced household food expenditure. This means that households receivingraskin will have a greater opportunity to be on the food-secure status. Based on the previous research, the following research hypothesis is proposed:
H5 : Raskin policy is positively associated
with household food security.
RESEARCH METHODS
(BPS). The population in this study are 4,948 poor households in Purbalingga district. The samplesize in this study was calculated by the Slovin formula as follows(Hasan, 2000):
n = 𝑁 1+𝑁𝑒2 where :
n = sample size N = population size e = error
n = 1+4948(0,1)4948 2
n = 98,01 (sample size is rounded to 100 households)
The respondents were selected from top four villages with poor households: Kandang Gampang, Wirasana, Purbalingga Kidul, and Purbalingga Wetan. The distribution of sample is depicted at the following table.
Table 6. Distribution of sample
Village the food needs of their members as measured by answering some important questions about the condition of the household, events, habits, and subjective reactions about:
1) Anxiety likelihood of a household budget or availability of food is not enough to meet their basic needs.
2) Experience of households running out of food, without having money to get food. 3) The perception of respondents that the food
consumed by family members is not enough, both in quality and quantity.
4) Adjustment to replace the commonly consumed food with cheaper food.
5) Incidence of reduction of food consumed by adult household members or a consequence of the reduction of food consumed by adult household members on physical conditions such as hunger or weight loss.
6) Incidence of food reduction consumed by children in the household.
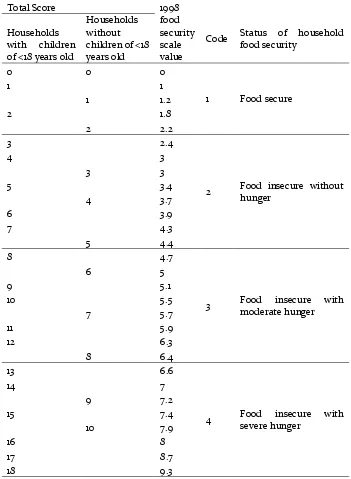
Based on the answers to the above questions, he scale of measurement is either 0 or 1, where:
0 = Food-insecure households, when the score from the questionnaire ranges between 2.4 to 9.3 household members, which is expressed in IDR per month.Household size is the number of family members consisting of head of the family itself, wives, children, and other family members living under the same house and pool resources, expressed in number of persons. Age of household head is expressed in term of years. Education is the length of schoolingof the household head which is expressed in terms of years.Raskin is defined as how many kilograms a household receives the subsidised rice; when a household does not receive it, the score is 0.
the United States both at national and state levelsduring 1995-1998.Food security is measured by asking some important questions about the household conditions, events, habits and subjective reactions. The questions are divided into three parts. The first part is the stage where questions are targeted to know the initial conditions regarding household food security. The second stage is to find out more about hosehold food security conditions, including
children and adults, especially when there are indications of a food shortage in the household. The third part is is to identify how often the households experience food shortages.
If respondents never or occasionally experiencea particular statement in the questionnaire, the score is 1, and if they do not experience it, the score is 0. The sum of score of individual questions determine the status of household food security. More details about scoring is presented at the following table.
Table 7. Scores of questionnaires and status of household food security
Total Score 1998
food security scale value Households
with children
of <18 years old
Households without children of <18 years old
Code Status of household
food security
0 0 0
1 Food secure
1 1
1 1.2
2 1.8
2 2.2
3 2.4
2 Food insecure without
hunger
4 3
3 3
5 3.4
4 3.7
6 3.9
7 4.3
5 4.4
8 4.7
3 Food insecure with
moderate hunger
6 5
9 5.1
10 5.5
7 5.7
11 5.9
12 6.3
8 6.4
13 6.6
4 Food insecure with
severe hunger
14 7
9 7.2
15 7.4
10 7.9
16 8
17 8.7
18 9.3
Logistic regression model was used to determine the effect of independent variables on food security. This is because the
dependent variable is
dichotomous/binary,and it can mix continuous, discrete and dichotomous independent variables (Gujarati, 2006).
Binary logistic regression model in this study is formulated as follows (Gujarati, association between independents and dependent variables. Chi Square (X2)Hosmer
and Lemeshowwas performed to test the
model’s goodness of fit. When the value of
Hosmer and Lemeshow is less than 0.05 the null hypothesis is rejected. Conversely, if it is not significant, the null hypothesis cannot be rejected, which means the data fit the model.In a linear regression model, R-square illustrates the model's ability to explain the effect of changes in the independent variable on the dependent variable. The closer the value of R square 1, the value the better. For regression models with a categorical dependent variable, it is not possible to use the square. Therefore, it used Pseudo R-square as a substitute of R-R-square in ordinary
regression analysis. There are two methods of measurement Pseudo R-square, namely:
a) Cok and Snell's R-square, R-square is measurement that seeks to imitate the size of the R square on multiple regression based on likelihood estimation techniques. The maximum value of Cox and Snell's R-square is less than 1 although for the "perfect" model. b) Negelkerke's R-square is a modification
dariCox and Snell's to ensure that the value varies from 0 to 1. This studyused Negelkerkes'sR square since it is easier to interpret.
Logit model uses Wald statistic to measure the level of significance of each parameter. Interpretation of Wald Statistic is similar to the t test statistic used to measure the level of significance in a linear regression. If the level of significance of the Wald Statistic is smaller than
α = 0.05, the observed independent variables has
a significant effect on the dependent variable, and vice versa (Nachrowi and Usman, 2005).The t-test was used to test whether there is a significant difference in food insecurity level between household which receive raskin and those which do not receive it.
RESULTS AND DISCUSSION
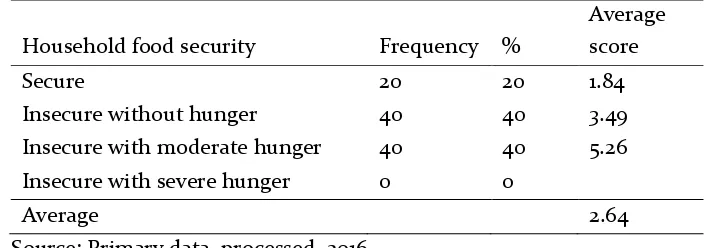
Based on the scores from the questionnaires, the food security status of households and average scores are presented at Table 8. Based on Table 8 it can be seen that the average score of the food security of households District of Purbalingga at 2.64. This shows that on average, household food security level is still low.Differences in consumption patterns among households could be due to differences in household characteristics as presented at Table 9.
higher household income, and higher amount of raskin received.
Age of household head will determine the direction of the tendency of domestic opportunities in food security conditions. Young household head could be more
productive compared to old household head. Higher productivity encourages the achievement of household food security status.Description of the relationship between age of household head and status of household food security can be seen at Table 10.
Table8. Household food security status and average score
Household food security Frequency %
Average score
Secure 20 20 1.84
Insecure without hunger 40 40 3.49
Insecure with moderate hunger 40 40 5.26 Insecure with severe hunger 0 0
Average 2.64
Source: Primary data, processed, 2016.
Table9. Household characteristics of food-secure and insecure households Household characteristics Secure (0.0-2.2) Insecure (2.4-9.3) Average age of household head
(years) 41.95 52.5
Average household size (persons 3.65 4.82 Average length of education of
household head (years) 10.85 7.23
Average household income (IDR) 2,240,000 1,437,500 Average raskin received (kg) 3.9 2.6 Source: Primary data, processed, 2016.
Tabel 10. Age of household head and household food security
Age Secure
Insecure without hunger
Insecure with moderate hunger
Insecure with severe hunger
n % n % n % N %
15-64 20 100 40 100 39 97,5 0 0
≥65 0 0 0 0 1 2,5 0 0
Total 20 1 40 1 40 1 0 0
Household size is grouped into three groups (BKKBN, 1998): small if number of
household members is ≤4 people, moderate if
household consists of 5-6 members, and big if
household members are ≥ 7 members.
According to Aidoo et al (2013), most of the food secure households had few members. This means the smaller size of households will alleviate the burden of the household consumption, so households with a small size are more likely to become food secure as shown at Table 11. Table 11 indicates thatfood-secure households are dominated by small
households and food-insecure households with moderate hunger is dominated by moderate households indicating a negative association between household size and household food security.
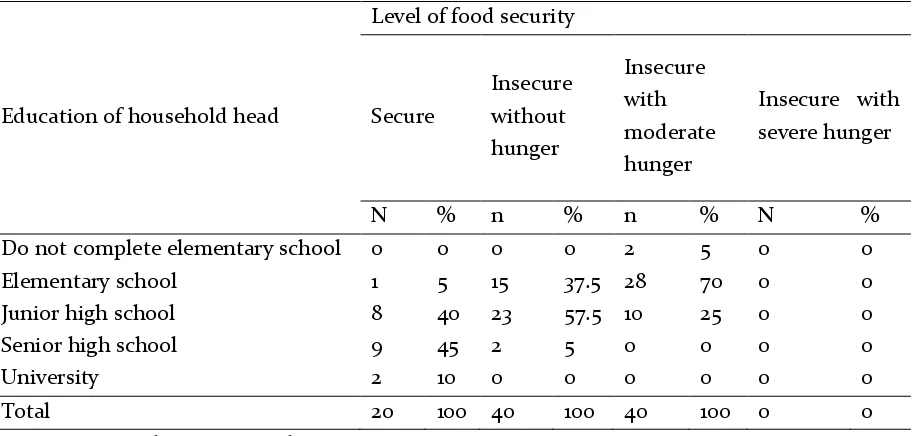
Education of household head determines the status of household food security. Heads of households who have higher education will have plenty of choice of work, as well as high productivity compared to heads of households who have low education. The relationship between education of household head and household food security can be seen at Table 12.
Table 11. Household size and food security
Household size
Status of household food security
Secure
Insecure without hunger
Insecure with moderate hunger
Insecure with severe hunger
n % n % N % n %
Small (≤4) 19 95 28 70 6 15 0 0
Moderate(5-6) 1 5 12 30 31 77.5 0 0
Big (≥7) 0 0 0 0 3 7.5 0 0
Source : Primary data, processed, 2016.
Table 12. Education of household head and household food security
Source: Primary data, processed, 2016 Education of household head
Level of food security
Secure
Insecure without hunger
Insecure with moderate hunger
Insecure with severe hunger
N % n % n % N %
Do not complete elementary school 0 0 0 0 2 5 0 0
Elementary school 1 5 15 37.5 28 70 0 0
Junior high school 8 40 23 57.5 10 25 0 0
Senior high school 9 45 2 5 0 0 0 0
University 2 10 0 0 0 0 0 0
Table 12 suggests that households with low education of the household head are more likely to be in the state of food shortage, and vice versa. This is because, the head of the family who have higher education have access to formal, higher-income jobs such asemployees at factories, hospital, and school employees, while most household heads with low education work in the informal sector such as daily and weekly labour, tire repairman, and street food traders.
Revenue has a close relationship with household consumption. Households with high income levels will have a diverse
selection of nutritious and qulity food, while those with low income can only buy limited choice of food with little nutritional content. In this study, income is classified into four classes. The relationship between household income and food security is presented at Table 13.
From Table 13, it can be concluded that the household income limit to achieve food security
condition is the income level of ≥ IDR
2,000,000/month.
Raskin policy is expected to increase household food security. In this study, there are 81 households that receive raskin. Distribution of raskinand food security is presented at Table 14.
Tabel 13. Household income and household food security
Household income (IDR million)
Secure
Insecure without hunger
Insecure with moderate hunger
Insecure with severe hunger
n % n % n % n %
≤1 0 0 3 7.5 2 5 0 0
>1-1.5 5 25 30 75 21 52.5 0 0 >1.5 - 2 5 25 7 17.5 17 42.5 0 0
>2 10 50 0 0 0 0 0 0
Total 20 100 40 100 40 100 0 0
Source: Primary data, processed,2016.
Tabel 14. Distribution of raskin and household food security
Raskin
Household food security
Secure
Insecure without hunger
Insecure with moderate hunger
Insecure with severe hunger
N % n % n % n %
Receive raskin 19 95 35 87.5 27 67.5 0 0 Do not receive raskin 1 5 5 12.5 13 32.5 0 0
Total 20 100 40 100 40 100 0 0
Table 14 suggests that more households receive raskin. This study finds that many households that receive raskinare not eligible to receive it, because the head of local government distributes raskin to all households regardlesss of their poverty status. Therefore, poor households supposed to get sufficient supply of subsidised rice, receive less. This is also due to the lack of awareness of the non poor households that protest against the head of the local government to distribute raskin to all households leading to lower rationing to individual household.
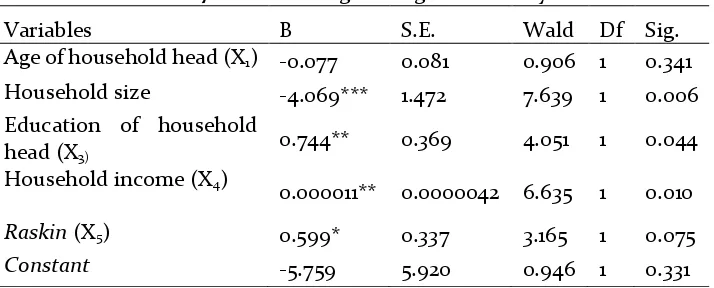
Determinants of household food security in this study were tested with binary logistic regression model, with the aim to analyze the effect of age of household head,
household size, education of hosuehold head, household income and raskin on household food security. Table 15 shows that the result of testing the similarity of model predictiion and observations is the Chi Square value of 1.137 with a probability of error of 0.997, which means that H0cannot be rejected, thus model fit.
Based on Table 16, the value of Cox and Snell is 0.521 and the value of Negelkerke's R Square of 0.824. This means that 82.4 percent of the variation of household food security level can be predicted from age of household head, household size, education of household head, income, and raskin, while the remaining 17.6 percent is explained by other variables not included in the model.
Table 15. Hosmer and Lemeshow Test
Source: Output of SPSS 22.0.
Table 16.Negelkerke’s R square
Source: Output of SPSS 22.0.
Table 17. Results of logistic regression analysis
Variables B S.E. Wald Df Sig.
Age of household head (X1) -0.077 0.081 0.906 1 0.341
Household size -4.069*** 1.472 7.639 1 0.006 Education of household
head (X3) 0.744** 0.369 4.051 1 0.044
Household income (X4)
0.000011** 0.0000042 6.635 1 0.010
Raskin (X5) 0.599* 0.337 3.165 1 0.075
Constant -5.759 5.920 0.946 1 0.331 Source: Output of SPSS 22.0.
Step Chi-square Df Sig.
1 1,137 8 0,997
Step
-2 Log
likelihood
Cox & Snell R Square
Nagelkerke R Square
Based on the above table, the following model can be estimated:
Ln (Pi
1−𝑃𝑖) = -5.759- 0.077X1-4.069X2+ 0.744X3+ 0.000011X4 + 0.599X5 + e
The table shows that all independent variables but age of household head are sgnificantly associated with household food security with expected signs. However, raskin is significant at 10 percent. The results show that age of household head has no effect on household food security. This is in contrast with Murageet al (2010) in Kenya which states that food insecure households tend to be found on households headed by older people. However, the finding is consistent with Aidoo et al (2013) in Ghana.
In this study, many households headed by older people are in a state of food secure. This is because on one hand, the older household headsare assisted by their children who have grown but not yet married in
This study finds that household size is negatively associated with household food security. This is similar to the results of Becquey et al (2011) and January (2014). Household size can be an indicator for food security because it determines the amount of household food consumption.The finding of positive association between education of household head and food security is consistent with Chinnakali et al (2014). Education greatly affects a person's receipt of the information. People who have a higher education tend to choose nutritious, safe, and healthyfood, that will encourage the achievement of household food security.
Education also facilitates employment. The higher one's education,the more employment options can be selected.
The result of positive association between household income and household food security is in line with Mohammadi et al (2010) in Iran that food secure households had higher income than the food insecure households. Revenue can be an indicator of food security because it determines the amount of food that can be purchased by a household.
The finding that raskinis positively associated with household food security supports Neni Widayaningsih and Barokatuminalloh(2011) in Banyumas that raskin policies provide benefits in improving household food security levels. However, this study does not support January (2014).
CONCLUSION
Therefore, monitoring and control should be improved in order to maximize the expected benefit of the subsidy. With regard to research limitation, the value of coefficient of determination is 0.824. Therefore, further researches are suggested to add more independent variables not included in the model.
REFERENCES
Aidoo, Robert., James O. Mensah, and Thomas Tuffour.
2013. Determinants of household food security in the sekyere-afram plains district of Ghana.Annual International Interdisciplinary
Conference,pp.514-521.
Ariani, M dan Handewi. 2003. Analisis Tingkat Ketahanan Pangan Rumah Tangga. Jurnal Media
Gizi dan Keluarga, Vol. (2):1-6
Arifin, Bustanul. 2004. Analisis Ekonomi Pertanian
Indonesia. Kompas. Jakarta
Badan Ketahanan Pangan. 2002. Peraturan Pemerintah
Republik Indonesia Nomor 68 Tahun 2002.
(Online)
http://bkp.pertanian.go.id/PP_No_68_th_2002 , diakses 28 Desember 2015.
Badan Ketahanan Pangan. 2013. Petunjuk Pelaksanaan
Sistem Kewaspadaan Pangan dan Gizi. Badan
Ketahanan Pangan, Kementerian Pertanian. Jakarta.
Badan Pusat Statistik Kabupaten Purbalingga. Kutasari
Dalam Angka 2013.
Barokatuminalloh dan Neni Widayaningsih. 2011.
Analisis ketahanan pangan rumah tangga perkotaan di Kota Purwokerto Kabupaten
Banyumas. Universitas Jenderal Soedirman.
Purwokerto
Becquey, Elodie., Francis Delpeuch, Amadou M. Konate, Herve Delsol, Matthias Lange,Mahama Zoungrana, and Yves Martin Prevel.2011. Seasonality of the dietary dimension of household food security in urban Burkina Faso.British Journal of Nutrition107:1860–1870. Bickel, Gary., Mark Nord, Cristofer Price, William
Hamilton, and John Cook. 2000. Measuring Food Security In United States: Guide To Measuring
Household Food Security, revised 2000.
www.fns.usda.gov./fsec/FILES/FSGuidesum.ht ml (online)
Chinnakali, Palanivel., Ravi P. Upadhyay, Deepa Shokeen, Kavita Singh, Manpreet Kaur, Arvind K. Singh, Anil Goswami, Kapil Yadav, Chandrakant S Pandav. 2014. Prevalence of household-level foodinsecuritty and its determinants in an urban resettlement colony in north India. International Centre For Diarrhoeal
Disease Research,Vol.32 (2):227-236.
Departemen Kesehatan. 2005. Rencana Aksi Nasional Pencegahan dan Penanggulangan Gizi Buruk 2005-2009. Depkes. Jakarta.
Fathonah TY, dan Nuraini Wp. 2011. Tingkat Ketahanan Pangan pada Rumah Tangga yang Dikepalai Pria dan
Rumah Tangga yang Dikepalai Wanita.
http://download.portalgaruda.org/article.php?articl e=83500&val=223&title=tingkat%ketahanan%20pad a%20rumahtangga%20yang%20dikepalai%20pria% 20dan%20rumahtangga%20yang%20yang%20dikep alai%20wanita(online) diakses pada tanggal 28 Januari 2016.
Gebre, Girma Gezimu. 2012. Determinants of Food Insecurity AmongHouseholds In Addis Ababa City, Ethiopia. Interdisciplinary Description of Complex
Systems Vol.10 (2): 159-173.
Gujarati, Damodar N. 2006. Dasar-dasar Ekonometrika,
Edisi Ketiga Jilid I. Erlangga. Jakarta
Hasan. 2000. Pokok-Pokok Materi Metodologi Penelitian
Dan Aplikasinya. Ghalia Indonesia. Jakarta
January, Indri. 2014. Tingkat Ketahanan Pangan Rumah Tangga Petani Dan Pengaruh Kebijakan Raskin.Jurnal Ekonomi Pembangunan, Vol.15 (2):109-116
Kementerian Pertanian RI Badan Ketahanan Pangan. 2012. Undang-Undang RI Nomor 18 Tahun 2012 Tentang Pangan (online)http://bkp.pertanian.go.id/berita- 178-undangundang-republik-indonesia-nomor-18-tahun-2012-tentang-pangan.htmldiakses pada tanggal 28 Januari 2016.
________________. 1996.Undang Undang No. 7 Tahun 1996
Tentang Pangan. (online)
http://ews.kemendag.go.id/download.aspx?file=UU -796.pdf&type=policy, accessed at 25 December 2015.
________________. 1945.Undang-undang dasar Negara republik indonesia pasal 27 tahun 1945 tentang hak
asasi manusia. (online)
http://www.mahkamahkonstitusi.go.id/index.php? page=web.Berita&id=11732#.V2lx1ea4HwM, accessed at 25 Desember 2015.
__________________.2003. Undang-Undang No 20 Tahun
2003 Tentang Sistem Pendidikan Nasional. (online)
http://www.komnasham.go.id/instrumen-ham- nasional/uu-no-20-tahun-2003-tentang-sistem-pendidikan-nasional, accessed at 25 Desember 2015
Kennedy, Gina. 2003. Food security in the context of
urban sub Sahara Africa. Food Africa, Internet
forum 31 March-11 April.
Mohammadi, Fatemeh., Nasrin Omidvar, Anahita Housiar-Rad, Mohammad R Khoshfetrat, Morteza Abdollahi, and Yadollah Mehrabi.2011. Validity of an adapted Household Food Insecurity Access Scale in urban households in Iran. Public Health Nutrition Vol.15(1), 149–157. Murage, Elizabeth., Penny A. Holding, Jean Christophe
Fotso, Alex C. Ezeh, Nyovani J. Madise,Elizabeth N. Kahurani, and Eliya M. Zulu.2010. Food security and nutritional outcomes among urban poor orphans in Nairobi, Kenya. Journal of urban health: bulletin of the new york academy of
medicine, Vol.88 (2):282-297.
Nachrowi, Djalal dan Usman, Hardius. 2005.
Penggunaan Teknik Ekonometri. Edisi Revisi.
Rajawali Pers. Jakarta.
Piaseu, Noppawan dan Pamela M. 2004. Household food insecurity among urban poor in Thailand.
Journal of nursing scholarship Vol.36 (2): 115-121.
Purwantini, Tri Bastuti. 2014. Pendekatan rawan pangan dan gizi: besaran, karakteristik, dan penyebabnya. Forum penelitian Agro Ekonomi, Vol. 32 (1): 1-17.
Sari, Ana Kartika dan Dini Ririn A. 2013. Faktor sosial ekonomi yang berhubungan dengan ketahanan pangan rumah tangga nelayan perkotaan di Surabaya. Media Gizi Indonesia,Vol. 9 (1): 54-59. Sasongko. 2010.Pengaruh raskin terhadap pengeluaran
konsumsi dan sosial ekonomi serta kesejahteraan keluarga di Jawa Timur.Ekuitas, Vol.14 (3): 365-388. Sugiyono. 2003. Metode Penelitian Bisnis. Pusat Bahasa
Depdiknas. Bandung.
Sukandar, Dadang., Ali Khomsan, Hadi R, Faisal Anwar, dan Eddy S. 2006.Studi Ketahanan Pangan Pada Rumah Tangga Miskin dan Tidak Miskin.Jurnal Ilmiah Gizi
Indont, Vol. 29 (1):22-32.
Tim Penelitian Ketahanan Pangan dan Kemiskinan dalam konteks demografi. Pusat Kependudukan –LIPI.
“Ketahanan Pangan Rumah Tangga di Perdesaan : Konsep dan Ukuran”. http://www. Ppk.lipi.go.id.
(online) diakses pada tanggal 28 Januari 2016. Widayaningsih, Neni dan Barokatuminalloh. 2011. Analisis
ketahanan pangan rumah tangga di desa miskin di Kecamatan Sumbang Kabupaten Banyumas.
Eko-Regional, Vol. 6(1): 51-61.
Widayaningsih, Neni and Barokatuminalloh. 2016. Strategy of increasing food security based on macro and micro aspects. JEJAK: Jurnal Ekonomi dan Kebijakan,