Malaysian Journal of Mathematical Sciences 10(S) February: 431–442 (2016) Special Issue: The3rd
International Conference on Mathematical Applications in Engineering 2014 (ICMAE’14)
MALAYSIAN JOURNAL OF MATHEMATICAL SCIENCES
Journal homepage: http://einspem.upm.edu.my/journal
Alternative analysis of 6-Nitro BIPS behaviour
based on factorial design
Zaharah, W
∗1, Najiah, N
1, and Mustafa, U
21
Department of Science in Engineering, Kulliyyah of Engineering,
International Islamic University Malaysia, Kuala Lumpur,
Malaysia
2
Department of Mathematics, Faculty of Mathematics and
Science, Universiti Lampung, Indonesia
E-mail: [email protected]
∗
Corresponding author
ABSTRACT
1.
Introduction
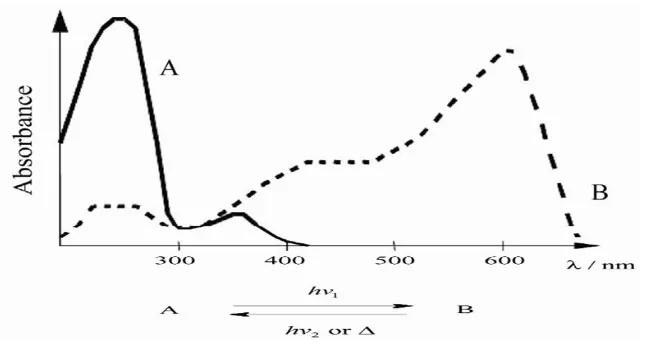
Photochromism is defined as a reversible light induced color change of ma-terial (Murvet et al., 2005). It is a non- destructive process which often results in reversible transformation of a chemical species from open to closed ring iso-mers directions by absorption of electromagnetic radiation between two forms, A and B, having different absorption spectra (Crano and J., 1999, Bouas and H., 2001). Fig. 1 illustrates the stable form A is trans-formed by UV irradi-ation into form B, (Bouas and H., 2001). The most common molecules have a pale yellow or colorless form A and a colored form B (e.g., yellow, red, vi-olet, green or blue). This is referred to as positive photochromism, (Bouas and H., 2001). In general, the photochromic processes involve a one- pho-ton mechanism (El’tsov, 1990, Brown, 1971). B is formed from the singlet
(1A∗) or triplet (3A∗) excited states or both. B, the photo- product, may also
be formed from an upper excited state populated by absorption of two photons.
Figure 1: Difference in Absorption Spectra between two forms of photochromic specie.
for specific industrial applications. A thorough understanding of molecular and material level structure property relationship is imperative to enable effective design and optimization of organic photochromic compounds for promising in-dustrial applications. In order to better interpret the effects of variations in the material properties of 6-nitro BIPS, analysis of variance ANOVA, is employed. Design of experiment is a mathematical method that provides a cost effec-tive means for developing new products and solving problems by reducing the number of required trial runs. In the present study, a statistical two-level full factorial experimental design is used to plan the experiments and identify the main effect of each variable that causes changes in the response (Montgomery, 2009, Antony, 2008, Wahid and Najiah, 2012).
The use of factorial experimental design in photochromic experiments is very few reported in literature; some of them can be found in (Christopher et al., 2002, Stolzberg, 1997, 1999, Oles, 1998), and (Najiah et al., 2014). The strategy adopted in this study was to deliberately vary the different variables conditions simultaneously within a single experiment. So that the behaviors of the photochromic dye in three different experimental conditions could be stud-ied and quantifstud-ied their impact on the photochromic dye properties (response) with the least number of experimental trials. One of the advantages of this alternative approach is that it allows us to discover the presence of interaction between the variables selected in the experiments; that is how the effect of one variable changes as the levels of other variables change (Wahid, 2012). In addition, the interaction effect of the three variables can be tested.
Thus, the purpose of this paper is to explore and determine the most impor-tant factors related to the dye properties of 6-nitro BIPs affecting the absorp-tion intensity (response). In this regard, an alternative approach specifically factorial design was applied.
2.
Materials and Methods
Preparation of sample:
The photochromic compound, 6-nitro BIPS (SP) was used in this experi-ment. It was purchased from Sigma-Aldrich and used as received. The two types of solvents used in this study were absolute ethanol and toluene and they were treated before used. The solvents are a polar solvent, absolute ethanol and
toluene (methylbenzene) as non-polar solvent, at a concentration of1.0×10−5
M (10−5
M) and 2.0×10⁻⁵
M (10−5
solutions were examined in a rectangular quartz cell. Photo irradiation was carried out by using an ultraviolet (UV) lamp (Efos Acticure A4000) as the excitation light source. Absorption spectra (response) were recorded prior to and after five seconds exposed to UV irradiations. The absorption of spectra or electron impact mass was measured on fiber optic based UV-Vis spectropho-tometer (Ocean Optics USB4000) equipped with xenon lamp, see (Wahid and Najiah, 2012).
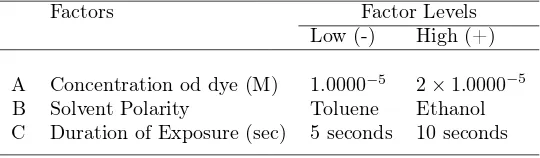
Experimental Set-up At the planning phase three independent factors are considered, and they are the concentration of 6-nito BIPs, the solvent polarity and the duration of exposure as shown in Table 1. These factors were set at two levels, that is, high (1) level and low (-1) level, and it is replicated twice in each experimental level. Replication improves the chance of detecting a statis-tically significant effect (response) in the process (Montgomery, 2009, Antony, 2008). The ranges in this study were chosen according to the most prevalent values used in the literature. The combinations of setting for the experiment variables were generated using Minitab software as presented in Table 2. The design has the property of being orthogonal
Table 1: Factor and Factor Levels
Factors Factor Levels
Low (-) High (+)
A Concentration od dye (M) 1.0000−5
2×1.0000−5
B Solvent Polarity Toluene Ethanol
C Duration of Exposure (sec) 5 seconds 10 seconds
3.
Results and Discussion
The results of the analysis before and after UV irradiation are summarized in Tables 3, 4 and 5. The averages of the response values at the (1) and (-1) levels are given in Table 4. The difference between the averages is computed and is displayed in Fig. 5. The size of this difference is used as a measure of the size of the effect.
The analysis of variance (ANOVA) before UV irradiation revealed that only B (solvent polarity) has a significant impact on the response. The rest of the variables appear to have no statistically significant effect on the mean response
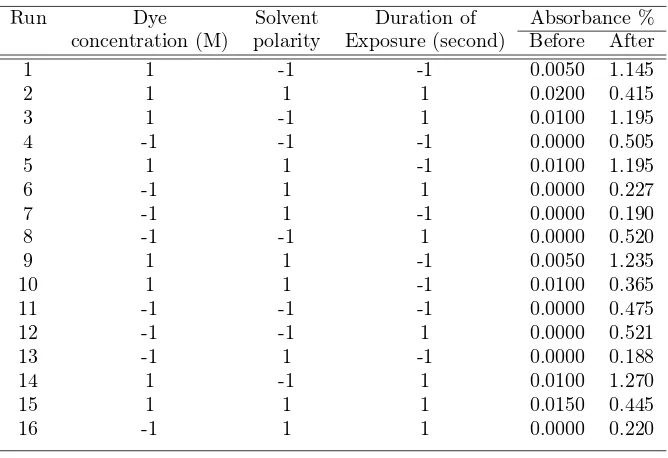
Table 2: Model Matrix and Response of the 23
Factorial Designs
Run Dye Solvent Duration of Absorbance %
concentration (M) polarity Exposure (second) Before After
1 1 -1 -1 0.0050 1.145
2 1 1 1 0.0200 0.415
3 1 -1 1 0.0100 1.195
4 -1 -1 -1 0.0000 0.505
5 1 1 -1 0.0100 1.195
6 -1 1 1 0.0000 0.227
7 -1 1 -1 0.0000 0.190
8 -1 -1 1 0.0000 0.520
9 1 1 -1 0.0050 1.235
10 1 1 -1 0.0100 0.365
11 -1 -1 -1 0.0000 0.475
12 -1 -1 1 0.0000 0.521
13 -1 1 -1 0.0000 0.188
14 1 -1 1 0.0100 1.270
15 1 1 1 0.0150 0.445
16 -1 1 1 0.0000 0.220
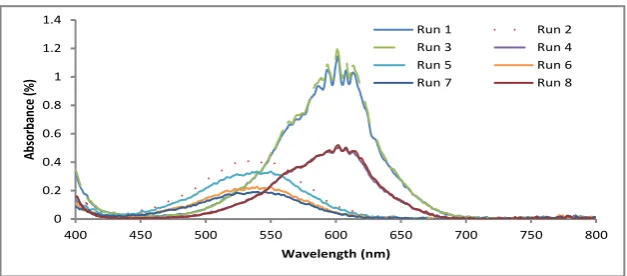
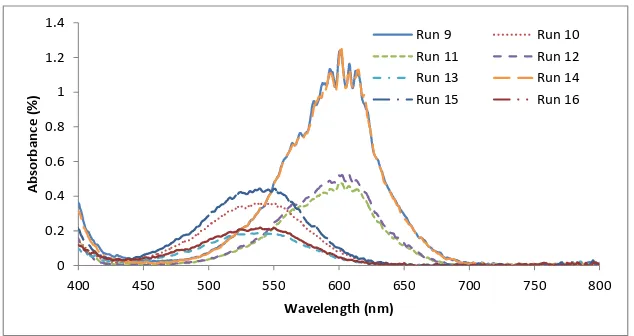
are not significant. The original solutions are transparent (colorless) or weakly colored for both toluene and ethanol respectively. Upon irradiation, absorp-tion spectra are observed and the intensity increases as duraabsorp-tion of exposure increases. Figs. 2 and 3 show the transmission spectra of 6-nitro BIPS in two different solvents. The absorption spectra caused the solution to exhibit a color that varies depending on the type of solvent. It seems that run 1, 3, 9, and 14 give high absorbance around 1.2%. The colored solutions faded thermally to their original state, when UV light is removed.
Table 3: Analysis of variance (ANOVA) for model (1)
Source DF Sum of Squares Mean Square F Value Pr>F
Model 6 2.32940638 0.38823440 410.10 <.0001
Error 9 0.00852006 0.00094667
Total 15 2.33792644
0
400 450 500 550 600 650 700 750 800
Ab
Figure 2: Activated absorption spectra for Run1-8.
Absorbance=µ+A+B+C+AB+AC+BC+ε (1)
The model is very significant with (p < 0.0001). This indicates that the
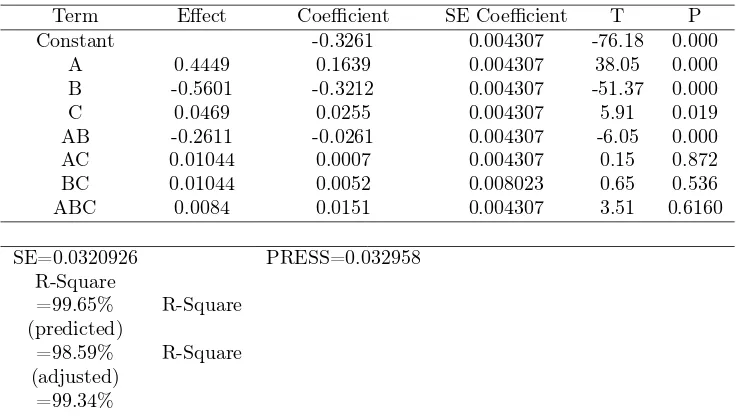
model can be used to explain the absorbance (%). With very high degrees of coefficient of determination, the adjusted R-square demonstrates 99.34% of the variation in the absorbance can be explained by the equation (1) using the independent variables and the standard error of the estimate is 0.032093. The main effect B (solvent polarity) was statistically significant at (p <0.000) and has the largest effect. The next largest observed effect is A (Concentration of 6-nito BIPs) at (p < 0.000), followed by variable C (Duration of exposure) is found significant at (p <0.019).
It is interesting to note that there is a significant interaction between vari-ables. An interaction effect of AB (concentration and solvent) at (p <0.000) is found to be statistically significant.While the interaction effect of AC
(Concen-tration and duration exposure) at (p <0.872) and BC (solvent and exposure)
0
400 450 500 550 600 650 700 750 800
Ab
Figure 3: Activated absorption spectra for Run9-16.
of the data based on the magnitude of the factor effects.
An alternative approach to determine which effects should be treated as real and which should be treated as arising from random variations, a half-Normal probability plot is used. The half-half-Normal probability plot is shown in Fig.4. Examining of the plot in Figure 4, reveals that three points stood away from the straight line significant, and they are B (-0.5601), A (0.4449) and
A∗B (-0.2611 ). They are far from the straight line and have large effect.
While C (Duration of Exposure-Sec) even though it is significant, but the effect is small(0.0469), and lies closed to the straight line thus it is negligible. These plots also indicate that variables B, A and AB interactions have real effects on the absorption. Since the intercept of the plot is zero, there is no evidence of outliers. This observation is consistent with the ANOVA analysis. The discovery of interaction is very important information because we can understand the process better.
To complete the analysis of these data, it was note that none of the effect
Table 4: Estimated Effects and Coefficients for After UV-light irradiation for model (1)
Term Effect Coefficient SE Coefficient T P
Constant -0.3261 0.004307 -76.18 0.000
A 0.4449 0.1639 0.004307 38.05 0.000
B -0.5601 -0.3212 0.004307 -51.37 0.000
C 0.0469 0.0255 0.004307 5.91 0.019
AB -0.2611 -0.0261 0.004307 -6.05 0.000
AC 0.01044 0.0007 0.004307 0.15 0.872
BC 0.01044 0.0052 0.008023 0.65 0.536
ABC 0.0084 0.0151 0.004307 3.51 0.6160
SE=0.0320926 PRESS=0.032958
A bsolute Standardized Effect
P
Half Normal Plot of the Standardized Effects
(response is After (activated), Alpha = 0.05)
Figure 4: Half Normal plot of the standardised effects.
make sense to set C [low, high] at the low level to study the effect ofA,Band
A∗B. The model
Absorbance=µ+A+B+AB+ε C= 0 (5sec) (2)
Absorbance=µ+A+B+AB+ε C= 1 (10sec) (3)
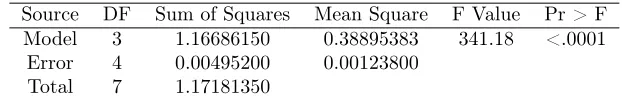
The result for model (2):
Table 5: The ANOVA for model (2) Dependent Variable: Absorbance C= at low level (5 seconds)
Source DF Sum of Squares Mean Square F Value Pr > F
Model 3 1.16686150 0.38895383 341.18 <.0001
Error 4 0.00495200 0.00123800
Total 7 1.17181350
Table 6: The ANOVA for model (2) Dependent Variable: Absorbance C= at low level (5 seconds)
R-Square Coeff Var Root MSE Absorb Mean
0.995774 6.342537 0.035185 0.554750
The model (2) is very significant with F-value= 314.18 (p−value <0.0001)
as suggested in Table 5 and 6. R2
= 0.9957means that 99.57% of absorbance
can be explained by variableAandB at the level ofC= 0(5 sec). To explore
more about the parameters A, B and A∗B, it was discovered that all the
parameters are significant and the result is given below:
Table 7: ANOVA for testing partial parameters in the model (2) with C (low)
Source DF Anova SS Mean Square F Value Pr > F
A 1 0.37066050 0.37066050 299.40 <.0001
B 1 0.65094050 0.65094050 525.80 <.0001
A∗B 1 0.14526050 0.14526050 117.33 0.0004
0.10 (response is log -activated)
Figure 5: Residuals versus fitted for absorbance.
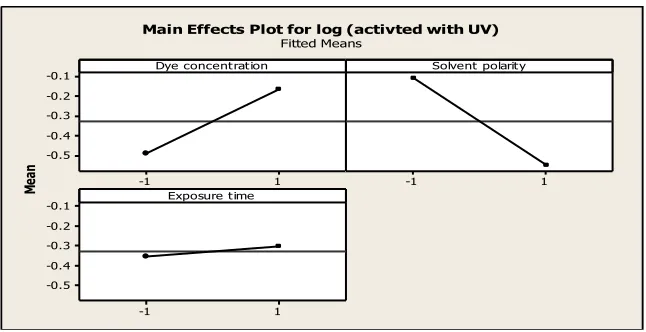
1
Dye concent rat ion
M
ea
n
Solvent polarit y
Exposure t ime
Main Effects Plot for log (activted with UV)
Fitted Means
4.
Conclusion
In this paper a 2-level factorial designed was performed. The effect of solvent polarity, dye concentration and duration of UV-light exposure on the absorbance was studied. The significant factors affecting the absorbance were identified from ANOVA. It was demonstrated that solvent polarity is the most influential variable at low level that is, in toluene followed by concentration of dye at high level and duration of exposure to be set at low level. It reinforces the fact that solvent plays a major role for the changes in the absorbance. Another important finding is that interaction between solvent polarity and concentra-tion. The additional knowledge gained from this design of experiments would serve a better insight into the present mechanism of photochromism. However more investigation in this regard based on design of experiment approach will provide a remarkably strategy for researchers and engineers.
Acknowledgments
The authors are thankful to the Ministry of Higher Education, Malaysia for the financial support received in the form of grant (FRGS project code: 11-029-0177).
References
Murvet, V., Stokesa, D. L., & Vo-Dinh, T. A sol-gel derived agd photochromic
coating on glass for sers chemical sensor application. Sensors and Actuators
B: Chemical, pages 660–667, 2005.
Crano, J. & J., G. Organic photochromic and thermochromic compounds.
Main Photochromic Families, Plenum Press, New York, 1(1):1–9, 1999.
Bouas, L. & H., D. Organic photochrom-ism. Pure and Applied Chemistry, 73
(4):639–665, 2001.
El’tsov, A. Organic Photochrom-ism. Plenum Publishing Corporation, New
York, 1990.
Brown, G. Techniques of Chemistry. Vol. III, Photocromism. John Wiley &
Sons, Inc., New York, 1971.
Montgomery, D. Design and Analysis of Experiments, International Student
Antony, J. Design of Experiments for Engineers and Scientists. Butterworth Heinemann, U.K, 2008.
Wahid, Z. & Najiah, N. Improvement of one factor at a time through design of
experiments. World Applied Science Journal 20 (Mathematical Application
in Engineering), pages 56–61, 2012.
Christopher, A., Heimbuck, & Bower, N. Teaching experimental design using a
gc-ms analysis of cocaine on money: A cross-disciplinary laboratory. Journal
of Chemical Education, 79(10):1254–1254, 2002.
Stolzberg, R. J. Screening and sequential experimentation: Simulations and
flame atomic absorption spectrometry experiments. Journal of Chemical
Education, 74(2):216–, 1997.
Stolzberg, R. J. Optimization signal-to-noise ratio in flame atomic absorption
spectrometry using sequential simplex optimization. Journal of Chemical
Education, 76(6):834–, 1999.
Oles, P. J. Fractional factorial experimental design as a teaching tool for
quan-titative analysis. Journal of Chemical Education, 75(3):357–, 1998.
Najiah, N., Wahid, Z., Tarmizi, M., & Noor, Z. Photochromicbehaviour of
spiropyrans: The effect of substituent. Advanced Materials Research, 925:
323–328, 2014.
Wahid, Z. An alternative approach to experimentation and data analysis.
Pro-ceeding of the 2nd International Conference on Mathematical Applications