THE INFLUENCE OF INFLATION RATE, INTEREST RATE, AND MONEY SUPPLY ON SHARE PRICE LQ45
Hari Gursida1)
1) Post Graduate Program, Pakuan University, Bogor, Indonesia
E-mail: [email protected]
Submit: 08 January 2018 , Revised: 27 February 2018, Accepted: 25 March 2018
Abstract. The purpose of this study is to determine the inluence of inlation rate, interest rate, and money
supply on LQ45 stock price either partially or simultaneously. This research is a quantitative research
that aims to test the hypothesis. Objects in this study are: inlation rate, interest rate, money supply, and
stock price LQ45. The research period is 2010 to 2016. The data used is quantitative data from secondary sources. The method of analysis used is multiple linear regression with hypothesis testing using t test and
F test. Based on the results of the study it can be concluded that: 1) the inlation rate does not affect the CSPI LQ45; 2) the interest rate does not affect the CSPI LQ45; 3) the money supply has a signiicant inluence on CSPI LQ45; 4) Simultaneously, the inlation rate, interest rate and money supply have a signiicant inluence on CSPI LQ45.
Keywords: Inlation Rate, Interest Rate, Money Supply, and CSPI LQ45
I. INTRODUCTION
Investments made by investors can be placed
on real assets and inancial assets. One of the most attractive inancial assets for investors is in the stock
market because stocks provide the higher possibility of huge returns in a short time.
Investing in stocks will be exposed to returns and
risks. Therefore, in investing in stocks must conduct
an analysis of both. The proit gained by investors
from investment in stock can be dividend and capital
gain. Dividend is the distribution of proits provided by the issuing company of the proits obtained by the company. While capital gains are the difference
between the purchase price and the selling price of the stock.
The stock is known for its high risk-high return characteristics, meaning that stocks are securities
that offer high proit opportunities but also high
risk potential. Stocks allow investors to earn a large
amount of returns or proits in a short period of time. However, as stock prices luctuate, stocks can
also make investors suffer huge losses in a short time. The risks faced by investors from stock ownership
are: not getting a dividend because the company suffered losses and capital loss because investors sell their shares at lower prices than the purchase price. In addition to these two risks, there are still other risks, among others: bankrupt companies or liquidated, delisting, and shares in suspend.
The irst step when trying to conduct an economic
analysis before investing is to observe macroeconomic indicators, will assist investors in predicting what changes will occur in the capital
market. For example, forecasting interest rates. If
interest rates increase, then investors need
to make a sell decision, because stock and bond prices tend to decrease. So the ability to predict changes in macroeconomic variables also greatly assist investors in making the right investment decisions.
The condition of the capital market, can not be separated from the overall assessment of the macro economic situation. In theory, capital market
conditions are strongly inluenced by aggregate
correlation. That is, the macroeconomic situation is
so great inluence on the capital market. The capital
market plays an important role in the Indonesian
economy and the Jakarta Composite Index (CSPI)
can be a leading economic indicator in Indonesia. The presence of capital markets in Indonesia is one of the important factors in the development of the national economy, proven to have many industries and companies that use this institution as a medium to absorb investment and media to strengthen its
inancial position. In fact, the capital market has become a inancial nerve center in today’s modern
economy, and even modern economies will not be
able to exist without a robust and globally-organized and well-organized capital market. [1]
Macro factors are factors that are outside the company, but have an effect on the increase or decrease in company performance either directly or indirectly. Macroeconomic factors that can directly affect the performance of stock and company
performance include: 1. Domestic general interest rate, 2. Inlation rate, 3. Tax laws, 4. Special government policies related to certain companies, 5. Foreign exchange rates, 6. Foreign interest rate, 7. International economic condition, 8. Economic
cycle, 9. Economic understanding, and 10. Money circulation. [2]
Changes in macroeconomic factors above will
not immediately affect the company’s performance,
but slowly in the long run. Instead, stock prices will be affected instantaneously by changes in macroeconomic factors as investors react more
quickly. When the macroeconomic factor changes
occur, the investor will calculate both
positive and negative impacts on the
company’s
performance over the next few years, then take
the decision to buy or sell the shares in question. Therefore, stock prices more quickly adjust than
irm performance against changes in macroeconomic
variables.
A wide range of macroeconomic indicators; ie, inlation, interest rates, money supply, industrial production index, gross domestic product, crude oil price, gold price, silver price, exchange rate, foreign exchange
reserve, balance of payment, foreign direct
investment, foreign institutional investment (FII) budget deicit,
employment rate, foreign trade, international stock
markets, small saving, RBI open market operation, and so on which can affect stock price. [3]
There are several indicators that affect the macro
economy such as inlation, interest rate, money supply, industrial production index, gross domestic
product, crude oil price, gold price, silver price,
exchange rate, foreign exchange reserve, and others. The relative rise in inlation is a negative signal for investors. Viewed from the consumer side, high inlation will result in consumer purchasing power (community) decreased. When viewed from the side of the company, inlation can increase revenue
and corporate costs. If the increase in factor costs is higher than the increase in prices that can be enjoyed
by the company, the proitability of the company will decrease. Inlation has an impact on raising interest
rates. Increased interest rates will directly increase
the interest expense. Companies that have high
leverage will have a very heavy impact on interest
rate increases. [4] The interest rate is inversely related
to the stock price.
An increased interest rate will lead to an increase in interest rates imposed on an investment in a stock. In addition, increased interest rates may also cause investors to withdraw their investments in stocks, then transfer them to investments in the form of savings or deposits.
Money is at the heart of many macroeconomic
analyzes. Models of money supply and money
demand can help study the determinants of long-term price levels and the causes of short-run economic
luctuations. The money supply is determined and determined by the Central Bank. The equation of
quantity theory states that in every country, the
supply of money (money supply) is equal to the
demand for money that directly affects the demand for goods and services produced in a country. An increase in the money supply is associated with a
business cycle expansion. An increase in the money supply will encourage increased sources of inancing for the company so that the company can expand its business expansion more broadly that ultimately
improve the performance of the company. Increased corporate performance will stimulate investors to glance at shares of the company so that a positive
In accordance with the purpose of research, the hypothesis in this study as follows.
H1. Inlation rate negatively affects the LQ45 composite stock price index
H2. The interest rate negatively affects the composite stock price index LQ45
H3. The money supply has a positive effect on the composite stock price index LQ45
H4. The inlation rate, the interest rate and the money supply simultaneously affect the CSPI LQ45
II. THEORETICAL REVIEW
Inlation
Inlation is a general rise in commodity prices caused by the synchronization between procurement commodity procurement programs (production, pricing, money printing, etc.) with income levels owned by the public.” [6], “Inlation is a condition of
an increase in price-haga prevailing in an economy
on an ongoing basis. [7), Inlation is an increase in the general price level of goods and services; it represents a reduction in a dollar’s purchasing power. [8], [9]
The most commonly used indicator to measure
inlation is the Consumer Price Index (CPI) [10]. The CPI is a price indicator used so far to see the success of monetary policy in controlling inlation, as it can
be available more quickly than other indicators, such
as the Free Trade Price Index and GDP delator. Speciically, the CPI is an index used to measure
the average price changes in general from a certain number of items in a certain period of time or also
called inlation.
The type of inlation by nature is divided into three main categories, namely as follows: 1) Inlation creep I low (creeping inlation), ie inlation of less than 10% per year; 2) Medium inlation (galloping inlation) is between 10-30% per year. This inlation is usually characterized by rapid and relatively large increases in prices. The inlation rate under these conditions is usually called 2 digits, for example 15%, 20%, 30%, and so on; 3) High inlation (high inlation), namely inlation of magnitude between 30-100% per year. Under these conditions prices generally rise; and 4) Very high inlation (hyper inlation), ie inlation marked by drastic price increases up to 4 digits (above 100%). In this condition people do not want
to save money anymore, because its value drops very
sharply, so it is better to be exchanged with goods. [11] It can be concluded that inlation is an economic
situation that has increased the price of goods and services in general and continuous and can not be
prevented in an economy. The nature of inlation is divided into three namely low inlation, less than 10% per year, medium inlation, ranging from 10% -20% per year, high inlation, ranging from 30% -100%, and inlation is very high above 100%.
Interest Rate
High interest rate is a negative signal to stock
prices. In addition, an increased interest rate can also cause investors to withdraw their investments in stocks and transfer them to investments in the form of savings or deposits. The strengthening of the rupiah against the foreign currency is a positive
signal for the economy experiencing inlation. The
strengthening of the rupiah against foreign currencies will lower the cost of importing raw materials for production, and will lower the prevailing interest
rates. [12]
BI rate is the policy rate relecting the stance or stance of monetary policy stipulated by Bank Indonesia and announced to the public.[13]
Interest rate is one of the important macroeconomic variables that is related to economic growth.
Generally, the interest rate is considered as the cost
of capital, which means the price paid for the use of money for a period of time. The direction of interest rate movement is of primary importance to the
stock market. [3] If interest rates rise, investors can transfer their money from stock to deposit. But if the
interest rate increase coincided with the weakening
of the rupiah exchange rate signiicantly, then some
investors are better placed the money in the form of
foreign exchange. If interest rates fall, investors are
better off shifting their funds from deposits to stock
investments.[14] The Changes in interest rates will
affect the stock price in reverse, ceteris paribus. If interest rates rise, then stock prices will fall, and vice
versa if interest rates fall, stock prices will rise. [12] BI rate implies the value of deposit and banking rates. BI rate is inluenced by inlation rate. The bigger the inlation rate, the BI rate will adjust that eventually
the interest rate of banking credit will also be raised.
The greater the value of inlation, the likelihood
with growing inlation, people’s purchasing power declines and companies are inding it increasingly dificult to increase sales and generate proits. So the source of the company’s capital will depend on loans
from banks.
The function of interest rates is as follows: 1) As an attraction for savers who have more funds to invest; 2) Interest rates can be used as a means of control for
the government against direct funds or investments
in the economic sectors; 3) Interest rates can be used
as a monetary tool in order to control the supply and demand of money circulating in an economy.
For example, the government supports the growth
of a particular industry sector. If the companies of the industry will borrow funds, then the government
provides a lower interest rate than other sectors; and 4) The government can manipulate the interest rate to
increase production, as a result the interest rate can
be used to control the rate of inlation.[15]
Based on the description, it can be concluded that
the interest rate is the result of changes in the rate of
inlation that causes Bank Indonesia to change the BI rate. However, the BI rate and the interest rate are not always the same. Banks have their respective policies to set interest rates but must adjust to the BI rate. In essence, the reference of this study is the BI rate used to stabilize economic conditions and balance between
savings offer and investment demand. If interest rates
increase, interest in deposits will increase. But if
interest rates decrease investment demand will increase. This resulted in stock prices declining as interest rates increased, and increased as interest rates declined.
Money Supply
Money Supply divided into 3, namely: (a)M1 (money supply in the narrow sense) consists of currency (paper and metal) plus money deposits that
are very easily disbursed into money, ie savings by
check; (b) M2 (supply of money in a broad sense) consists of M1 plus savings and time deposits in small quantities. And (c) M3 (money supply in the broader sense) consists of M2 plus large time deposits [17]
The inluence of the amount of money circulating
in the community against the movement of stocks can be shown by various theories one of them is Keynesian Theory which is applied as the transmission of monetary policy namely The Cost Of
Capital Channel. In Keynes’s economic theory, the
interest rate is the primary link between the monetary sector and the real sector. Changes in the amount
of money for example, will affect the interest rate.
Changes in interest rates will affect investment or even consumption. Investment is part of aggregate
expenditure. Changes in total expenditure in turn
will have a double effect on the balance of national income.
As the money supply in the community grows so
that the expectation of prices of goods and services will rise (inlation) resulting in the deposit interest
rate in the economy declining. The decline in deposit interest rates has prompted people to invest in the
stock market in the hope of gaining greater proits,
which will have an impact on the increasing demand for stocks in the capital market.
Stock Price Index
One indicator of stock price movement is the
stock price index. Currently, IDX has several stock indexes, among others: 1) CSPIthat uses all companies listed as component of index calculation; 2) Sectoral index using all listed companies included in each sector. Currently, there are 10 sectors in BEI
namely agriculture, mining, basic industries, various industries, consumer goods, property, infrastructure,
inance, trade and services, and manufacturing; 3) LQ45 index is index consisting of 45 shares of listed
company selected based on liquidity and market
capitalization considerations, with predetermined criteria. Review and stock replacement is done every 6 months; 4) Jakarta Islamic Index (JII) is an index which uses 30 shares selected from shares that fall within the criteria of sharia (List of Sharia Securities issued by Bapepam-LK) taking into account market capitalization and liquidity; 5) Compass Index 100 is an index consisting of 100 shares of listed companies selected based on consideration of liquidity and market capitalization, with predetermined criteria. Review and stock replacement is done every 6 months; 6) BUSINESS INDEX-27. The joint venture between the Indonesia Stock Exchange and Bisnis Indonesia daily launched a stock price index called BISNIS-27 Index, an index comprising of 27 shares of listed companies
selected based on fundamental criteria, technical or liquidity of transactions and accountability and
and rating agency PEFINDO launched a stock price index called PEFINDO25 Index. This index
is intended to provide additional information for investors, especially for small and medium issuers
(Small Medium Enterprises I SME). This index consists of 25 shares of listed companies selected by considering the criteria such as: total assets, Return on Equity (ROE) and opinion of public accountants.
In addition to the above criteria, the liquidity factor and the number of shares owned by the public are
also considered; 8) SRI-KEHATI Index. This index is
formed on the cooperation between Indonesia Stock
Exchange and Indonesian Biodiversity Foundation (KEHATI). SRI stands for Sustainable Responsible Investment. This index is expected to provide
additional information to investors who want to invest in emitters that perform very well in promoting sustainable enterprises, and have awareness of the environment and good corporate governance.
This index consists of 25 shares of listed companies
selected by considering criteria such as: total
assets, Price Earning Ratio (PER) and Free Float; 9) Main Board Index. Using shares of listed companies included in the Main Board; 10) Development Board Index. Using shares of listed companies included in the Development Board; and 11) Individual Index. The stock price index of each company is listed on www.idx.co.id.
Composite Stock Price Index
The Composite Stock Price Index (CSPI) is an index that summarizes the development of stock prices at IDX (Indonesia Stock Exchange) .CSPI was irst introduced on April 1, 1983 as an indicator of stock price movements listed on the stock exchange. The basic day of the index calculation is August 10, 1982 with the value of 100 with the number of issuers listed 13 issuers.The number of issuers listed on the Indonesia Stock Exchange until December 2009 reached 398 issuers.CSPI in English is also called Jakarta Composite Index, JCI, or JSX Composite. [18]
Based on the description can be concluded that the Composite Stock Price Index is a composite index that summarizes the movement of stock prices listed on the Indonesia Stock Exchange (IDX).
Index LQ45
The LQ45 index is a calculation of 45 stocks,
selected through several selection criteria. In addition to the assessment of liquidity, the selection of these
shares considers market capitalization. The LQ 45 Index contains 45 stocks adjusted every six months (every early February and August). Thus the stock contained in the index will always change.
The purpose of the establishment of the LQ45 index is as a complement to CSPI and in particular to provide an objective and reliable means for inancial
analysis, investment managers, investors and other capital market observers in monitoring the movement of prices from actively traded stocks.
Since its launch in February 1997 the
primary measure of transaction liquidity is the value of transactions in the regular market. In accordance with market developments, and to further sharpen
the liquidity criterion, then since the January 2005
review, the number of trading days and the frequency of transactions entered as a measure of liquidity.
To get 45 shares will be selected 15 more shares by using the criteria of Transaction Day in Regular Market, Frequency of Transaction in Regular Market and Market Capitalization. The method of selecting the 15 shares is:
• Of the remaining 30, 25 stocks are selected based on Day of Transaction in the Regular Market. • Of the 25 shares will be selected 20 shares based
on Frequency of Transaction in the Regular Market • Of the 20 shares will be selected 15 shares based
on Market Capitalization, so that will be obtained 45 shares for the calculation of LQ45 index
In addition to looking at the above mentioned
liquidity and market capitalization criteria, the inancial condition and growth prospects of the
company will also be seen. The Indonesia Stock
Exchange regularly monitors the performance of stock components included in the LQ45 index
calculation. Every three months are evaluated on the
movement of the order of those shares. Replacement of shares will be done every six months, ie in early February and August. The LQ45 Index was launched in February 1997. However, to obtain historical data long enough, the base day used is July 13, 1994, with an index value of 100. [19]
III. METHODOLOGY
or hypothesis testing. Objects in this study are the
inlation rate, interest rates, money supply and CSPI LQ45. The research period is from 2010 to 2016. The
data used are secondary data collected electronically.
Inlation rate and interest rate data are obtained from Bank Indonesia website, while money supply data is obtained from BPS website. LQ45 index
data obtained from the investment world site. For
CSPI LQ45 and the money supply is measured by
using Ln.
The method of analysis used is multiple linear
regression with Ordinary Least Square (OLS) model.
The model in this research, namely:
While : CSPI = C + b1INF + b2SBI + b3MS
CSPI : Composite Stock Price Index LQ45
C : Constants
b1 : Coeficients and Inlation
b2 : The coeficient of interest rate (SBI) b3 : The coeficient of the money supply (MS)
INF : Inlation Rate
SBI : Interest Rate of Bank Indonesia
MS : Money Supply
IV. RESULT AND DISCUSSION
Based on the results of statistical descriptive
data processing obtained the following results.
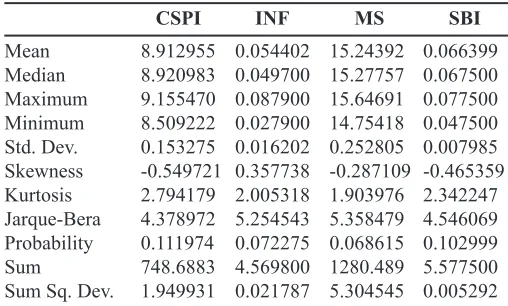
TABLE 1.
DESCRIPTIVE STATISTICS OF RESEARCH VARIABLES PERIOD 2010 - 2016
Source: Output of Eviews 9
Based on the output in Table 1. it can be seen: 1. The mean or average value of each variable are:
CSPI (LN) of 8.912955, the inlation rate of
0.066399 or 6.64% and the money supply (MS ) of 15.24392.
2. The maximum value for CSPIof 9.155470 occurred in March of 2015 while the minimum value of 8.509222 occurred in February 2010. The maximum value of the inlation rate of 0.0879 or 8.79% occurred in August 2013 while the minimum value of 0.0279 or 2.79% occurred in August 2016. The maximum interest rate while the minimum value of 0.0475 occurred in October 2016. The money supply has a maximum value of 15.64691 which occurred in December 2016 while the minimum value of 14.75418 occurred in January 2010.
3. Standard deviation which shows deviation of the data value from the average, the variable that has the biggest standard deviation is the money
supply (MS) that is equal to 0.252805 while
the variable with the least standard deviation
is the interest rate (SBI) that is 0.007985. 4. Skewness is a measure of asymmetry of the
spread of statistical data around the mean (mean).
The skewness of a symmetrical dispersion
(normal distribution) is zero. Positive skewness
shows that the spread of the data has a long tail on the right side and negative skewness has a lat (platykurtic) compared to normal distributed
data. The output above shows all variables have less than three kurtosis values, meaning that all
data variables have a lat data distribution.
The Jarque Bera test is one of the normality tests of the type of goodness of it test which measures whether
the skewness and the sample kurtosis correspond to the normal distribution. This test is based on the fact that the skewness and kurtosis values of the normal
distribution are zero. Therefore, the absolute value of
this parameter can be a measure of the distribution deviation from normal. In the application value of
α = 5% indicates that, the four variables in this study have probability> 0.05. Thus, for these four variables receive H0, it means that the four variables have normal distributed data. Based on results of data
processing that obtained from the Eviews output
(Table 2), the tests of each regression coeficient of inlation rate (INF), interest rate (SBI) and money supply (MS) on LQ45 Index for 2010 - 2016 period using t test. T test was conducted to ind out whether each CSPI LQ45 as dependent variable signiicantly with 95% conidence level or error (a) of 5%.
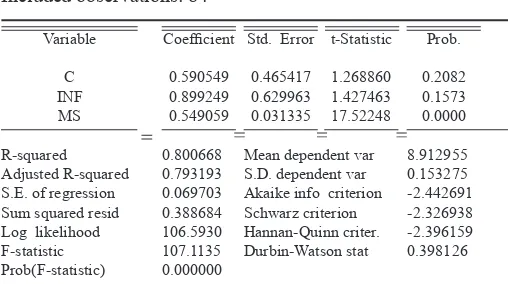
TABLE 2.
INFLATION RATE ESTIMATION (INF), INTEREST RATE
(SBI) AND MONEY SUPPLY (MS) TO CSPI LQ45
Dependent Variable: IHSG Method: Least Squares Date: 12/30/17 Time: 18:47
Sample: 2010M01 2016M12
CSPI = 0.590548802166 + 0.899248784532*INF -1.45070782651*SBI + 0.549059092343*MS 1. The Inluence of Inlation Rate on CSPI LQ45
Based on t test, inlation rate variable (INF) has Prob.0.1573> 0.05, it was concluded that the inlation rate variables did not signiicantly affect the CSPI LQ45 in the period 2010-2015. In addition, the variable rate of inlation has a positive coeficient of 0.899249. Thus, this result is not in line with the hypothesis that the inlation rate negatively affect the CSPI LQ45. The variable coeficient of the
inlation rate of 0.899249 or 89.9% indicates that if the inlation rate rises as much as 1% then the CSPI LQ45 will increase by 89.9%.
2. The Inluence of Interest Rate on CSPI LQ45 Based on the t test, the interest rate variable (SBI) has Prob. 0.2705> 0.05, it is concluded that the interest rate variable has no signiicant effect on CSPI LQ45 in period 2010-2015. In addition, interest rate variable has negative coeficient which is equal to -1.450708. Thus, this result is in line with the
hypothesis that the interest rate has a negative effect
on CSPI LQ45. The interest rate variable coeficient of -1.450708 or -145% indicates that if the interest rate rises as high as 1% then the CSPI LQ45 will decrease by 145%.
3. The Inluence of Money Supply on CSPI LQ45 Based on t test, the money supply (MS) variable has Prob. 0.0000 <0.05, it is concluded that the money supply variables signiicantly inluence the CSPI LQ45 in the period 2010-2015. In addition, the variable money supply has a positive coeficient of 0.549059. Thus, this result is in line with the
hypothesis that the money supply has a positive
effect on CSPI LQ45. The coeficient of the money supply in the amount of 0.549059 or 55% indicates that if the money supply rises as high as 1% then CSPI LQ45 will rise by 55%.
4. Simultaneous Regression Model Estimation Based on the partial regression coeficient test
by using t test, from three independent variables,
namely interest rate (INF), interest rate (SBI) and money supply (MS) which is considered to have an effect on CSPI LQ45 during 2010 - 2016 which has signiicant effect only variable of money supply. As
for the equation test for all independent variables included in the regression model using the F test.
F test results as shown in Table 2. show Prob. F- Statistics of 0.000000 <0.05 which means H0 is
rejected. This indicates that all independent variables
consisting of inlation rate (INF), interest rate (SBI) and money supply (MS) simultaneously affect the CSPI LQ45 during the period of study 2010 - 2016.
can be explained by the inlation rate (INF), the interest rate (SBI) and the money supply (MS ) of 80.07%, while the rest, of 19.93% can be explained
by other variables outside of this research model. For
the adjusted termination coeficient (R2 adjusted) yielded a number of 0.793193 which means that
after considering the degree of freedom of the model used, all independent variables used in this study can
explain the changes occurring in the LQ45 index listed on the Indonesia Stock Exchange during 2010 -2016 for 79.32%.
V. CONCLUSION
Based on the research result, it can be concluded that: 1) the inlation rate during the period of 2010-2016 did not affect the CSPI LQ45; 2) the interest rate during the 2010- 2016 study period did not affect the CSPI LQ45, but had the opposite direction to the CSPI LQ45, this was in accordance with the theory; 3) the money supply has a signiicant inluence and direction in the direction of CSPI LQ45, this is in accordance with the theory. 4) Simultaneously, the inlation rate, interest rate and money supply have a signiicant inluence on CSPI LQ45.
The results also show that for the money supply when viewed from the lowest value that occurred
in January 2010 as the initial period of research while the highest value occurred in December 2016 as the inal period of the study. This shows that the money
supply every time is always increasing, which means the economy is increasing.
ACKNOWLEDGMENT
I would like to express my special thanks of gratitude to Pakuan University that gave me the
opportunity to do this research. Secondly I would
also like to thank the Indonesia Stock Exchange (BEI) on data provided and used in this research (www.idx.co.id)
REFERENCES
[1] Widoatmodjo, S. 2015. Pengetahuan Pasar Modal: untuk Konteks Indonesia. Jakarta: PT Elex Media Komputindo.
[2] Samsul.M. 2006. Pasar Modal dan Manajemen Portofolio. Surabaya: Erlangga.
[3] Sahu, Tarak Nath. 2015. Macroeconomic
Variables and Security Prices in India during the Liberalized Period. New York: Palgrave
Macmillan.
[4] Sunariyah. 2006. Pengantar Pengetahuan Pasar Modal. Edisi Kelima. Yogyakarta: UPP STIM YKPN
[5] Manurung, A. 1996. Pengaruh Variabel Makro Ekonomi, Investor, dan Bursa yang Telah Maju Terhadap Indeks Bursa Efek
Jakarta. Tesis Magister Ekonomi, UI.
[6] Putong, I. 2015. Pengantar Ekonomi Makro. Jakarta: Mitra Wacana Media.
[7] Karya, D. dan Syamsuddin, S.. 2016. Makro Ekonomi: Pengantar untuk Manajemen. Jakarta: PT RajaGraindo Persada.
[8] Fuguitt, Diana and Shanton J. Wilcox. 1999.
Cost-Beneit Analysis for Public Sector
Decision Makers, Westport CN, Quorum Books
[9] Bodie Z., Kane A., and Marcus A.Z. 2014. Investment, 10th edition. New York: McGraw-Hill.
[10] Ali Ariin. 2004. Membaca Saham, Yogyakarta:
ANDI.
[11] Idris, A. 2016. Ekonomi Publik. Yogyakarta: Deepublish.
[12] Eduardus Tandelilin. 2010. Portofolio dan Investasi Teori dan Aplikasi. Edisi Pertama. Kanisius: Yogyakarta Tandelilin (2010, 343) [13] Liembono, RH. 2014. Analisis Fundamental.
Jakarta: BEI.
[14] Tanuwidjaja, W.. 2006. Siasat Investasi Cerdik: Bagi Investor Pemula. Yogyakarta: PT buku Kita.
[15] Sunariyah. 2010. Pengantar Pengetahuan Pasar Modal. Edisi ke-6. Yogyakarta: UPP-AMP YKPN
[16] Krugman, Paul & Obstfeld, Maurice. 1996. Ekonomi Internasional: Teori dan Kebijakan; Moneter. Jakarta: PT. Raja Graindo Persada [17] Rosyidi, S. 1996. Pengantar Teori Ekonomi;
Pendekatan Kepada Teori Ekonomi Mikro dan Makro. Jakarta: PT. Raja Graindo Persada.
[18] Widoatmodjo, S. 2015. Pengetahuan Pasar Modal: untuk Konteks Indonesia. Jakarta:
PT Elex Media Komputindo.