Shirkah
Journal of Economics and Business Vol. 2, No. 2, May-August 2017 ISSN: 2503-4235 (p); 2503-4243 (e)
Editor in Chief Sri Walyoto
Editorial Boards
Abu Umar Faruq Ahmad,
UBD School of Business and Economics, Brunei Darussalam
Amelia Fauzia,
Asia Research Institute, National University of Singapore, Singapore
Cedomir Nestorovic,
ESSEC Business School Asia Pacific, Singapore
Dwi Condro Triono,
Faculty of Islamic Economics and Business, IAIN Surakarta, Indonesia
Fahmy Radhi,
Faculty of Economics and Business Universitas Gadjah Mada, Yogyakarta, Indonesia
Hasan Basri,
Syiah Kuala University, Aceh, Indonesia
Johan Fischer,
Department of Social Sciences and Business Roskilde University, Denmark
Masudul Alam Choudhury,
Postgraduate Program in Islamic Economics and Finance, Trisakti University, Jakarta, Indonesia and the College of Economics and Political Science (CEPS) in Sultan Qaboos University (SQU), Oman
M. Falik Isbah,
School of Humanities and Social Science, University of New South Wales, Australia
M. Ishaq Bhatti,
La Trobe Business School Department of Economics and Finance La Trobe University, Australia
Najib Kailani,
Nunung Nurul Hidayah,
Aston Business School, Aston University, Birmingham, United Kingdom
Shaikh M Ghazanfar,
Departement of Economics, University of Idaho, Russian Federation
Managing Editors Fitri Wulandari Jasanta Perangin-angin
Assistant to Editor M. Endy Saputro M. Zainal Anwar Supriyanto
Shirkah Journal of Economics and Business is a peer-reviewed journal published three times a year (January-April, May-August and September-December) by Faculty of Islamic Economics and Business, Institut Agama Islam Negeri (IAIN/ State Institute for Islamic Studies) Surakarta Central Java, Indonesia. The main objective of Shirkah is to offer an academic space of exchange ideas and initiate the increase number of qualified article produced by postgraduate students, practitioners and academicians.
Editorial Office Ruang Jurnal Shirkah
Ground Floor, West Gate,
Faculty of Islamic Economics and Business IAIN Surakarta
Jln. Pandawa No. 1, Kartasura, Sukoharjo, Jawa Tengah Kode Pos. 57168 Phone (+62271) 781516 Fax: (+62271)782336
Shirkah
Journal of Economics and Business Vol. 2, No. 2, May-August 2017 ISSN: 2503-4235 (p); 2503-4243 (e)
Table of Contents
Articles
Shairil Izwan Taasim
Ramali Yusoff 127
An Instrument Developing Cashless in Malaysia
Aam S. Rusydiana
Irman Firmansyah 139
Efficiency versus Maqasid Sharia Index An Application on Indonesia Islamic Bank
Azhar Ibrahim 167
The Call for Islamic Economics Shades of Contestation
Warsono 199
Deferred Tax Assets and Deferred Tax Expense Against Tax Planning Profit Management
Lisdawati Arifin 215
Earning on Response Coefficient in Automobile and Go Public Companies
Farihatul Qamariyah 239
ISSN: 2503-4235 (p); 2503-4243 (e)
Earning on Response Coefficient in Automobile and Go
Public Companies
Lisdawati Arifin Universitas Bungkarno [email protected]
Abstract
This study aims to analyze factors that influence earnings response coefficients (ERC), simultaneously and partially, composed of leverage, the systematic risk (beta), growth opportunities (market to book value ratio), and the size of the firm (firm size), selection of the sample in this study the author take 12 automakers and components that meet the criteria of completeness of the data from the year 2008 to 2012, entirely based on consideration of the following criteria: (1) the company’s automotive and components are listed on the stock exchange, (2) have the financial statements years 2008-2012 (3) has a return data (closing price) the first day after the date of issuance of the financial statements. This study uses secondary data applying multiple linear regression models to analyze and test the effect of independent variables on the dependent variable partially (t-test), simultaneous (f-test), and the goodness of fit (R-square) on a research model. The result shows that leverage, beta, growth opportunities (market to book value ratio) and size along with (simultaneously) the effect on the dependent variable (dependent variable) earnings response coefficients. Partially leverage negatively affect earnings response coefficients, partially beta negatively correlated earnings response coefficients,
partially growth opportunities (market to book value ratio) significant effect on earnings response coefficients, partially sized companies (firm size) significantly influence earnings response coefficients
Introduction
Statement of financial accounting standards (IAS) 1 states profit has benefits for assessing management performance, helping to estimate representative earnings capacity in the long terms, it forecast earnings and assess risks in investments or loans (FASB, 1985; Fainshmidt, 2017). One of the elements in the financial statements of the most widely observed and awaited information is an income statement, a report that provides information on profits (earnings) achieved by the company during the period (Vakharia, 2017). Profit achieved by a company is one measure of the performance and consideration by investors or creditors in making investment decisions or to provide additional credit, firms reporting high profits will certainly encouraging investors to invest because they will get paid on the each shareholding owned (Gianni 2017; Brown, 2017; Berchicci, 2017). Earnings information is a reference for investors to invest to the company for earnings, positive or negative, obtained from the company’s income statement will affect stock returns. The magnitude of this effect will be low, especially for a negative earnings (loss). Generally in knowing good earnings quality can be measured using earnings response coefficient (ERC), which is a form of measurement in the information content of profit. Definition of earnings response coefficients (earnings response coefficient) is defined as the effect of each dollar of unexpected earnings on stock returns, and is usually measured by the coefficient of the regression slopa abnormal stock returns and unexpected earnings.
response coefficient. With such thinking that the more permanent income changes over time, the higher the profit coefficient because this condition indicates that the profits from the company is continuously increasing, apart from that relation to the capital structure.
Other research on the factors that influence the ERC conducted by A. Zubaidi Indra Agus Zahron, Ana Rosianawati (2008). Of the four factors that can affect the quality of earnings is only beta and market to book value ratio has a significant influence on the risk of earnings quality, while other variables, namely leverage and size did not significantly affect the quality of earnings, but empirically, a significant difference between levarage independent variables, beta, market-book value ratio, as well as firm size together against ERC on the property and real estate company listed on the Indonesia Stock Exchange in 2004-2008.
Based on the above background, the authors are keen to re-analyze the factors associated with the ERC. In a previous study tested several variables that provide different results. Assuming context, research time and the object or the sample under study is different, so the research can yield different conclusions. The factors used in this study is the leverage, proxied systematic risk in the market beta, opportunity grow proxied by the market to book value ratio, and the size of the company (firm size). The formulation of research problems are is leverage, beta, growth opportunities, and firm size earnings response coefficient effect on either partially or simultaneously? The purpose of this study was to test is there a leverage effect, beta, growth opportunities, and firm size of the earnings response coefficient either partially or simultaneously, against earnings response coefficient (ERC).
is of good quality would deliberately give a signal to the market in the form of information, so the market is expected to differentiate good and bad quality. If the earnings announcement as a signal of good (good news) for investors, the rise in corporate profits, then the reaction brought to the stock price is rising stock prices, and vice versa.
Financial Statements and Annual Report
Earnings Response Coefficient (ERC)
Earnings quality may be indicated as the ability to gain information provide a respons to the market. In other words, earnings reported have a response force (power of response). The strong market reaction to earnings information reflected by the earnings response coefficients (ERC) shows the quality of reported earnings. Scott (2000) and Etty (2008) states that the Earnings Response Coefficient (ERC) measures how much stock returns in response to the profit figures reported by the companies that issue securities. In other words, earnings response coefficient (ERC) is a reaction to the earnings was announced (published) by the company. This reaction reflects the quality of a company’s reported earnings. And the level of earnings response coefficient (ERC) is determined responsive power that is reflected from the information (good / bad news) contained in profits. Earnings response coefficient (ERC) is one measure or proxy is used to measure the quality of earnings (Collins et al., 1984).
Companies with high leverage level means having greater debt than capital. Thus, if an increase in the income benefit is the debtholders, because the debtors have faith that the company will be able to make payments on the debt. However, this will be responded negatively by investors because investors will assume that the company will be more profitable because more priority creditors debt repayment rather than payment of dividends. In doing so the better the condition of corporate profits, the more negative the response of shareholders. Results of tests performed by Mulyani et al. (2007) showed that financial leverage significantly affect the earnings response coefficient (ERC).
H1 : There is a negative impact of leverage, on Earnings response coefficient
Investors will reduce the level of risk acceptance by considering the specific risk of a company in making investment decisions. Sensitivity of investors to information about the company little risk will be greater for companies with less risk more credible (Palupi, 2006). Mulyani et al. (2007) shows that the risk systematic negatively related to the ERC. In line with research by Collins and Kothari (1989) that the risk showing the variation between companies, and risk-free interest rate which shows the variation over time empirically proven significant negative effect to the earnings response coefficient. Different with the research that was done by Margaretta Jati Palupi (2003) suggest a significant difference between systematic risks (beta) to Earnings response coefficient.
H2: There is a positive influence between beta, on earnings response coefficient
Collins and Kothari (1989) argue companies that have greater growth opportunities will have higher earnings response coefficient. This condition indicates that the greater the opportunity to grow the company, the higher the chance of companies gain or increase profits from the company in the future. Another study conducted Andyani and Mulyani (2007) suggests there is significant influence between growth opportunities (market to book value ratio) against partially earnings response coefficient.
Sri Mulyani, Nur Fun and Andayani (2007) reported significant effect on earnings firm size partial response coefficient.
H4: The size of the company a significant effect on earnings Coeefficient response
In his research, A. Zubaidi Indra, Agus Zahron and Ana Rosianawati (2011) empirically find a significant difference between the independent variables include the leverage factor, beta, market to book value ratio, as well as firm size against quality of earnings (earnings response coefficient) simultaneously.
H5: There is a positive influence between leverage, beta, growth oppurtunities (market to book value ratio) firm size of the coefficient simultaneously earnings response coefficient response simultaneously.
Framework
growth Opportunities
X4
Exchange, Indonesian Capital Market directory is (ICMD), JSX Statistics, IDF Quarterly Statistics, IDX montly Statistics, Fact Book and list the Securities Exchange (EFD).
To select the sample, the author took 12 automakers and components that meet the criteria of completeness of the data from the year 2008 to 2012, entirely based on consideration of the following criteria: automotive and components companies listed on the Stock Exchange; have the financial statements for 2008-2012; and has a return data (closing price) the first day after the date of issuance of the financial statements.
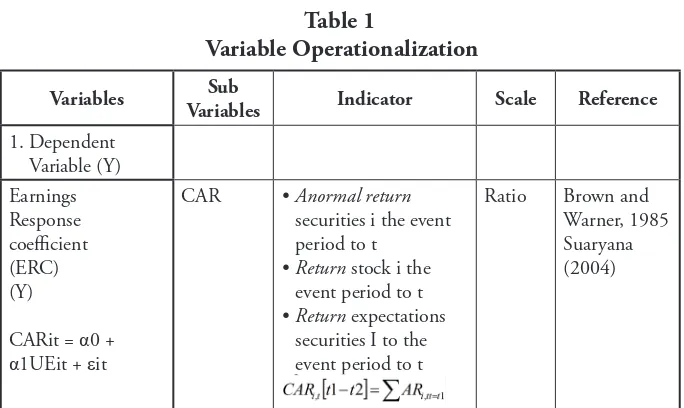
Variable of Operational Research securities i the event period to t
• Return stock i the event period to t
• Return expectations securities I to the event period to t
Response UE • Unexpected earnings company’s iin the period (years) t
• Profit accounting company’si in period (years) t
• Profit accounting company’s I in the
Multiple linear regression analysis is an analysis that is used to find an association between two or more independent variables on the dependent variable. The model used in this study:
ERCit = β0 + β2LEVit 1 + β3Betait + β4MBit + β5SIZEit + εit
Information :
ERCit = Coefficient company earnings response i in period t Levit = The capital structure of the company i in period t
Βetait = Systematic risk (beta) companies i in period t MBit = Growth Companies i in period t
SIZEit = Size Companies i in period t
Multiple linear regression
Processing of data by multiple linear regression analysis, to see the effect of leverage, beta, Market to book value ratio, Firm Size and mathematical approach as follows:
Y = a + b1x1 + b2X2 + b3X3 + b4X4
Information :
Y = Earnings response coefficient a = constants
b1 = regression coefficient leverage b2 = regression coefficient beta
b3 = regression coefficient Market To book value ratio b4 = The regression coefficient size
X1 = leverage X2 = beta
Here is how to detect the symptoms of deviation from the classical assumptions above third. Multicolinearity, to test multicolinierity to see VIF = 1 / (1-r2), if close to 1 means multikol harmless (Gujarati, 1995). Autocorrelation, to detect the presence of symptoms can be used autokolerasi Durbin-Watson test test. Heterocedastity, to detect heterokedastisitas can be done by Spearman rank correlation test. Statistical descriptions provide an overview or a description of the data shown in the average value (mean), standard deviation, variance, maximum and maximum and skewness (skewed distribution). The following will explain more about Leverage, Beta, Growth and Firm Size oportunities in companies’ otomitif and components are listed on the Stock Exchange during the years 2008-2012.
Table 2
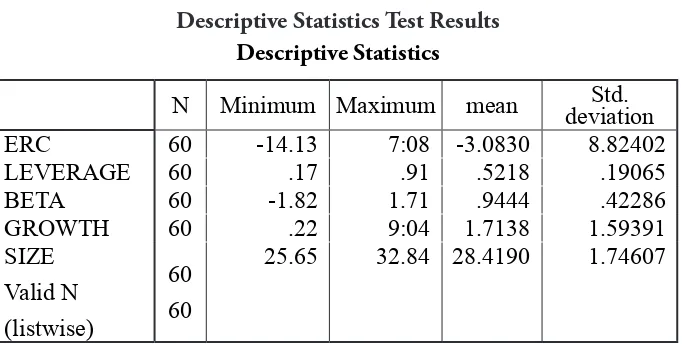
Descriptive Statistics Test Results Descriptive Statistics
N Minimum Maximum mean Std.
deviation
ERC 60 -14.13 7:08 -3.0830 8.82402
LEVERAGE 60 .17 .91 .5218 .19065
BETA 60 -1.82 1.71 .9444 .42286
GROWTH 60 .22 9:04 1.7138 1.59391
SIZE Valid N (listwise)
60
60
25.65 32.84 28.4190 1.74607
of 0.52; and a standard deviation of 0.19. This means that the average asset growth only reached 52%. Beta (risk) has a minimum value of -1.82; the maximum value of 1.71; the average value of 0.94; and a standard deviation of 0.42. Therefore, the level of systematic risk reached an average below 1, relatively low compared to the average level of risk in the Indonesia Stock Exchange. Growth opportunitieshave a minimum value of 0.22; the maximum value of 9.04; the average value of 1.71; and a standard deviation of 1.59. Similarly, the rate of sales growth expectations for annual average only reached 1.17% at a standard deviation of 1.59% also remains relatively low throughout the study period, for the year 2008 to 2012 there was a crisis of the world, so it is very volatile.Firm sizehas a minimum value of 25.65; the maximum value of 32.84; the average value of 28.41; and a standard deviation of 1.74. Therefore, the asset growth reached an average of 28.41% is relatively high compared to the industry average is 5 to 10% per year
Test Results
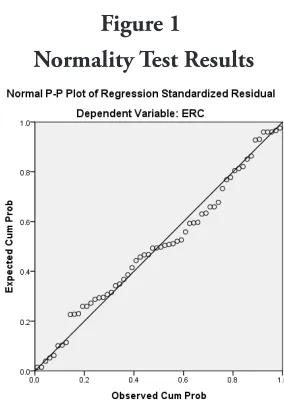
Figure 1
Normality Test Results
At the output of SPSS version 20.0, PP Plot of Regrassion the data dots tend to follow a straight diagonal line, then the data can be considered normally distributed or meet the assumption of normality.
Table 3
Test Results Multicollinearity
Model B
Coefficients Unstandardized
Standardized Coefficients
T Sig. Tole-rance
Collinearity Statistics Std.
Error
Beta VIF
1
(Constant 1,763 4120 .428 .000
LEVERAGE -8202 3502 -1182 -5818 .000 .982 1,018 BETA -3081 3,425 -.112 -.899 .372 .928 1,078 GROWTH 4078 1,834 .232 2,224 .030 .654 1,528 SIZE 9447 3272 .526 2887 .006 .632 1,582
variables that have a tolerance value of less than 0.1; thus these variables did not happen multicollinearity.
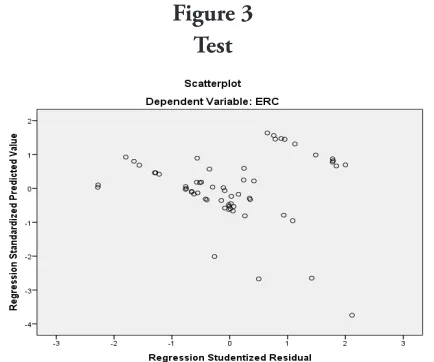
Figure 3 Test
Based on the picture above it can be concluded that there is no clear pattern, and dots spread and does not form a specific pattern, it does not happen heterokedastisitas.
Table 4
Test Results Autocorrelation Model Summary
Model R R Square Adjusted R Square
Std. Error of the Estimate
Durbin-Watson
1 .712a .668 .622 4.30350 2,036
a. Predictors: (Constant), GROWTH, SIZE, BETA, LEVERAGE b. Dependent Variable: ERC
From result output table above, it can be seen that the value of
1.4443 <2.036 <2.2726, meaning that no autocorrelation. Test Results Statistics
Partial test (tcount test)
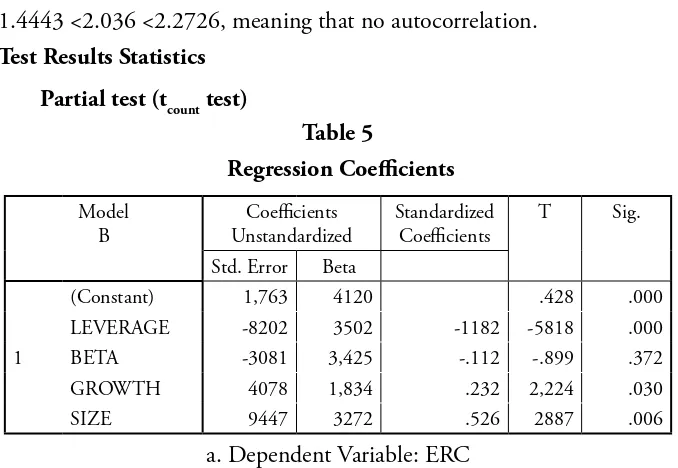
Table 5
(Constant) 1,763 4120 .428 .000
LEVERAGE -8202 3502 -1182 -5818 .000 BETA -3081 3,425 -.112 -.899 .372 GROWTH 4078 1,834 .232 2,224 .030
SIZE 9447 3272 .526 2887 .006
a. Dependent Variable: ERC
Partial test results (test of t-count) for each variable, as follows: first, the results of the partial testing of the effect of Leverage Earnings Response Coefficient (ERC) show t significance of 0,000 smaller than the 0.05 level, so statistically significantly influence Leverage to Earnings Response Coefficient (ERC), the coefficient is negative it means between Leverage and Earnings Response Coefficient (ERC) associated negative, it shows that if leverage increases, Earnings Response Coefficient (ERC) decreased. Second, Beta influence on the test results of the Earnings Response Coefficient (ERC)
suggesting that if growth opportunities increases, Earnings Response Coefficient (ERC) also increased.
Fourth, size of the partial test results Earnings Response Coefficient (ERC) showed significant t 0,006 smaller than the 0.05 level, so statistically significant effect partially size with Earnings Response Coefficient (ERC), The coefficient is positive, it means between the size andEarnings Response Coefficient (ERC) positively related, suggesting that if the Size increases,
Earnings Response Coefficient (ERC) also increased. Based on the above table, the model of multiple linear regression equation was obtained:
Y = 1,763 - 8,202X1 - 3,081X2 + 4,078X3 + 9,447X4
From the results of the multiple linear regression equation, each independent variable can be interpreted influence on Earnings Response Coefficient (ERC). If leverage (X1), Beta (X2), Growth opportunities (X3)
and Size (X4) is equal to zero, then the value Earnings Response Coefficient (ERC) (Y) of 1,763. Any increase leverage (X1) of 1 percent and other independent variables constant, Earnings Response Coefficient (ERC)
decreased by 8.20%. Earnings Response Coefficient (ERC) decreases. Each increase of 1 unit Beta and other independent variables constant, Earnings Response Coefficient (ERC) decreased by 3,081 percent. The coefficient is negative means going negative relation between the DAR with abnormal stock returns, increasing beta (risk), and Earnings Response Coefficient (ERC) drop. Any increase in Growth opportunities a 1 percent and other independent variables constant, the abnormal stock returns increased by 4.078 percent. The coefficient is positive, meaning a positive relationship between opportunities to grow with Earnings Response Coefficient (ERC), Getting up growth opportunities, then Earnings Response Coefficient (ERC)
variables constant, Earnings Response Coefficient (ERC) an increase of 9.47 percent. The coefficient is positive, meaning a positive relationship between the Size and Earnings Response Coefficient (ERC), Getting up Size,
Earnings Response Coefficient (ERC).
Simultaneous Test (Fcount test)
Table 6
ANOVA Variant Analysis
ANOVAa
Model Sum of Squares Df mean Square F Sig.
1
Regression 1049.842 4 262 461 4,172 .000b Residual 1018.605 55 18 520
Total 2068.448 59
a. Dependent Variable: ERC
b. Predictors: (Constant), GROWTH, SIZE, BETA, LEVERAGE
Based on table 6 above, using a 95% confidence level, a = 0.05, df 1 (the number of variable -1) = 4, df 2 (n-k-1) = 55 (60-4-1), the obtained results F study of 4,172. Values obtained 0,000b significance. This value is
Table 7
The value of R Square Hypothesis
Model Summary
Model R R Square Adjusted R Square
Std. Error of the Estimate
1 .712a .668 .622 4.30350
a. Predictors: (Constant), GROTWH, SIZE, BETA, LEVERAGE
From the results of hypothesis testing known to the R value of 0.712 (close to one) means there is a very strong relationship between
Leverage, Beta, Growth opportunities and Firm Size to Earnings Response Coefficient (ERC), Adjusted R Square of 0.622, means that the direct influence of independent variables on the dependent variable amounted to 62.2%, while 37.8% are influenced by other factors outside the model which is not included in this study were categorized as an error. Standard Error of the Estimate determines the number of errors in a regression model to predict the value of Y. From the regression results obtained value of 4.3035 (unit Earnings Response Coefficient), It means the number of errors in mempediksi Earnings Response Coefficient (ERC) at 4.3035.
Hypothesis one (H1) to determine the effect of independent variables (independent vaiable) Leverage partially on the dependent variable (dependent vaiable) Earnings Response Coefficient (ERC). Table
distributiont at a = 0.5, the degrees of freedom (df ) 60-4-1 = 55, with a two-sided test (significance 0.05) was obtained t table of 2.004, based on table 4.5, t research by 5.818t count> t table (5818> 2,004), then accept and reject Ho Ha, meaning partially significant effect between leverage against
Earnings Response Coefficient (ERC); because the coefficient is negative, then the negative effect on Earnings Leverage Response Coefficient (ERC).
(dependent variable) Earnings Response Coefficient (ERC). Distribution table t at a = 0.5, the degrees of freedom (df ) 60-4-1 = 55, with a two-sided test (significance 0.05) was obtained t table of 2.004, based on table 4.5, t research at 0.889. t count<t table (0.889 <2.004), then reject Ha and accept Ho, meaning that partially Beta has no effect onEarnings Response Coefficient (ERC). The coefficient is negativethen Beta negatively correlated to the Earnings Response Coefficient (ERC).
Hypothesis three (H3) determines the effect of independent variables (independent vaiable) Growth opportunitiespartially on the dependent variable (dependent vaiable) Earnings Response Coefficient (ERC). Distribution table t at a = 0.5, the degrees of freedom (df ) 60-4-1 = 55, with a two-sided test (significance 0.05) was obtained t table of 2.004, based on table 4.5, t study of 2,224. t count > t table (2,224> 2,004), then accept Ha and reject Ho, meaning partial Growth opportunities significant effect on Earnings Response Coefficient (ERC).
Hypothesis four (H4) determines the effect of independent variables (independent vaiable) Firm Size partially on the dependent variable (dependent vaiable) Earnings Response Coefficient (ERC). Distribution table t at a = 0.5, the degrees of freedom (df ) 60-4-1 = 55, with a two-sided test (significance 0.05) was obtained t table of 2.004, based on table 4.5, t research at 2.887. t count> t table (2.887> 2.004), then accept Ha and reject Ho, that is partiallyFirm Size significant effect on the Earnings Response Coefficient(ERC). Hypothesis five (H5) to determine the effect of all independent variables consisting of Leverage, Beta, Growth opportunities and Firm Size together on the dependent variable (dependent variable) Earnings Response Coefficient(ERC).
research> F table then accept Ha and reject Ho. That is to say Leverage, Beta, Growth opportunities and Firm Size simultaneously influence Earnings Response Coefficient (ERC). Based on the research, the regression equation on the hypothesis of a single during the observation period (2008-2012) display the test results by using variable Leverage (X1) significant negative effect on Earnings Response Coefficient (Y). The results of the t test showed t research greater than t table, it means accepting Ha and rejecting Ho. The coefficient is negative; thus it can be concluded that partial leverage proxied by the Debt to Asset Ratio (DAR) significant negative effect on Earnings Response Coefficient, this means that the higher the debt the company will be seen as a burden to be borne by the company.
Leverage the automotive companies that negativelythis is because the average long-term debt has decreased, while the assets of the company increased, so that the ratio of long-term debt to assets is getting smaller.
This study supports the idea Dhaliwal et al. (1991) and Sri Mulyani (2003) that indicates earnings response coefficient negatively related to the level of leverage.
The test results using a Beta variable (X2) showed no effect on
The test results using variables growth opportunities (X3) shows the effect onEarnings Response Coefficient (Y). The results of the t test showed t research greater than t table, it means accepting Ha and rejecting Ho.
The results show that the automotive company that has a great growth opportunity will have a high ERC. This condition indicates that the greater the opportunity to grow the company, the higher the chance of Companies gain or increase profits from the company in the future. In the automotive company is characterized by increased investment as indicated by the increase in places of assembly such companies across the region and the high increase in sales, this shows the growth of the company rose sharply.
Growth opportunities provided by the Price to Book Value Ratio (PBVR). The study finds consistentency with Collins and Kothari (1989), which shows that companies that have greater growth opportunities will have erning Response Coefficient (ERC) tall. The test results using variables Firm Size (X4) shows the effect on Earnings Response Coefficient
Based on the research that has been done, from the regression equation on the hypothesis of five during the observation period (2008-2012) shows that the test results by using variable Leverage (X1), Beta (X2), growth opportunities (X3), Size (X4). The results of the t test showed t research greater than t table, it means accepting Ha and rejecting Ho. That is to say Leverage, Beta, Growth opportunities and Firm Size simultaneously influence Earnings Response.
Conclusion
This study can be concluded as follows: leverage proxied by the Debt to Asset Ratio (DAR) significant negative effect on Earnings Response Coefficient; systematic risk (beta) had no effect on Earnings Response Coefficient (ERC); chance growth (growth opportunities) that proxied by Price to Book Value Ratio (PBVR) significant effect on Earnings Response Coefficient; size of company (Firm Size) significantly influence
Earnings Response Coefficient; and the test results simultaneously by using all independent variables are Leverage, Beta, and Firm Size Growth opportunities showed positive and significant impact on the Earnings Response Coefficient (ERC).
References
Andayani, Nur F. F. dan Sri M. (2007). “Faktor-Faktor yang mempengaruhi Earnings Response Coefficient Pada Perusahaan yang Terdapat Di Bursa Efek Jakarta,” Jurnal Akuntansi dan Keuangan. STIESIA Surabaya.
properti dan Real Estate yang terdaftar di BEI).
Cho, LY, and K. Jung. (1991). “Earnings Response Coefficients: A Synthesis of Theory and Empirical Evidence.” Journal of Accounting Literature Vol.10. pp 85-116.
Claude et. all. (1996). ”Political Risk, Economic Risk and Financial Risk”, Financial Analysts Journal, November-December.
Departemen Keuangan RI, BAPEPEM. (2006). Keputsan Nomor: KEP-134/BL/2006, tentang kewajiban penyampaian laporan keuangan tahunan bagi emiten atau perusahaan publik
Harahap, S. S. (2007). Analisis Kritis Atas Laporan Keuangan. Jakarta: PT. Raja Grafindo Persada.
Husnan, S. (2003). Dasar-Dasr Teori Portofolio dan Analisis Sekuritas Yogyakarta: BPFE Yogyakarta.
Husnan, Suad and Enny P. (2004). Dasar-dasar Manajemen Keuangan. Edisi keempat, YKPN : Yogyakarta.
Jogiyanto. (2009). Teori Portofolio dan Analisis Investasi. Yogyakarta : BPFE Yogyakarta.
Margaretta Jati Palupi (2003). Faktor-faktor yangmempengaruhi EarningResponse Coefficient pada perusahaan yang terdaftar di Bursa Efek Jakarta .Jurnal Akuntansi.
Minyue D and Qingmei X. (2010). The effect of governance transparency on earnings response coefficient: evidence from emerging markets.
Mulyani, S., Nur F.A. and Andayani. (2007). Faktor-faktor yang mempengaruhi Earnings Response Coefficient (ERC) pada perusahaan yang terdaftar di BEI. JAAI 1(1), pp. 35-45.
Murwaningsari, E. (2008). Beberapa faktor yang memepengaruhi Earnings Response Coefficient (ERC). Simposium Nasional Akuntansi (SNA) ke XI, Pontianak.
Naimah, Z. dan Sidharta U. (2006). Pengaruh ukuran perusahaan, pertumbuhan laba dan profitabilitas perusahaan terhadap Earnings Response Coefficient Dan koefisient respon nilai buku ekuitas. Simposium Nasional IX.
Pandji, A and Piji P. (2001). Pengantar Pasar Modal, Edisi Revisi, Rineka Cipta : Jakarta.
Riyanto, Bambang., (2001). Dasar-dasar Pembelanjaan Perusahaan, BPFE : Yogyakarta.
Suaryana. (2008). “Pengaruh konservatisme laba terhadap Earning Response Coeficient (ERC),” Naskah Publikasi Skripsi, Universitas Udayana. Syafarudin, A.. (1994). Alat-alat Analisis dalam pembelanjaan, Andi Offset:
Yogyakarta.
Van Horne, J. (2000). Financial Management and Policy, Prentice Hall : New Jersey.
Shirkah currently offers two routes to submit manuscripts. We highly recommend to submit the articles which are made using OJS (Open Journal System). Feel free register as author soon through visiting http:// shirkah.or.id/index.php/home/user/register. The authors may directly send their manuscripts, along with their resume, to shirkahiainsurakarta@ gmail.com. Please prepare your manuscripts, using following guidelines: 1. Manuscript must be written in English. Submitted articles should not
have been published or be under review for publication with another journal.
2. Manuscript’s length is about 15 – 20 pages, typed in one-half spaced on A4-paper size.
3. Manuscript must include an 150 – 200 word abstract and keywords. 4. Manuscript must be arranged as follows: Title, Name of Author,
E-mail address, Abstract, Keywords, Introduction (including method if any), Discussion, Conclusion, References.
5. Manuscript’s titles not more than ten words.
6. Manuscript must be submitted in Microsoft Word or RTF.
7. Arabic words should be transliterated according to the style of International Journal of Middle Eastern Studies.
8. Manuscript references are preferably derived from the up-to-date references.
9. The author’s resume should be submitted separately, consisting of at least full name, institutional address, phone number, areas of studies, and recent publications (if any).
Swann, G. M. Peter. (2014). The Economics of Innovation an Introduction. Cheltenhum & Northampton: Edward Elgar.
in-text citation: (Swann, 2014)
Articles in reference books
Alatas, S. F. (2006). Islam and the Science of Economics in Abu Rabi’, I.M. The Blackwell Companion to Contemporary Islamic Thought. USA: Willey-Blackwell (pp. 587-606).
in text citation: (Alatas, 2006)
E-Book
Hackett, Rosalind (2007). “Religous Dimentions of War and Peace: Introduction.” Dalam Gerrie ter Haar dan Yoshio Tsuruoka (Ed.), Religion and Society: An Agenda for the 21st Century (h. 3-6). Retrieved from http:// brill.nl.
in text citation: (Hackett, 2006)
Master’s thesis, from a commercial database
McNieI, D. S. (2006). Meaning through narrative: A personal narrative discussing growing up with an alcoholic mother (Master’s thesis). Available from ProQuest Dissertations and Theses database. (UMI No. 1434728)
in text citation: (Mc Niel, 2006)
Doctoral dissertation, from an institutional database
Adams, R. J. (1973). Building a foundation for evaluation of instruction in higher education and continuing education (Doctoral dissertation). Retrieved from http://www.ohiolink.edu/etd/
Bruckman, A. (1997). MOOSE Crossing: Construction, community, and learning in a networked virtual world for kids (Doctoral dissertation, Massachusetts Institute of Technology). Retrieved from http://www-static. cc.gatech.edu/--asb/thesis/
in text citation: (Bruckman, 1997)
Journal article with No DOI
Bourkhis, K., and Nabi, M. S. (2013). Islamic and conventional banks’ soundness during the 2007-2008 financial crisis. Journal Metrics, 22(2), 68-77.
in-text citation: (Bourkhis & Nabi, 2013).
Journal article with DOI
Ichwan, M. (2012). The Local Politics Of Orthodoxy: The Majelis Ulama Indonesia in the Post-New Order Banten. Journal Of Indonesian Islam, 6(1), 166-194. doi:http://dx.doi.org/10.15642/JIIS.2012.6.1.166-194
In text citation : (Ichwan, 2012)
Abstract as citation
Hasan, N. (2012). Islamist Party, Electoral Politics And Da’wah Mobilization Among Youth : The Prosperous Justice Party (PKS) in Indonesia. Journal of Indonesian Islam, 6(1), 17-47. Abstract from http:// jiis.uinsby.ac.id/index.php/jiis/article/view/97
in text citation : (Hasan, 2012)
Mass media article
Sahal, Akhmad (2014, March 2). Kiai Sahal dan Realisme Fikih.Tempo Magazine, p. 120.
Fisher, B. S., Cullen, F. T., & Turner, M. G. (2000). The Sexual Victimization of College Women. Research Report.
in text citation : (Fisher, Cullen, Turner, 2000)
Monograph
Routray, Bibhu Prasad (2013), National Security Decision-Making in India (RSIS Monograph No. 27). Singapura: Rajaratnam School of International Studies.
in text citation :(Routray, 2013)
Proceeding article
Sudibyakto, Hizbaron, D.R., & Jati, R (Ed.) (2009), Proceeding International Seminar Disaster Theory, Research and Policy. International seminar held by Sekolah Pascasarjana, Universitas Gajahmada, Yogyakarta, 8-9 Desember 2009.
in text citation : (sudibyakto and Jati, 2009)
Paper conference/seminar/symposium
Janutama, Herman Sinung (2011). “Kraton dan Hubungan Antar Agama.” Paper presented in Seminar Kraton dan Panatagama held by Center for the Study of Islam and Social Transformation (CISForm), Yogyakarta, 17 November.
in text citation :(Janutama, 2011)
Online article in web
Shiva, (2006, February). Bioethics: A Third World Issue. Native-web. Diperoleh dari http://www.nativeweb.org/ pages/legal/shiva.html
Kessy, S. S. A., & Urio, F M. (2006). The contribution of microfinance institutions to poverty reduction in Tanzania (Research Report No. 06.3). Retrieved from Research on Poverty Alleviation website: http://www. repoa.or.tz /documents_storage/Publications/Reports/06.3_Kessy_and_ Urio.pcif
in text citation : (kessy and urion, 2006)
Holy book
Qur an, 2 (25)
In text citation : (Q. al-Baqarah 2:25).
Encyclopaedia
Graycar, Adam (1992). Social Welfare Policy. Dalam Mary Hawkesworth dan Maurice Kogan (Ed.), Encyclopedia of Government and Politics (Vol. 1). London: Routledge.
in text citation : (Graycar, 1992)
Interview
Sultan Hamengkubuwono X (interview, 2011, April 19)
in text citation : (Hamengkubuwono, 2011)
Documentary film
Steijlen, Fridus (2008). A Day in the Life of Indonesia [documentary film, 58 minutes]. Leiden: KITLV Press.