OPTIMAL PARAMETER SELECTION FOR INTENSITY-BASED
MULTI-SENSOR DATA REGISTRATION
Ebadat G. Parmehr a,b, *, Clive S. Fraser a,b, Chunsun Zhang a,c, Joseph Leach b
a
Cooperative Research Centre for Spatial Information, VIC 3053, Australia b Department of Infrastructure Engineering, University of Melbourne, VIC 3010, Australia –
[email protected], (c.fraser, leach)@unimelb.edu.au
c School of Mathematical and Spatial Sciences, RMIT University, VIC 3000, Australia - [email protected]
KEY WORDS: Registration, Optical Imagery, LiDAR Point Cloud
ABSTRACT:
Accurate co-registration of multi-sensor data is a primary step in data integration for photogrammetric and remote sensing applications. A proven intensity-based registration approach is Mutual Information (MI). However the effectiveness of MI for automated registration of multi-sensor remote sensing data can be impacted to the point of failure by its non-monotonic convergence surface. Since MI-based methods rely on joint probability density functions (PDF) for the datasets, errors in PDF estimation can directly affect the MI value. Certain PDF parameter values, such as the bin-size of the joint histogram and the smoothing kernel, need to be assigned in advance, since they play a key role in forming the convergence surface. The lack of a general approach to the assignment of these parameter values for various data types reduces both the automation level and the robustness of registration. This paper proposes a new approach for selection of optimal parameter values for PDF estimation in MI-based registration of optical imagery to LiDAR point clouds. The proposed method determines the best parameters for PDF estimation via an analysis of the relationship between similarity measure values of the data and the adopted geometric transformation in order to achieve the optimal registration reliability. The performance of the proposed parameter selection method is experimentally evaluated and the obtained results are compared with those achieved through a feature-based registration method.
* Corresponding author.
1. INTRODUCTION
The automatic registration of multi-sensor data remains a research topic of interest in photogrammetry and remote sensing, due in large part to the increasing availability of Earth observation data from a range of sensors. The need for reliable and accurate automatic integration of multi-source data to exploit the complementary information of datasets is ongoing, and an area of current interest is the registration of aerial and satellite imagery with LiDAR (Light Detection And Ranging) point clouds. The fused imagery and LiDAR data, registered to 1-pixel level, is required for many applications, such as the creation of photorealistic 3D models, automatic building extraction, mapping, change detection and the updating of geo-information products.
Although multi-modal data may be provided in the form of complementary georeferenced datasets, residual misalignment errors often persist and these errors need to be removed through a further registration procedure. Conventional featured-based methods for registration of multi-sensor data rely on the robust detection of corresponding features in the data, such as points, lines and planes. However, feature-based registration of multi-modal data can suffer from a lack of evenly distributed corresponding features, as well as from accuracy limitations in the extraction of these features. Furthermore, features can appear differently in multi-modal datasets, which can greatly complicate the feature correspondence determination and decrease the level of automation.
Intensity-based (area-based) methods, on the other hand, do not rely on specific features to quantify similarity measures between
multi-modal datasets. Mutual Information (MI), which emanated from information theory in the mid 1990s (Collignon et al., 1995; Viola and Wells, 1997), is now a popular similarity measure for multi-modal image registration applications in medical imaging, remote sensing and computer vision.
MI quantifies the transformable information between two datasets using their joint probability density function (PDF), and since the joint PDF changes with the relative geometric transformation of the images, the MI value can vary for each and every transformation. Importantly, the maximum value of MI is expected to be achieved when the datasets are geometrically aligned (Collignon et al., 1995). A comprehensive review of technical aspects of MI adoption for the registration of multi-sensor data is provided by Pluim et al. (2003). Although, the effectiveness of MI-based methods for multi-sensor data registration has been established, they still suffer from appearance of local maxima in their convergence surfaces (non-monotonic convergence surface) (Mastin et al., 2009; Wang et al., 2012). This can degrade registration accuracy and robustness (Roche et al., 2000). Local maxima can occur due to the presence of good local matches between the datasets and noise (Pluim et al., 2003). Therefore, some modification to the similarity measure have been proposed to increase the reliability of this intensity-based registration method (Parmehr et al., 2012).
Up until now, the general approach to addressing the problem of non-optimal reliability of MI-based registration has been either to use a more reliable definition of the similarity measure, or to estimate a more appropriate joint PDF for the purpose of
registration. Since the bin-size of the joint histogram significantly affects the PDF, several statistical methods have been proposed to determine the optimum bin-size (Freedman and Diaconis, 1981; Knuth, 2006; Scott, 1979). These methods operate under the assumption that the density function of the method to determine the bin-size has been proposed based upon achieving the maximum value of both normalised MI and kurtosis of the convergence surface (Parmehr et al., 2013).
As distinct from the method proposed in this paper, the approaches referred to above neither provide a general solution for selection of an optimum bin-size for PDF estimation nor an analysis of the impact of the election on the robustness of the registration procedure. Aerial imagery and 3D LiDAR data have been utilised in this paper to efficiently analyse the effect of optimal bin-size selection in PDF estimation on the automatic registration of multi-sensor data.
This paper is organised as follows: Section 2 presents the proposed approach for optimum PDF estimation. Then, the performance of the intensity-based registration method using an optimum bin-size for the PDF is experimentally evaluated in Section 3 and conclusions follow in Section 4.
2. METHODOLOGY
2.1 Mutual Information
The statistical similarity of two random variables A and B, which measures the degree of dependence of A and B, can be defined as the distance between the joint PDF P(A,B) and the case of complete independence P(A)P(B). The well-known Kullback-Leibler probability divergence has been used to define the MI as value for every joint intensity a and b.
MI can also be defined using Shannon entropy (Shannon, 1948) via the following equation
). joint entropies are defined as
That is, in the case of misalignment, corresponding elements of images are duplicated in the joint PDF, which increases the value of the joint entropy. On the other hand, corresponding elements appear once in aligned images, yielding a smaller joint entropy. Since MI depends on the amount of overlapping area maximising of the marginal entropies rather than minimising the joint entropy value. This implies less effect of the relationship between the images on the MI value. In contrast, NMI is able to take into account any increase in marginal entropies through a change in joint entropy by using the ratio of joint and marginal entropies. As a result, more robust registration is achieved by utilising NMI instead of MI to find the appropriate geometric transformation of the dataset (Parmehr et al., 2013).The multi-variable generation of MI has also been defined via a higher-order joint entropy (McGill, 1954; Watanabe, 1960). The MI of three variables A, B and C is defined as pair of variables, Normalised Combined Mutual Information (NCMI) has been adopted for registration of optical imagery with LiDAR data (Parmehr et al., 2014). The NCMI of a variable C and two already aligned variables A and B is defined as intensity data is inherently registered via the generated digital surface model (DSM), NCMI is applied to exploit both the geometric dependence and complementary character of the LiDAR DSM and intensity data.
In order to adapt NCMI for registration of optical images and LiDAR data, both datasets need to be represented in the same data structure. In this paper, the 3D LiDAR dataset is treated as a 2D image. Therefore, the elevation and intensity values in the LiDAR data are both treated as image grey values.
2.2 Optimal PDF estimation
In accordance with the definitions of MI-based similarity measures, the statistical similarity between the datasets is calculated using the probability of coincident content of intensity pairs in the PDF. For instance, if the information content of co-occurring a and b, with a high value of probability, relates to corresponding regions in the images, the similarity measure can reflect the geometric misalignment
effect. Otherwise, it can mislead the registration process by having an even higher value of the similarity measure without any connection to geometric alignment. This highlights the role of the PDF in intensity-based registration methods.
Generally, the PDF of datasets can be estimated using parametric and non-parametric methods. The parametric estimators assume the PDF is a mixture of known probability functions, such as Gaussian, and the parameters are the only information that needs to be stored. However, the non-parametric estimators have no fixed structure and depend for an estimate upon all the data points being used.
Simply, the joint and marginal PDFs of the overlapping parts of both datasets can be estimated by histogramming as a non-parametric approach for PDF estimation. In histogramming, each entry of the joint histogram of the datasets denotes the number of elements of data with coinciding intensities. Dividing the joint histogram by the total number of members in the data, Nx, yields the joint PDF, and the marginal PDF of each dataset can be found by summing over the rows and columns, respectively. It can be adopted when estimates of derivatives are neither needed nor available (Bishop, 1995).
The kernel density estimator is widely used as a non-parametric density estimator of the PDF. It smooths out the contribution of each observed data point over a local neighbourhood using a Kernel function. The estimated density at any point x is estimated by other non-parametric approaches such as spline-based estimation (Mattes et al., 2003), partial volume estimation (PVE) (Maes et al., 1997), non-parametric windows (Dowson et al., 2008) and the wavelet-based approach (Peter and Rangarajan, 2008).
Regardless of the smoothing approach used for PDF estimation, all PDF estimators utilise the joint histogram of datasets. The histogram of two variables A and B can be defined as
B-spline basis function, and each sample of datasets is added to one histogram bin via
similarity measure is highly dependent upon the bin-size utilised in PDF estimation. The bin-size can be determined by dividing the range of intensities by the number of bins, and the number of bins plays a key role in representation of datasets for statistical similarity determination.
Furthermore, the bin-size of the histogram plays a crucial role as a smoothing parameter in the process of PDF estimation. For instance, the use of a small bin (a large number of bins) yields a spiky PDF, while the use of a large bin provides a very smooth PDF. Since the selection of the number of bins has a significant impact on both the MI value and the results of registration, an optimum number of bins that preserves the necessary information for similarity measure determination is required. In other words, the larger number of bins might highlight the role of noise and thus reduce the reliability of registration.
More importantly, the variation of the MI value does not always reflect the true geometric transformation of the images because it may highlight the role of increments of statistical correspondence rather than the geometric correspondence of the images.
In this paper, the idea of achieving maximum variation of the similarity measure for a unit geometric transformation is exploited. A component of statistical information that is more sensitive to geometric transformation is employed, rather than relying only on the value of the similarity measure. The proposed optimum bin-size is defined as
.
The derivations of NMI, and marginal and joint entropies with respect to the transformation μ, can be calculated as follows:
) marginal entropy of the fixed image is constant, and the moving image is transformed under different values of the transformation function. These require the estimation of the marginal entropy of the moving image, as well as the joint entropy of the images. The marginal entropy of the fixed image is therefore not related to the parameters of the transformation μ and this simplifies the calculation of the derivative of NMI (Thévenaz and Unser, 2000). The derivations of the PDF respect to the transformation can be derived as
.
Since the joint PDF is data dependent, the bin-size for its estimation should be based on data content, on every portion of the dataset.
The use of uniform bin-size is typically ineffective and may lead to misregistration, due to introduced artificial features, in regions that have higher statistical similarity, rather than real regions of images. For instance, in a portion of data which can be divided into a number of homogeneous regions, uniform bin-size derived from linear histogramming neglects the features in the dataset and thus provides inaccurate PDF estimation (Knops et al., 2006). The proposed non-linear binning approach takes data content into account and adapts, so variable bin sizes are generated to provide desirable clustering with a less dispersed joint PDF. Thus, the bin-size Di is not constant and can be defined as a function of clusters of the images. The k-mean clustering method has been utilised to create non-uniform bin sizes and increase the reliability of registration (Knops et al., 2006; Liu and Chrisochoides, 2006; Lo, 2003). The optimum number of clusters is achieved when the derivation of the NMI value with respect to the geometric transformation is maximised. This provides segmented images which reflect the maximum variation of the similarity measure for relative transformation.
In other words, only the regions with significant impact on the similarity measure with respect to transformation will be incorporated in its computation. This increases the reliability of registration by decreasing the number of local maxima that result from using less sensitive information content.
3. EXPERIMENTAL RESULTS AND DISCUSSION
This section presents experimental results obtained with the determined optimum bin-size of the PDF in the registration of aerial imagery and 3D LiDAR data. A conventional, widely adopted feature-based registration method used in photogrammetry was also implemented in order to validate the performance of the intensity-based approach. The results obtained from both the feature- and intensity-based methods were then compared.
3.1 Dataset
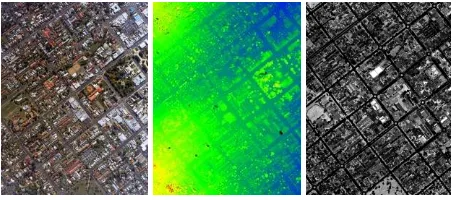
The dataset covered a 2 x 2 km suburban area of Bathurst, New South Wales, Australia. It comprised 20cm ground sample distance (GSD) aerial imagery from a Leica RCD105 digital camera. The corresponding LiDAR point cloud of 4pts/m2 point density, along with corresponding intensity data, was acquired in 2011 with a using Leica ALS50-II scanner. One of the aerial images, representing an urban area with many buildings, is shown in Figures 1, along with the corresponding LiDAR DSM and intensity image.
Figure 1. Aerial image (left), colour-coded LiDAR DSM (middle) and LiDAR intensity image (right)
It is noteworthy that the resolution of the imagery and LiDAR is sufficiently high to clearly demonstrate natural and man-made objects. As shown in Figures 1, the LiDAR DSM offers information on areas with significant elevation difference, whereas LiDAR intensity data is able to provide information for flat areas such as roads.
3.2 Procedure of feature-based registration
The collinearity equation model was utilised to estimate the transformation between the aerial image and the 3D LiDAR DSM. Camera calibration parameters including focal length, principal point and lens distortion were taken into account, and airborne GPS and IMU observations were used as initial values for the exterior orientation parameters (EOPs) of the aerial images.
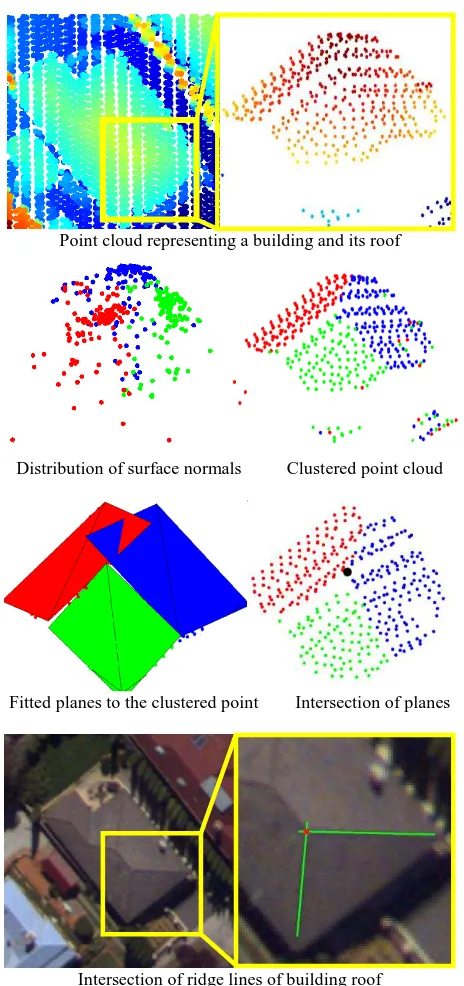
Extraction of distinctive features from a LiDAR point cloud is not a straightforward task, particularly when the density of the point cloud is not high. In this case, the ridge points of buildings were employed as features to be matched. Such features can be derived from point clouds and have demonstrated feasibility for registration (Choi et al., 2011; Habib et al., 2005). The building roof planes are first determined, and the intersection of roof planes then allows for the generation of ridge points. A graphical description of this method for the extraction of a corresponding point feature from the LiDAR point cloud and aerial image is shown in Figure 2.
As shown in the figure, a small portion of the point cloud is selected and then DSM points are clustered based on surface normals using fuzzy c-mean clustering (Sampath and Shan, 2010). The outliers of clustered point groups are removed using a RANSAC method (Fischler and Bolles, 1981) during the process of plane fitting planes. Afterwards, the fitted planes are intersected to determine the ridge point. It is noteworthy that the accuracy of extracted point features is highly dependent upon the density of the LiDAR point cloud and its accuracy.
The intersection of the ridge lines of the building roofs has been employed to extract corresponding point features in image space. An interactive method of ridge line extraction from aerial imagery was employed, partly due to reliability shortcomings of automatic methods. It is clear that the spatial and radiometric resolution of the imagery affects the accuracy of extracted point features. An array of 3 by 3 extracted ridge points in both imagery and LiDAR data were used to estimate EOPs of the images via the collinearity equation model.
3.3 Procedure of intensity-based registration
In order to bring 3D LiDAR and imagery data into the same coordinate system, the LiDAR points were back-projected into image space. Then, interpolation of the irregular back-projected LiDAR points to a regular format was carried out using nearest neighbour, linear and natural neighbour interpolation methods. Comparison of the estimated EOPs using different interpolation methods indicated that natural neighbour interpolation provided fewer artefacts and produced a slight improvement in accuracy. Since 3D LiDAR point cloud is back-projected to image space, only the occlusion of LiDAR data yields artefacts in the templates and produces non-corresponding regions. In addition, LiDAR data collected via several stripes may lead to artefacts. The effect of these can be resolved by the remaining corresponding regions of the template images.
Point cloud representing a building and its roof
Distribution of surface normals Clustered point cloud
Fitted planes to the clustered point Intersection of planes
Intersection of ridge lines of building roof
Figure 2. The procedure of point-feature extraction from point cloud and imagery data
Computation of similarity for whole datasets, such as high resolution remote sensing imagery and LiDAR data, is impractical due to the high cost of computation. Therefore, a well-distributed array of small patches called templates is adopted and the centres of these templates are used in the computation of transformation parameters.
In a similar way to the feature-based method, an array of 3 by 3 well-distributed corresponding points (templates) was employed to estimate the EOPs of the aerial image. The use of templates reduces the search dimensions from n (number of parameters, here n= 6) to 2 and decreases the risk of failure in the registration.
It is clear that a small size of template is not able to provide sufficient information to measure the statistical similarity of the
images due to the lack of common regions between images with large misalignment error. The registration approach therefore fails to find the correct transformation parameters. On the other hand, a large template increases the computation cost. More importantly, the complex transformation between the datasets may not be modelled with sufficient fidelity by a simple lateral translation in the x and y image coordinate directions. In this work, 1000 by 1000 pixel templates were utilised to find corresponding points in the LiDAR and imagery data. Figure 3 shows example corresponding templates for the aerial image, LiDAR DSM and LiDAR intensity image.
Figure 3. Example corresponding templates: aerial image (left), colour-coded LiDAR DSM (middle) and LiDAR intensity
image (right)
In order to exploit the complementary information of the LiDAR DSM and intensity images in the determination of similarity between the aerial imagery and LiDAR data, the NCMI similarity measure was adopted.
To determine the optimum number of bins, the derivation of similarity of the template with respect to transformation for the different number of bins is calculated using Parzen windowing. The number of bins which yields the maximum value of the determined similarity measure is assumed to be the optimum for PDF estimation, as indicated in Figure 4.
Figure 4. The derivation of similarity measure respect to transformation for 2-256 number of bins
The use of an optimum number of bins enables the similarity measure determination to use regions of the images that have the highest variation of statistical similarity of the images with respect to the geometric transformation. It provides a distinctive sharp peak in the similarity measure, which speeds up the optimization procedure and increases the reliability and robustness of registration by avoiding local maxima.
Here, a 2D Powell’s optimisation method (Press et al., 1992) has been employed for maximising the similarity measure, and the result of registering an aerial image with LiDAR data is shown for the example template in Figure 5.
Figure 5. Unregistered (left) and registered (right) aerial image (green) with LiDAR DSM (magenta)
3.4 Results
In order to compare the performance of feature- and intensity-based methods, 15 well-distributed corresponding points in LiDAR data and aerial image were used. EOPs of the aerial image were then estimated using 9 of the points as control points, whereas 6 were used as checkpoints. The estimated EOPs for the aerial image are listed in Table 1, and the corresponding accuracy estimates are provided in Table 2.
Table 1. Estimated EOPs of aerial image
EOPs GPS/IMU
Feature-based
Intensity-based Xp(m)
Yp(m) Zp(m)
739267.748 6299160.222
2275.655
739270.958 6299156.394
2249.355
739272.527 6299157.357
2248.921 v(deg.)
f(deg.) k(deg.)
0.51737 -3.19723 0.0175
0.6750 -3.2339 -0.1322
0.6505 -3.1803 -0.1345
Table 2. Errors of estimated EOPs of aerial image Error of EOPs Feature-based Intensity-based
sXp(m)
sYp(m)
sZp(m)
1.2589 0.8888 0.2496
0.1477 0.1122 0.0277
Mean(m) 0.7991 0.0958
sv(deg.) sf(deg.) sk(deg.)
0.0307 0.0446 0.0070
0.0038 0.0052 0.0008
Mean(deg.) 0.0274 0.0032
s0 (pixel) 0.82 0.12
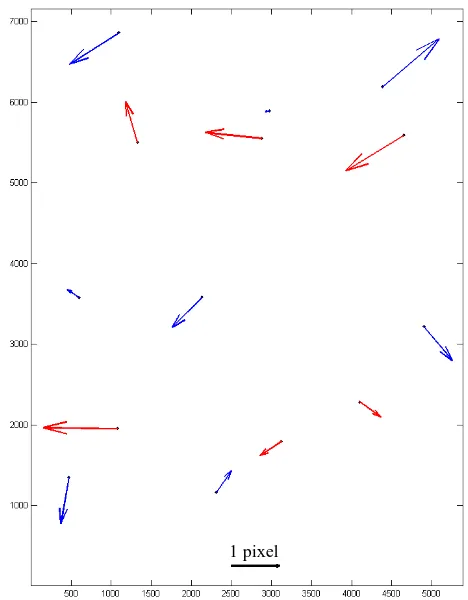
As indicated in Table 2, the EOPs of the aerial image were estimated with a 0 value of 0.12 pixel via the intensity-based registration, and the RMSE of checkpoints was 0.63 pixels. This illustrates a high internal accuracy for both the exterior orientation and the template matching. In contrast, a 0 value of 0.82 pixel was achieved for the feature-based method, with the associated checkpoint RMSE being 1.08 pixels. The superior accuracy and performance of the intensity-based method for registration of imagery to LiDAR data is thus clearly demonstrated. The distribution of error vectors for control and checkpoints is shown for the feature- and intensity-based (centre of templates) solutions in Figures 6 and 7, respectively.
Figure 6. Error vectors for control points (blue) and checkpoints (red) from the feature-based method
Figure 7. Error vectors for control points (blue) and checkpoints (red) from the intensity-based method
1 pixel 1 pixel
It can be seen from Figures 6 and 7 that the errors of checkpoints and control points from the featured-based registration are larger than for the intensity-based method, and their distribution, is both irregular and subject in this case to the availability of buildings. In contrast, the errors for the intensity-based registration are more evenly distributed because the position of the templates does not rely on the availability of man-made features. This further validates the better quality of the intensity-based registration approach.
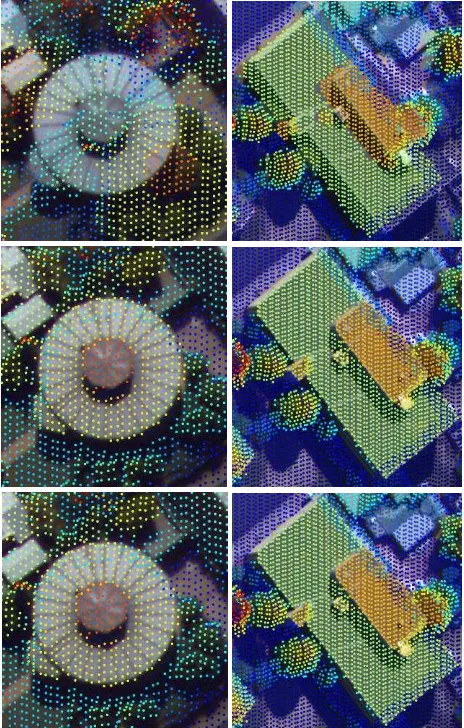
The performance of the two registration methods can be demonstrated by overlaying back-projected LiDAR points onto the image. An example is given in Figure 8, where the overlay of two portions of the dataset near the aerial image border are shown before and after registration via both the feature- and intensity-based methods.
Figure 8. Overlay of back-projected LiDAR point cloud on to the aerial image before (top) and after registration using the
feature-based method (middle) and intensity-based method (bottom)
The results of registering the optical image to LiDAR data, shown in Figure 8, indicate a precise match between corresponding features. Although both registration methods provided good results, the intensity-based method achieved a more accurate registration due to both the use of well-distributed templates and the sub-pixel accuracy achieved in the template matching process.
4. CONCLUSSIONS
The performance of the proposed method for determining optimal parameter values for MI-based registration of optical imagery with LiDAR data has been highlighted. Based on comprehensive testing, it has been observed that improper histogram bin-sizes can yield a maximum value for the similarity measure, but incorrect transformation parameters in the intensity-based registration. However, with the proposed method for determining the optimum bin-size for the PDF, the effect on geometric transformation for various bin-sizes can be assessed, which can enhance registration performance. The proposed approach introduced a new concept for determining optimum parameters for PDF estimation. The approach leads to an increased robustness of intensity-based registration via the maximum use of information that is sensitive to geometric transformation of the datasets. Moreover, superior performance in intensity-based registration was achieved, as compared to feature-based registration of aerial imagery to LiDAR data. Since the proposed method is not sensor dependent, it can be applied to improve the robustness of intensity-based registration of multi-sensor remote sensing data for a wide range of applications.
ACKNOWLEDGEMENTS
The Authors would like to thank the Department of Land and Property Information of New South Wales (www.lpi.nsw.gov.au) for providing the LiDAR and imagery data.
REFERENCES
Bishop, C.M., 1995. Neural Networks for Pattern Recognition. Oxford University Press.
Choi, K., Hong, K., Lee, I., 2011. Precise geometric registration of aerial imagery and LIDAR data. ETRI J. 33(4), 506–516.
Collignon, A., Maes, F., Vandermeulen, D., Suetens, P., Marchal., G., 1995. Automated multi-modality image registration based on information theory. Int. Conf. Inf. Process. Med. Imaging Comput. Imaging Vis. 3 263–274.
Dowson, N., Bowden, R., 2006. A unifying framework for mutual information methods for use in non-linear optimisation. Comput. Vision–ECCV 2006 365–378.
Dowson, N., Kadir, T., Bowden, R., 2008. Estimating the joint statistics of images using nonparametric windows with application to registration using mutual information. IEEE Trans. Pattern Anal. Mach. Intell. 30, 1841–57.
Fischler, M.A., Bolles, R.C., 1981. Random sample consensus: a paradigm for model fitting with applications to image analysis and automated cartography. Commun. ACM 24, 381–395.
Freedman, D., Diaconis, P., 1981. On the histogram as a density estimator: L 2 theory. Probab. theory Relat. fields 57, 453–476.
Habib, A., Ghanma, M., Mitishita, E., 2005. Photogrammetric Georeferencing Using LIDAR Linear and Aerial Features. Korean J. Geomatics 5, 7–19.
Hahn, D. a, Daum, V., Hornegger, J., 2010. Automatic parameter selection for multimodal image registration. IEEE Trans. Med. Imaging 29, 1140–55.
Knops, Z.F., Maintz, J.B., Viergever, M., Pluim, J.P.W., 2006. Normalized mutual information based registration using k-means clustering and shading correction. Med. Image Anal. 10, 432–9.
Knuth, K.H., 2006. Optimal data-based binning for histograms. ArXiv Phys. e-prints.
Legg, P.A., Rosin, P.L., Marshall, D., Morgan, J.E., 2009. Non-rigid Elastic Registration of Retinal Images using Local Window Mutual Information. Computer (Long. Beach. Calif). 144–148.
Liu, Y., Chrisochoides, N., 2006. Using K-means Clustering and MI for Non-rigid Registration of MRI and CT. Med. Image Anal. 10, 432–439.
Lo, C., 2003. Medical Image Registration by Maximization of Mutual Information. PhD Thesis, Kent State University.
Maes, F., Collignon, A., Vandermeulen, D., Marchal, G., Suetens, P., 1997. Multimodality image registration by maximization of mutual information. IEEE Trans. Med. Imaging, 16, 187–198.
Mastin, A., Kepner, J., Fisher, J., 2009. Automatic registration of LIDAR and optical images of urban scenes, in: IEEE Conference on Computer Vision and Pattern Recognition (CVPR). pp. 2639–2646.
Mattes, D., Haynor, D.R., Vesselle, H., Lewellen, T.K., Eubank, W., 2003. PET-CT image registration in the chest using free-form defree-formations. IEEE Trans. Med. Imaging 22, 120–8.
McGill, W., 1954. Multivariate information transmission. IRE Prof. Gr. Inf. Theory 4, 93–111.
Parmehr, E.G., Fraser, C.S., Zhang, C., Leach, J., 2012. Automatic Registration of Aerial Images with 3D LiDAR Data Using a Hybrid Intensity-Based Method. 2012 Int. Conf. Digit. Image Comput. Tech. Appl. 1–7.
Parmehr, E.G., Fraser, C.S., Zhang, C., Leach, J., 2013. An effective histogram binning for mutual information based registration of optical imagery and 3D LiDAR data, in: Proc. IEEE International Conference on Image Processing (ICIP), Melbourne, Australia. pp. 1286–1290.
Parmehr, E.G., Fraser, C.S., Zhang, C., Leach, J., 2014. Automatic registration of optical imagery with 3D LiDAR data using statistical similarity. ISPRS J. Photogramm. Remote Sens. 88, 28–40.
Peter, A., Rangarajan, A., 2008. Maximum likelihood wavelet density estimation with applications to image and shape matching. Image Process. IEEE Trans. 17, 458–468.
Pluim, J.P.W., Maintz, J.B.A., Viergever, M.A., 2003. Mutual-information-based registration of medical images: a survey. IEEE Trans. Med. Imaging 22, 986–1004.
Press, W.H., Teukolsky, S.A., Vetterling, W.T., Flannery, B.P., 1992. Numerical Recipes in C: The Art of Scientific Computing. Cambridge University Press, New York.
Roche, A., Pennec, X., Rudolph, M., Auer, D., Malandain, G., Ourselin, S., Auer, L., Ayache, N., 2000. Generalized correlation ratio for rigid registration of 3D ultrasound with MR images, in: Medical Image Computing and Computer-Assisted Intervention--MICCAI 2000. pp. 203–220.
Sampath, A., Shan, J., 2010. Segmentation and Reconstruction of Polyhedral Building Roofs From Aerial Lidar Point Clouds. IEEE Trans. Geosci. Remote Sens. 48, 1554–1567.
Scott, D.W., 1979. On optimal and data-based histograms. Biometrika 66, 605–610.
Shannon, C.E., 1948. A mathematical theory of communication. Bell Syst. Tech. J. 27, 379–423/623–656.
Silverman, B.W., 1986. Density estimation for statistics and data analysis. CRC press, London.
Studholme, C., Hill, D.L.G., Hawkes, D.J., 1999. An overlap invariant entropy measure of 3D medical image alignment. Pattern Recognit. 32, 71–86.
Suri, S., Reinartz, P., 2010. Mutual-information-based registration of TerraSAR-X and Ikonos imagery in urban areas. IEEE Trans. Geosci. Remote Sens. 48, 939–949.
Thévenaz, P., Unser, M., 2000. Optimization of mutual information for multiresolution image registration. IEEE Trans. Image Process. 9, 2083–99.
Viola, P., Wells, W.M., 1997. Alignment by maximization of mutual information. Int. J. Comput. Vis. 24, 137–154.
Wang, R., Ferrie, F.P., Macfarlane, J., 2012. Automatic registration of mobile LiDAR and spherical panoramas, in: IEEE Computer Society Conference on Computer Vision and Pattern Recognition Workshops. Ieee, pp. 33–40.
Watanabe, S., 1960. Information theoretical analysis of multivariate correlation. IBM J. Res. Dev. 4, 66–82.