FOREST INVENTORY ATTRIBUTE ESTIMATION USING AIRBORNE LASER
SCANNING, AERIAL STEREO IMAGERY, RADARGRAMMETRY AND
INTERFEROMETRY–FINNISH EXPERIENCES OF THE 3D TECHNIQUES
M. Holopainen a,b*, M. Vastaranta a,b, M. Karjalainen c, K. Karila c, S. Kaasalainen c, E. Honkavaara c, J. Hyyppä b,c
a
Dept. Forest Sciences, University of Helsinki, P.O.Box 27, 00014 University of Helsinki, Finland - (mikko.vastaranta, markus.holopainen)@helsinki.fi
b
Centre of Excellence in Laser Scanning Research, P.O.Box 15, 02431 Masala, Finland c
Dept. of Photogrammetry and remote sensing, Finnish Geospatial Research Institute, P.O.Box 15, 02431 Masala, Finland -(mika.karjalainen, kirsi.karila, sanna.kaasalainen, juha.hyyppa)@nls.fi
Commission VI, WG I/2
KEY WORDS: Remote sensing, airborne laser scanning, aerial stereo imagery, SAR radargrammetry, SAR interferometry, random forest, sample plot, area-based approach, forest inventory, forest management planning, GIS
ABSTRACT:
Three-dimensional (3D) remote sensing has enabled detailed mapping of terrain and vegetation heights. Consequently, forest inventory attributes are estimated more and more using point clouds and normalized surface models. In practical applications, mainly airborne laser scanning (ALS) has been used in forest resource mapping. The current status is that ALS-based forest inventories are widespread, and the popularity of ALS has also raised interest toward alternative 3D techniques, including airborne and spaceborne techniques. Point clouds can be generated using photogrammetry, radargrammetry and interferometry. Airborne stereo imagery can be used in deriving photogrammetric point clouds, as very-high-resolution synthetic aperture radar (SAR) data are used in radargrammetry and interferometry. ALS is capable of mapping both the terrain and tree heights in mixed forest conditions, which is an advantage over aerial images or SAR data. However, in many jurisdictions, a detailed ALS-based digital terrain model is already available, and that enables linking photogrammetric or SAR-derived heights to heights above the ground. In other words, in forest conditions, the height of single trees, height of the canopy and/or density of the canopy can be measured and used in estimation of forest inventory attributes. In this paper, first we review experiences of the use of digital stereo imagery and spaceborne SAR in estimation of forest inventory attributes in Finland, and we compare techniques to ALS. In addition, we aim to present new implications based on our experiences.
1. INTRODUCTION
The retrieval of forest inventory attributes, which are needed in forest management planning, is carried out using airborne laser scanning (ALS)-based inventory methodologies in the Nordic countries. ALS-aided forest inventory methodologies were taken into practice shortly after demonstrative studies (e.g., Nilsson 1996, Næsset 1997a, b, 2002, Hyyppä and Inkinen 1999, Hyyppä and Hyyppä 1999). In operational mapping of forest inventory attributes, a two-stage procedure using ALS data and field-measured sample plots, i.e., an area-based approach (ABA, Næsset 2002), has become common and a reference against which other inventory methodologies are compared (White et al. 2013). The ABA can provide precise predictions for many required forest inventory attributes, including stem volume and height. ABA is sampling based, and it is possible to calculate accuracy statistics. In addition, forest attributes are predicted for a grid (e.g., 16x16 or 20x20 m), and thus, ALS-based inventory does not depend on stand boundaries.
ALS is a method based on light detection and ranging (LiDAR) measurements from an aircraft, where the precise position and orientation of the sensor is known, and therefore the position
(x, y, z) of the reflecting objects can be determined. Due to rapid adaptation to operational forest inventory, ALS has been the primary data source for three-dimensional (3D) information on forest vertical structure. However, there is an increasing interest in the use of high-spatial-resolution digital aerial imagery (digital stereo imagery, DSI) or radar imagery to generate 3D information analogous to ALS data to support forest inventory and monitoring (Wulder et al. 2013, White et al. 2013, Vastaranta et al. 2013, Holopainen et al. 2014). This interest in alternative technologies for acquiring accurate height information can be attributed to the need to control cost and improve temporal resolution at the same time. At the moment, imagery is about one-half to one-third of the cost of ALS data. High resolution radar data is still as expensive as ALS, but there is a drift toward a free-of-charge data policy. The strength of SAR is the temporal resolution. In theory, SAR data can be obtained on nearly a daily basis. In addition, alternative and complementary data sources are searched because certain forest inventory attributes remain difficult to obtain with ALS, such as tree species composition.
returns are mainly assumed to come from the top of the canopy and the last returns mainly from the ground. However, in many jurisdictions, detailed ALS-based digital terrain models/digital elevation models (DTM/DEM) are already available, and that enables also linking photogrammetric or SAR-derived heights to heights above the ground. In other words, in the mapping of forest inventory attributes, detailed DTM is a prerequisite if alternative techniques are used.
This paper summarizes the first results from the use of digital stereo imagery and spaceborne SAR in forest inventory attribute mapping in Finland on areas where detailed ALS-based DTM is available. Alternative 3D techniques are also compared to ALS in regard to data acquisition, processing, point cloud/DSM quality and in obtained estimation accuracies. In addition, we aim to present new insights based on our experiences. We begin with a short overview of the alternative 3D techniques (Section 2). Specific study areas and methods are then presented in Section 3. In Section 4, we compare and discuss data acquisition and processing, point cloud/DSM quality and obtained prediction accuracies in estimation of forest inventory attributes, followed by a conclusion in Section 5.
2. ALTERNATIVE 3D TECHNIQUES
2.1 Aerial imagery
The creation of image-derived digital surface models requires high-resolution aerial images with stereo coverage (Hirschmugl 2008, Leberl et al. 2010). When an object is imaged from two different perspectives, stereophotogrammetry enables the measurement of its three-dimensional position relative to a reference datum (e.g., sea level). The use of digital aerial cameras has enabled a substantial increase in the number of overlapping images that are acquired for ongoing forest inventory or monitoring programs. In forested regions, the availability of many overlapping images provides the multi-image information required to produce a DSM and reduces the impact of occlusions (i.e., shadows), which occur more frequently when there is less image overlap (Haala et al. 2010). The film-to-digital transition has resulted in improvements to the radiometric properties of the images, while advances in computing technology have made complex algorithms for image matching practical (Leberl et al. 2010). These technological advances have greatly enhanced the quality of DSMs derived from stereophotogrammetric processing, improving the characterization of detailed structures. The digital image resolution is defined by the ground sampling distance (GSD), which depends on various factors, most importantly the flying height and the specifications of the camera (instrument) used. Flying heights between 550 m and 4800 m have been used with 60–90% forward overlap and 30–60% side overlap for forestry applications, resulting in GSDs ranging from 0.05 m to 0.5 m (e.g., Hirschmugl 2008, Bohlin et al. 2012, Järnstedt et al. 2012, Nurminen et al. 2013).
2.2 Spaceborne SAR
Synthetic aperture radar (SAR) is active imaging radar operating in the microwave region of the electromagnetic
spectrum. Spaceborne SAR systems are typically pulse-based radars, i.e., a pulse of microwave radiation is transmitted, and echoes coming back from the target area are received. As the satellite moves in its orbit, a two-dimensional image-like representation can be processed from the received echoes.
With current SAR systems, images with resolutions of about 1 m can be obtained from satellites orbiting at altitudes of several hundred kilometers. A major advantage of radar images, compared with optical region satellite images, has been their availability (temporal resolution) under varying imaging conditions.
Radargrammetry and interferometry are basic techniques used to derive 3D information from radar imagery. Radargrammetry is based on the stereoscopic measurement of SAR images in which, analogously to photogrammetric forward intersection, two or more radar images with different viewing perspectives are used to extract 3D information from the target area. The geometrical baselines of stereo pairs are typically in the order of hundreds of kilometers. Although radargrammetry has been a well-known technique for many decades, it has gained new recognition due to the new SAR satellites with enhanced spatial resolution and very high geolocation accuracy (Peerko et al. 2010, Raggam et al., 2010).
SAR interferometry is based on the phase differences between two complex SAR images acquired from slightly different view angles. Geometrical baselines are typically in the order of a few tens or hundreds of meters. Phase differences are then converted to height differences in the target area. By using a short radar wavelength such as the X band radiation, backscattering from the canopy is obtained in forested areas, and the canopy height can be estimated when ground surface elevations are known. It should be noted that due to signal penetration in the target, there is underestimation of the actual height (Praks et al. 2012).
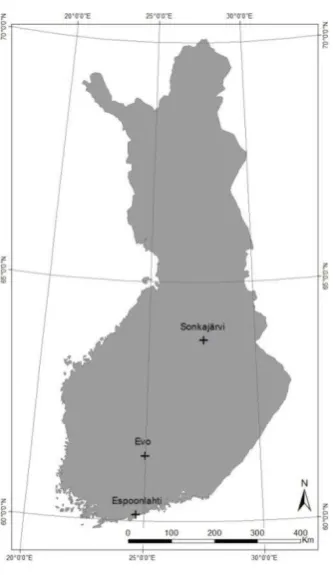
Figure 1. Locations of the study sites.
Karjalainen et al. (2011), Vastaranta et al. (2013a) and Vastaranta et al. (2014) have used study area locating in Espoonlahti, which has relative flat topography, mixed land uses and varying forest structures. The study area in Järnstedt et al. (2012), Vastaranta et al. (2013b) and Karila et al. (2015) has been Evo, which is dominated by managed conifer-dominated forests. The study area in Sonkajärvi used by Nurminen et al. (2013) is dominated by managed pine forests.
ABA has been used for forest attribute estimation. The number of the used modeling plots has varied from 89 to 500, as the attribute estimation has been validated mainly at resolutions between 200 and 300 m2, corresponding to the field measured plots. Vastaranta et al. (2014) was the only study where results were validated at the stand level, as varying plot sizes were used in Nurminen et al. (2013).
In all of the studies, nonparametric estimation methods were used (Table 1). Random forest (RF) estimation was the most-used technique, and consequently, the results were also validated using RF’s built-in cross-validation technique based on out-of-the-bag samples. Although most of the studies were independent, rather uniform methods have been used, which enables comparison of the used remote sensing data sets for forest attribute estimation.
2013a Espoonlahti 110 200 m
2 RF, Out-of-the-bag Vastaranta et al.
2013b Evo 500 300 m
2 RF, Out-of-the-bag Nurminen et al.
2013 Sonkajärvi 89 100–1257 m
2 RF,
Out-of-2013 Sonkajärvi 89 100–1257 m
2 RF, Out-of-the-bag Vastaranta et al.
2013b Evo 500 300 m
2 RF, Out-of-the-bag Radargrammetry
Karjalainen et
al. 2011 Espoonlahti 110 200 m
2 RF, Out-of-the-bag Vastaranta et al.
2013a Espoonlahti 110 200 m
2
Table 1. Methods used in the estimation of forest inventory attributes.
4. COMPARISONS OF ALS AND ALTERNATIVE 3D TECHNIQUES
4.1 Data acquisition and processing
Image platforms are able to fly higher and faster than ALS platforms. Imaging instruments will typically have a field of view (FOV) of 75°; ALS FOVs (for forest applications) are
≤25°. Thus, for the same number of flying hours, image acquisition can cover a much larger area.
However, ALS systems have more flying hours per day, as they are insensitive to lightning conditions. Aerial imagery is strongly influenced by solar illumination and view angles (sun, surface and sensor geometry). Occlusions caused by shadows are particularly problematic for the generation of image-based point clouds in forest canopies.
Nowadays, SAR data are available internationally from a large number of satellites with different frequency bands, polarizations and variable imaging geometries (see reviews in, e.g., LeToan et al. 1992, Ouchi 2013, Kaasalainen et al. 2015). Thus, in theory, the strength of SAR compared to aerial imagery or ALS is the easy data acquisition and also the temporal resolution. SAR data can be obtained on nearly a daily basis and also under varying imaging conditions. User-ready products, such as DSMs or point clouds, can be easily processed with methods similar to those that are used with aerial imagery.
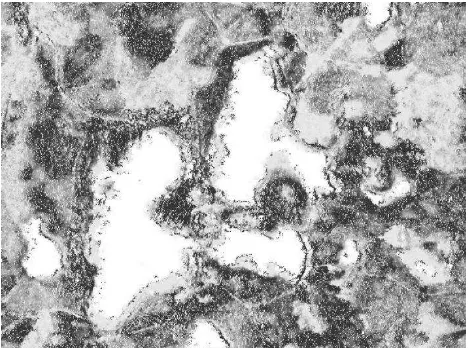
4.2 Point cloud or DSM quality
Compared to ALS and digital stereo imagery (DSI), the obtained point densities are far sparser. DSMs with resolutions ranging from 25 m2 to 100 m2 are usually derived using radargrammetry or interferometry (Figures 2 and 3). Even higher resolution is possible using the latest satellite data. DSMs based on ALS or digital stereo imagery are more detailed; resolutions vary between 0.25 m2 to 1 m2(Figures 4 and 5). Another difference is that canopy heights can be measured accurately straight from the ALS or image point cloud or DSM, as due to radar signal penetration in the target, there is underestimation of the actual height (Praks et al. 2012).
Additional information compared to DSM can be obtained from aerial imagery or ALS point clouds. With regard to resolution, the image-based point cloud is capable of a greater point density than ALS data, for a given cost, as a function of the GSD and the number of independent three-dimensional pixel matches (Leberl et al. 2010). However, research into the impact that increasing ALS point density has on the accuracy of forest inventory attribute estimation would suggest that the increased point density afforded by image-based point clouds may not be of any particular advantage for the area-based approach (e.g., Treitz et al. 2012, Jakubowski et al. 2013).
However, the imagery-derived height information primarily characterizes the outer canopy envelope; the detection of small canopy openings is limited. The lack of penetration and insensitivity to small canopy openings limits the variety of metrics that may be generated from the digital stereo imagery when compared to the broad range of metrics that may be calculated from the ALS data (Vastaranta et al. 2013).
Radargrammetry may be capable of capturing slightly more variation in canopy height than interferometry. In the interferometric processing, pixels are averaged, and continuity of phase is favored, but radargrammetry is based on (independent) 3D measurements of tie-points between images, which may lead to an enhanced height variation response when multiple stereo-pairs are available with varying incidence angles and viewing directions.
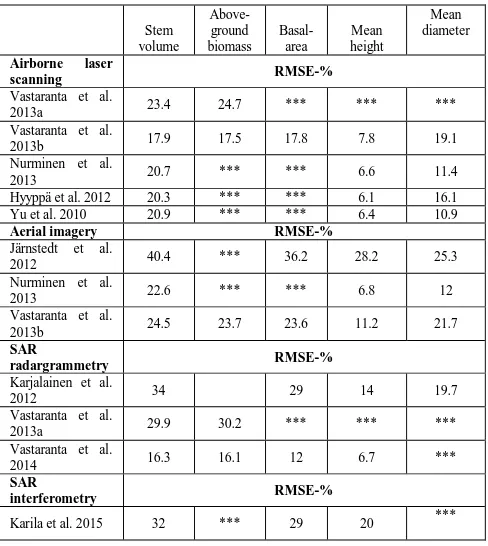
4.3 Forest inventory attribute prediction accuracies
Based on Finnish experiences, 3D metrics derived from aerial stereo imagery can be used in the estimation of forest inventory attributes, and obtained accuracies are close to ALS in boreal forest conditions (Table 2). However, the imagery-derived
height information primarily characterizes the outer canopy envelope; the detection of small canopy openings is limited. The lack of penetration and insensitivity to small canopy openings probably limits the prediction accuracy in multi-layered stands. On the other hand, it should be noted that aerial images also provide spectral information that is useful in tree species classification, and the height information is as accurate as that obtained from ALS. A review of the potential of aerial image-derived point clouds for forestry purposes can be found in White et al. (2013). From 5 to 15 percentage points lower root mean squared errors are obtained using spaceborne radargrammetry and interferometry. Considering the resolution of the radargrammetric or interferometric DSM, the obtained results are surprisingly close to the results obtained with ALS or imagery. Based on the Finnish experiences, radargrammetry has provided slightly more accurate estimation of forest inventory attributes than interferometry, and that is probably due to its capability of capturing height variation, as the DSM generation is based on 3D measurement with multiple imaging geometries instead of averaging over multiple pixels, as in interferometry.
2013b 17.9 17.5 17.8 7.8 19.1
Nurminen et al.
2013b 24.5 23.7 23.6 11.2 21.7
SAR
Figure 2. Canopy height model (1 m resolution) derived from airborne laser scanning data. Black areas indicate high vegetation. Three lakes (white) can be seen in the middle.
Figure 3. Canopy height model (1 m resolution) derived from airborne stereo imagery.
Figure 4. Canopy height model (10 m resolution) derived using interferometry.
Figure 5. Canopy height model (10 m resolution) derived using radargrammetry.
5. CONCLUSIONS
We are able to summarize findings from several studies with similar reference measurements, estimation methods and validation techniques. In addition, most of the studies were implemented in the same study area, enabling fair comparisons.
In general, it would appear that for even-aged, single canopy layer stands, such as those that dominate the study areas, prediction accuracies are surprisingly close to each other, considering the differences in level of detail. ALS data sets used in Vastaranta et al. (2013) included 10 pulses per m2, enabling production of 10–40 points per m2, characterizing ground and vegetation. As in Karila et al. (2015), interferometric DSM had a resolution of 4x4 m, meaning there were only around 20 height observations per plot. This also indicates that the main predicative power comes from 3D, i.e., the inclusion of the tree height information, and it does not matter so much what is the final point density. Therefore, the results are also comparable to Hyyppä and Hyyppä (1999) and Hyyppä et al. (2000).
It should be kept in mind that in all of the studies, a rather large number of plots were used, and the predictions were validated using the same plots, as the models were calibrated. Although one of the advantages of the RF is that it is not overfitting and it can provide validation statistics using built-in cross-validation, the obtained accuracies are probably on the positive side. However, the same methods were used in most of the studies, and thus, comparison between the remote sensing materials and prediction accuracies should be realistic. Still, we assume that if a smaller amount of plots per hectare is used, as is the case in operational accuracies, the accuracy of radar-based predictions will decrease more than ALS or image-radar-based predictions. The reason for this is that ALS and image-based point clouds are capturing the height and density variation in more detail, even enabling direct measurements for vegetation height. Thus, those can provide better physical correspondence with point clouds and the actual attributes of interest.
cost-efficient 3D techniques, forest managers could potentially realize more frequent inventory cycles, providing more up-to-date information. For the purposes of forest mapping and monitoring, it has been suggested in Finland that ALS data could be acquired at regular, but extended, time periods (i.e., every 10 or 20 years, depending on forest and management considerations), with forest information updated periodically using alternative point clouds (Vastaranta et al. 2013, Holopainen et al. 2014) derived from optical satellite, aerial or radar imagery acquired in between regular forest inventory cycles. In theory, these point clouds could be used for area-based estimations in a fashion analogous to ALS data, as also proved here in many studies where forest inventory attributes have been predicted using ALS, imagery or SAR data. It should be pointed out that all of these alternative techniques require ALS-based DTM/DEM to obtain accurate estimates for forest inventory attributes.
We remain circumspect on recommendations regarding the use of alternative 3D techniques in other forest types, particularly in mixed-aged, multi-layered stands, and other management regimes. The relatively homogeneous and well-managed stand conditions found in the study areas result in limited variance and facilitated strong relationships between DSMs and the ground plot measurements.
Looking forward, it certainly appears that there are opportunities especially for DSI in forest management and planning. The capacity of DSI to achieve estimates with accuracies close to ALS needs to be tested in a broader range of forest conditions, particularly in larger, more complex stands (White et al. 2013).
Opportunities for monitoring and inventory update applications are foreseen for jurisdictions where large-area ALS coverages have been acquired, imagery or other 3D data is routinely collected, and numerous well-distributed ground plots are present. We may assume that in most of the cases even SAR could be used for forest attribute updating (time interval T1-T2). Mapping in T1 is done with ALS to obtain DTM and forest attributes, but in T2, SAR-derived DSM could be used. In forest inventory updating, SAR competes with repeated ALS data acquisition, digital aerial stereo imagery derived DSM and DSMs derived from optical satellite images. All these methods can provide prediction accuracies close to ALS and improvements to the current large-area mapping methods (e.g., methods where field plot data is generalized over large areas using Landsat imagery).
SAR-based DSMs are less detailed than ALS DSMs, but they could be more cost effective when large areas need to be covered. The advantage of SAR DSMs over those from optical imagery is in their availability regardless of weather and time of day. In addition to forest attribute updates, there is growing interest toward natural hazard monitoring systems. Due to good temporal resolution, SAR techniques have an operational potential to monitor forest changes such as wind or snow damages. However, for monitoring of non-stand replacing disturbances, such as snow damage and other individual tree-level changes, further research is needed with SAR.
From the user’s point of view, which one of the mentioned 3D remote sensing methods is selected to be used in forest inventory attribute updates depends on data availability,
acquisition and preprocessing costs. User-ready products, such as DSMs or point clouds, can be easily processed with available software (imagery and SAR) and used for area-based estimation of forest inventory attributes.
ACKNOWLEDGEMENTS
The Academy of Finland is acknowledged for its financial support in the form of the projects “Science and Technology Towards Precision Forestry” and “Centre of Excellence in Laser Scanning Research (CoE-LaSR).” EU is acknowledged for its financial support in the form of the ESA Advanced SAR project.
REFERENCES
Bohlin, J., Wallermandan, J. and Fransson, J.E.S. 2012. Forest variable estimation using photogrammetric matching of digital aerial images in combination with a high-resolution DEM. Scand. J. For. Res. 2012, 27, 692–699, doi:10.1080/02827581.2012.686625.
Haala, N., Hastedt, H., Wolf, K., Ressl, C. and Baltrusch, S. 2010. Digital photogrammetric camera evaluation—Generation of digital elevation models. Photogramm Fernerkun. 2010, 2, 99–115.
Hirshmüller, H. 2008. Stereo processing by semi-global matching and mutual information. IEEE Trans. Pattern Anal. Mach. Intell. 2008, 30, 328–341, doi:10.1109/TPAMI.2007.1166.
Holopainen, M, Vastaranta, M and Hyyppä, J. 2014. Outlook for the Next Generation’s Precision Forestry in Finland. Forests. 2014; 5(7):1682-1694.
Honkavaara, E., Litkey, P. and Nurminen, K. 2013. Automatic Storm Damage Detection in Forests Using High‑ Altitude Photogrammetric Imagery. Remote Sensing, Vol. 5, pp. 1405– 1424.
Hudak, A., Crookston, N., Evans, J., Hall, D. and Falkowski, M. 2008. Nearest neighbor imputation of species-level, plot-scale forest structure attributes from LiDAR data. Remote Sensing of Environment, Vol. 112, No. 5, pp. 2232–2245.
Hyyppä H. and Hyyppä, J. 1999. Comparing the accuracy of laser scanner with other optical remote sensing data sources for stand attribute retrieval. The Photogrammetric Journal of Finland 16(2): 5–15.
Hyyppä, J., Hyyppä, H., Inkinen, M., Engdahl, M., Linko, S., and Zhu, Y.-H. 2000. Accuracy comparison of various remote sensing data sources in the retrieval of forest stand attributes. Forest Ecology and Management 128(1):109-120.
Jakubowski, M.K., Guo, Q. and Kelly, M. 2013. Tradeoffs between lidar pulse density and forest measurement accuracy. Remote Sens. Environ. 2013, 130, 245–253, doi:10.1016/j.rse.2012.11.024.
Järnstedt, J., Pekkarinen, A., Tuominen, S., Ginzler, C., Holopainen, M. and Viitala, R. 2012. Forest variable estimation using a high-resolution digital surface model. ISPRS Journal of Photogrammetry and Remote Sensing, 74, pp. 78– 84.
Kaasalainen, S., Holopainen, M., Karjalainen, M., Vastaranta, M., Kankare, V., Karila, K. and Osmanoglu, B. 2015. Combining Lidar and synthetic aperture radar to estimate forest biomass: status and prospects. Forests 2015, 6:252-270; doi:10.3390/f6010252.
Karila, K., Vastaranta, M., Karjalainen, M. and Kaasalainen, S. 2015. Tandem-X interferometry in the prediction of forest inventory attributes in managed boreal forests. Remote Sensing of Environment, in press.
Karjalainen, M., Kankare, V., Vastaranta, M., Holopainen, M. and Hyyppä, J. 2012. Prediction of plot-level forest variables using TerraSAR-X stereo SAR data. Remote Sensing of Environment, 117, 338–347.
Le Toan, T., Beaudoin, A., Riom, J. and Guyon, D. 1992. Relating forest biomass to SAR data. IEEE Transactions on Geoscience and Remote Sensing 1992, 30, 403–411.
Leberl, F., Irschara, A., Pock, T., Meixner, P., Gruber, M., Scholz, S. and Wiechert, A. 2010. Point clouds: LiDAR versus three-dimensional vision. Photogramm. Eng. Remote Sens. 2010, 76, 1123–1134.
Næsset, E., 1997a. Determination of mean tree height of forest stands using airborne laser scanner data. ISPRS Journal of Photogrammetry and Remote Sensing 52: 49–56.
Næsset, E., 1997b. Estimating timber volume of forest stands using airborne laser scanner data. Remote Sensing of Environment 61(2): 246–253.
Næsset, E., 2002. Predicting forest stand characteristics with airborne scanning laser using a practical two-stage procedure and field data. Remote Sensing of Environment 80: 88–99.
Nilsson, M. 1996. Estimation of tree heights and stand volume using airborne lidar system. Remote Sensing of Environment 56(1): 1–7.
Nurminen, K., Karjalainen, M., Yu, X., Hyyppä, J. and Honkavaara, E. 2013. Preformance of dense digital surface models based on image matching in the estimation of plot-level forest variables. ISPRS Journal of Photogrammetry and Remote Sensing, Vol 83, pp. 104–115.
Ouchi, K. 2013. Recent Trend and Advance of Synthetic Aperture Radar with Selected Topics. Remote Sensing 2013, 5, 716–807.
Praks, J., Antropov, O. and Hallikainen, M. 2012. LIDAR-Aided SAR Interferometry Studies in Boreal Forest: Scattering Phase Center and Extinction Coefficient at X- and L-Band.
IEEE Transactions on Geoscience and Remote Sensing 2012, 50, 3831–3843.
Raggam, H., Gutjahr, K., Perko, R. and Schardt, M. 2010. Assessment of the Stereo-Radargrammetric Mapping Potential of TerraSAR-X Multibeam Spotlight Data. IEEE Transactions on Geoscience and Remote Sensing 2010, 48, 971–977.
Treitz, P., Lim, K., Woods, M., Pitt, D., Nesbitt, D. and Etheridge, D. 2012. LiDAR sampling density for forest resource inventories in Ontario, Canada. Remote Sens. 2012, 4, 830–848, doi:10.3390/rs4040830.
Vastaranta, M., Wulder, M. A., White, J., Pekkarinen, A., Tuominen, S., Ginzler, C., Kankare, V., Holopainen, M., Hyyppä, J. and Hyyppä, H. 2013. Airborne laser scanning and digital stereo imagery measures of forest structure: Comparative results and implications to forest mapping and inventory update. Canadian Journal of Remote Sensing Vol. 39, No. 5, pp 382 -395.
Vastaranta, M., Niemi, M., Karjalainen, M., Peuhkurinen, J., Kankare, V., Hyyppä, J. and Holopainen, M. 2014. Prediction of Forest Stand Attributes Using TerraSAR-X Stereo Imagery. Remote Sensing Vol. 6, No. 4, pp. 3227-3246.
Vastaranta, M., Holopainen, M., Karjalainen, M., Kankare, V., Hyyppä, J. and Kaasalainen, S. 2014. TerraSAR-X stereo radargrammetry and airborne scanning LiDAR height metrics in imputation of forest aboveground biomass and stem volume. IEEE Transactions on Geoscience and Remote Sensing, Vol. 52, No. 2, pp. 1197-1204, doi:10.1109/TGRS.2013.2248370
White, J.C., Wulder, M.A., Varhola, A., Vastaranta, M., Coops, N.C., Cook, B.D., Pitt, D. and Woods, M. 2013. A best practices guide for generating forest inventory attributes from airborne laser scanning data using the area-based approach. Information Report FI-X-10. Natural Resources Canada, Canadian Forest Service, Canadian Wood Fibre Centre, Pacific Forestry Centre, Victoria, BC. 50 p.
White, J.C., Wulder, M.A., Vastaranta, M., Coops, N.C., Pitt, D. and Woods, M. 2013. The utility of image-based point clouds for forest inventory: A comparison with airborne laser scanning. Forests, Vol., 4, pp. 518–536.
Wulder, M.A., Coops, N.C., Hudak, A.T., Morsdorf, F., Nelson, R., Newnham, G. and Vastaranta, M. 2013. Status and prospects for LiDAR remote sensing of forested ecosystems. Canadian Journal of Remote Sensing, Vol. 39, doi: 10.5589/m13-051.