www.elsevier.nlrlocateraqua-online
Dietary manipulations affecting growth and
nitrogenous waste production of red drum,
Sciaenops ocellatus
II. Effects of energy level and nutrient density at
various feeding rates
Bruce B. McGoogan
1, Delbert M. Gatlin III
)Department of Wildlife and Fisheries Sciences and Faculty of Nutrition, Texas A&M UniÕersity System,
College Station, TX 77843-2258, USA
Accepted 7 July 1999
Abstract
Two experiments were conducted with red drum in recirculating, 110-l aquaria to examine the effects of increasing dietary energy levels, and altering dietary energy and protein levels in conjunction with feeding rates on weight gain, body composition and ammonia production. In the
Ž .
first experiment, juvenile red drum initially;35 g were fed diets containing 45% crude protein and 15.1 to 18.4 kJ estimated digestible energyrg for 6 weeks. In the second experiment, smaller Žinitially ;3.5 g red drum were fed diets with digestible protein and digestible energy levels. ŽDPrkJ of 33. r13, 40r15.5 and 50r18 at rates of 6, 5 and 4% of body weight BWŽ .rday, respectively, for 8 weeks. The 40r15.5 diet also was provided to apparent satiation. Each treatment was fed in triplicate and fish were weighed weekly to adjust feeding rates. Results from
Ž .
the first experiment indicated there were no significant P-0.05 differences in weight gain or feed efficiency of red drum fed the various energy levels. However, intraperitoneal fat deposition increased with an increase in dietary energy above 15.1 kJrg, but no trends were evident in other body indices or tissue composition. Ammonia production, measured at 2-h intervals postprandial, was significantly reduced at 6-h post-feeding in fish fed the highest energy level. Plasma glucose and activities of enzymes involved in ammonia metabolism were unaffected by dietary energy levels. In the second experiment, weight gain did not differ significantly between fish fed diets containing 40 or 50% DP, but was lower for fish fed the diet containing 33% DP. Fish fed the diet
)Corresponding author. Tel.:q1-409-847-9333; fax:q1-409-845-4096; E-mail: [email protected]
1
Current address: Cargill, Animal Nutrition Division, P.O. Box 5614, Minneapolis, MN 55440-5614, USA. 0044-8486r00r$ - see front matterq2000 Elsevier Science B.V. All rights reserved.
Ž .
( )
B.B. McGoogan, D.M. Gatlin IIIrAquaculture 182 2000 271–285
272
with least protein also had the lowest feed and protein efficiencies. While satiation feeding resulted in similar weight gain as feeding at a fixed rate, the efficiency of feed and protein utilization was improved with satiation feeding. There were no clear trends in body indices or ammonia production of fish subjected to the various regimes. In conclusion, higher dietary energy levels did not improve growth, but did lower nitrogenous waste production of red drum. Increasing dietary protein in conjunction with increasing energy levels also improved growth and efficiency of feed utilization.q2000 Elsevier Science B.V. All rights reserved.
Keywords: Ammonia; Diet; Energy; Protein; Red drum; Sciaenops ocellatus
1. Introduction
In the past, formulation of diets in intensive aquaculture has often been aimed at meeting requirements for maximum growth, while more recently, formulations are being designed to meet other desired production goals. One such goal is to increase the sustainability of various aquacultural enterprises by reducing the environmental impacts they may have on surrounding ecosystems. Aquaculture wastes are largely dietary in
Ž .
origin with estimates of 52–95% of feed nitrogen ending up as waste Wu, 1995 . Therefore, diet manipulations which result in less waste production are an attractive approach to this predicament. One particular aspect of deleterious waste production now being addressed is formulation of diets to minimize ammonia production by cultured species.
While high dietary protein levels are known to result in rapid growth rates for many species of fish, inclusion of levels beyond those needed for growth frequently result in
Ž .
high levels of ammonia production Campbell, 1991 . Reduction of ammonia production is understandably desirable as it represents a loss of costly amino acid nitrogen from protein synthesis and is a source of detrimental water quality at even moderately high levels. One practice that has been employed in aquaculture to limit ammonia production is restricted feeding which, in turn, generally limits growth of the species being cultured. Therefore, dietary manipulations which would reduce ammonia production but sustain rapid growth of the fish are particularly appealing.
High dietary energy has been found to have a protein-sparing effect, resulting in lower ammonia production, in several fish species. These higher energy levels generally come in the form of increased dietary lipid as lipid is an energy-dense nutrient and readily metabolized by fish. This protein-sparing effect and reduced ammonia produc-tion have been reported in several fish species fed high-energy diets containing lipid as a
Ž
major energy source Johnsen et al., 1991; Jayaram and Beamish, 1992; Vergara et al., .
1996 .
Ž .
As some fish have been demonstrated to eat to meet an energy need NRC, 1993 , it is important to consider that with feeding of high-energy diets, consumption may be reduced, which may contribute to a decrease in ammonia production. If feed intake is severely restricted, protein intake may be too low to support rapid growth rates. Therefore, increasing the percentage of dietary protein in conjunction with an increase in energy may help to provide amino acids at levels needed for maximal growth even if
Ž . Ž .
most beneficial approach to increasing nutrient density of diets generally involves excluding ingredients with low protein and energy contents which are often poorly digested. This strategy was evaluated with red drum and observed to have positive
Ž .
effects on water quality of a closed recirculating system Jirsa et al., 1997 .
A previous experiment in our laboratory demonstrated that high dietary energy levels resulted in lower ammonia production by red drum but compromised weight gain and
Ž .
body composition McGoogan and Gatlin, 1999 . Additionally, high dietary energy seemed to have a more beneficial effect at a reduced feeding rate, resulting in favorable growth rates and reduced nitrogenous waste production. Increasing dietary crude protein ŽCP provided greater weight gain but with higher ammonia excretion. Taking these. findings into consideration, the present study was conducted using the protein level Ž45% CP previously determined to support most rapid weight gain and graded energy. levels to determine if an energy level could be ascertained which would provide a reduction in ammonia production without adversely affecting weight gain or body composition. Because higher dietary energy levels may result in reduced intake, a second experiment was conducted to determine the effects of increasing dietary protein levels in conjunction with energy while reducing feeding rates to allow adequate dietary protein and energy intake. Although protein and energy are known to have profound effects on growth and body composition of fish, much less is known about the effects of these manipulations on plasma metabolites and enzyme activities associated with ammonia production, and therefore, these aspects were also studied.
2. Materials and methods
2.1. Dietary treatments
Diets used in the first experiment contained 45% CP and graded levels of energy Ž
ranging from 15.1 to 18.4 kJ estimated digestible energyrg diet Serrano et al., 1992; .
McGoogan and Gatlin, 1998 with alterations in energy accomplished by varying levels
Ž .
of menhaden oil and dextrin Table 1 . In the second experiment, three diets were
Ž . Ž .
formulated Table 1 with increasing levels of digestible protein 33, 40, and 50% and
Ž .
energy 13, 15.5, and 18 kJrg to meet previously determined requirements for
Ž .
maximum growth of red drum McGoogan and Gatlin, 1998 using digestibility
determi-Ž .
nations for low-temperature processed menhaden fish meal Gaylord and Gatlin, 1996 . The diet containing the highest protein and energy levels met the red drum’s require-ment for digestible protein but was low in energy due to limited space in the formulation. These three diets were fed by hand at decreasing fixed rates of 6, 5, or 4%
Ž .
body weight BWrday corresponding to inversely increasing protein and energy levels to provide approximately the same amount of digestible protein and energy each day. These dietrfeed rate treatments were designated 33r13 at 6, 40r15.5 at 5 and 50r18 at 4. An additional treatment in the second experiment consisted of the diet with intermedi-ate protein and energy being fed to apparent satiation over a 30-min period, at both daily
Ž .
feedings 40r15.5 at satiate . Procedures for diet preparation and storage were
previ-Ž .
()
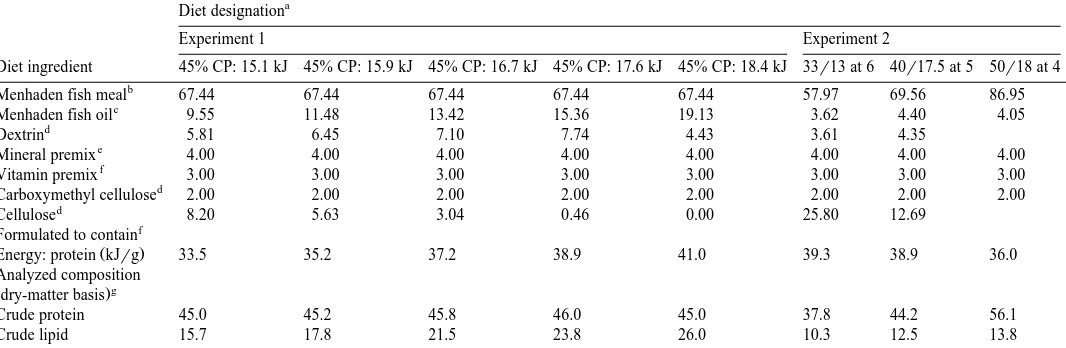
Diet formulations containing various energy levels and different protein and energy levels for red drum in experiments 1 and 2. Values are expressed as gr100 g dry diet
Menhaden fish meal 67.44 67.44 67.44 67.44 67.44 57.97 69.56 86.95
c
Menhaden fish oil 9.55 11.48 13.42 15.36 19.13 3.62 4.40 4.05
d
Dextrin 5.81 6.45 7.10 7.74 4.43 3.61 4.35
e
Mineral premix 4.00 4.00 4.00 4.00 4.00 4.00 4.00 4.00
f
Vitamin premix 3.00 3.00 3.00 3.00 3.00 3.00 3.00 3.00
d
Carboxymethyl cellulose 2.00 2.00 2.00 2.00 2.00 2.00 2.00 2.00
d
Cellulose 8.20 5.63 3.04 0.46 0.00 25.80 12.69
f Formulated to contain
Ž .
Energy: protein kJrg 33.5 35.2 37.2 38.9 41.0 39.3 38.9 36.0
Analyzed composition g
Ždry-matter basis.
Crude protein 45.0 45.2 45.8 46.0 45.0 37.8 44.2 56.1
Crude lipid 15.7 17.8 21.5 23.8 26.0 10.3 12.5 13.8
a Ž . Ž .
In experiment 1, each diet contained 45% crude protein CP and graded levels of estimated digestible energy kJ . In experiment 2, each diet contained different
Ž .
digestible protein and energy levels % DPrkJ to be fed at a specific percent BWrday. b
Omega Protein, Houma, LA, USA. c
Omega Protein, Reedville, VA, USA. d
United States Biochemical, Cleveland, OH, USA.
e Ž .
Same as Moon and Gatlin 1991 .
f Ž .
Diets for experiment 1 were formulated based on CP and estimated digestible energy Serrano et al., 1992 whereas diets for experiment 2 were formulated based on
Ž .
DP and energy Gaylord and Gatlin, 1996 . g
2.2. Experimental procedures
Ž .
The experiments were conducted in 110-l aquaria containing 80 l of water con-nected as a recirculating system with salinity maintained at 6‰ by the addition of
Ž .
synthetic sea salt Fritz Aquaculture, Dallas, TX . Water quality was maintained within acceptable ranges for red drum with biological and mechanical filtration and constant aeration. Water temperature in the first and second experiment averaged 26 and 288C, respectively. A 12:12 h light:dark cycle were achieved with timed fluorescent lighting. At the initiation of the first experiment, red drum, Sciaenops ocellatus, weighing approximately 35 g were selected for uniformity of size and sorted into groups of 10
Ž .
weighing 353.6"3.1 grgroup mean"SD and placed into each aquarium. For the
Ž .
second experiment, 12 fish, averaging 41.7"1.3 grgroup ;3.5 grfish , were placed in each aquarium. In both experiments, each dietary treatment was fed to fish in three replicate aquaria.
Fish in the first experiment were initially fed at 4% BWrday and this was lowered equally among all treatments during the course of the experiment to 3% BWrday. Three
Ž treatments of fish in the second experiment were fed at decreasing fixed rates 6 to 4%
.
BWrday with increasing dietary protein and energy density to allow for similar daily protein and energy provisions with consumption of the entire ration. All fish fed at fixed rates in both experiments had half their daily ration divided equally between morning and evening feedings. In the second experiment, fish fed to apparent satiation were given a small quantity of feed every several minutes during a 30-min period in the morning and evening until active feeding ceased. One day each week, fish within each aquarium were weighed collectively and this weight was used to adjust feed quantities. The first experiment was conducted for 6 weeks while the second was continued for 8 weeks.
2.3. Weekly and terminal sampling and analysis
One day each week in both experiments, ammonia in each aquarium was monitored
Ž .
every 2 h for a total of 16 h postprandial 10 h total in the second experiment . After the last feeding period on the day before ammonia was to be monitored, excess feed or particulate wastes were removed, and aquarium walls were scrubbed to detach nitrifying bacteria. For the feeding period after which ammonia was to be monitored, fish were given 30 min to consume their ration and then the recirculating nature of the system was stopped by turning off the pump. Water samples from each aquarium were measured for ammonia with a Hach spectrophotometer, to indicate initial levels. These initial ammo-nia measurements were subtracted from measurements at each subsequent time point to determine change in aquarium ammonia. At the conclusion of the ammonia measure-ments, one aquarium from each treatment also had fish removed so that the decline in ammonia was monitored over time as a measure of nitrification and degassing losses from aquaria. Ammonia measurements were computed as a function of fish biomass in each aquarium for expression of ammonia produced per kilogram BW.
( )
B.B. McGoogan, D.M. Gatlin IIIrAquaculture 182 2000 271–285
276
cleaned by siphoning fecal and any uneaten feed debris. For consumption measurements,
Ž .
fish were fed one-half of their daily ration pre-weighed and allowed 30 min to consume this quantity before siphoning uneaten feed into containers with a small-diame-ter hose. Feed and wasmall-diame-ter obtained was filsmall-diame-tered through pre-weighed coarse filsmall-diame-ter paper with the aid of a vacuum pump. Samples were then dried at 608C overnight, weighed and subtracted from the quantity initially provided to quantify feed intake.
At the conclusion of the first experiment, one fish from each aquarium at each of five time points, ranging from 0 to 16 h postprandial, was bled for plasma glucose analysis. Blood was first centrifuged for 5 min after which supernatant was removed with a transfer pipette. This was then deproteinized with perchloric acid and neutralized with
Ž .
potassium carbonate using the method of Brock et al. 1994 . Plasma samples were Ž
stored frozen aty808C until glucose was analyzed Sigma Kita510; Sigma, St. Louis, .
MO . Additional sampling from the first experiment involved muscle and liver tissue
Ž .
being excised, wrapped in foil and stored frozen y808C until being analyzed for proximate composition. Liver tissue from 2 and 16 h time points was also analyzed for enzymatic activity as described later. Muscle, liver, and intraperitoneal fat were taken
Ž .
from seven fish per aquarium one fish per aquarium from the second experiment for Ž
determination of the following body indices: hepatosomatic index HSI: liver weight=
. Ž . Ž .
100rBW , intraperitoneal fat IPF ratio IPF weight=100rBW , and muscle ratio ŽMR: muscle weight=100rBW ..
Ž .
Glutamate dehydrogenase GLDH activity was determined using the procedure of
Ž .
Schmidt and Schmidt 1983 while glutaminase and glutamine synthetase activity were
Ž .
analyzed using the procedure of Chamberlin et al. 1992 . All enzyme assays were run at
Ž .
288C and activity was expressed per milligram liver protein Lowry et al., 1951 .
Ž .
Differences between means were tested for significance P-0.05 using the GLM
Ž .
procedure SAS Institute, 1985 . Duncan’s multiple-range test was used to detect significant differences among means.
3. Results
3.1. Effects of dietary energy leÕels
3.1.1. Fish growth and body condition indices
Survival was high for red drum fed all treatments in the first experiment with only the
Ž . Ž .
mean of fish fed the 18.4 kJrg diet 97% being less than 100% Table 2 . All diets Ž resulted in weight gain of about 200% of initial weight during the 6-week period Table
.
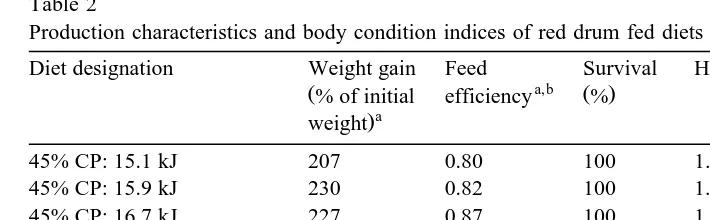
Table 2
Production characteristics and body condition indices of red drum fed diets containing different energy levels c,d c,e c,f
Diet designation Weight gain Feed Survival HSI IPF ratio MR
a,b
Analysis of variance, P)F 0.5302 0.3158 0.4516 0.0033 0.0149 0.6521
Pooled standard error 16.25 0.04 1.49 0.15 0.24 1.30
a
Values represent means of three replicate aquaria of fish with average initial weight of approximately 35 grfish and fed for 6 weeks.
b
g gainrg dry feed. c
Values represent means of seven fish from each of three replicate aquaria. d
HSI: liver weight=100rfish weight. e
IPF ratio: intraperitoneal fat weight=100rfish weight. f
MR: muscle weight=100rfish weight.
g Ž .
Values within the same column with different superscripts h,i were determined to be significantly different
ŽP-0.05 by Duncan’s multiple-range test..
3.1.2. Tissue composition
There was a tendency for relative liver protein to be higher in red drum fed the lowest energy diet while the lowest liver protein was present in fish fed the highest energy diet
Ž . Ž .
although differences were not quite significant Ps0.0565 Table 3 . Percentage liver lipid was highest in fish fed the diet with 16.7 kJrg, and the lowest liver lipid was present in fish fed the lowest energy diets. Percentage muscle protein had a narrow
Table 3
Protein and lipid composition of liver and muscle tissues from red drum fed diets containing different energy levels
a,b b,c
Liver Muscle
Ž . Ž . Ž . Ž .
Diet designation Protein % Lipid % Protein % Lipid %
d,f
Analysis of variance, P)F 0.0565 0.0303 0.8372 0.4608
Pooled standard error 0.38 1.70 0.51 0.32
a
Values represent means of five pooled livers from fish in each of three replicate aquaria. b
Values are expressed on a fresh-weight basis. c
Values represent means of individual muscle samples from fish in each of three replicate aquaria.
d Ž . Ž .
( )
B.B. McGoogan, D.M. Gatlin IIIrAquaculture 182 2000 271–285
278
Ž .
range 19.6 to 20.4% and was not significantly different among fish fed the various diets. Muscle lipid concentration was relatively low for fish fed all diets and was not significantly different among any groups.
3.1.3. Ammonia production
Ammonia production tended to decrease with an increase in dietary energy although
Ž .
only significantly so at 6 h postprandial Table 4 . At almost all time points, the highest dietary energy level resulted in lower ammonia production than the lowest dietary energy level but this trend was significant only at 6 h.
3.1.4. Plasma glucose and hepatic enzyme actiÕities
Plasma glucose levels ranged from 82 to 125 mgrdl and there were no significant differences attributable to dietary energy density. Activity of GLDH ranged from 23.6 to
Ž .
33.5 molrmin mg protein with no significant differences attributable to dietary energy level. Glutaminase and glutamine synthetase activities also were not significantly
Ž
affected by dietary energy, ranging from 4.2 to 8.6 and 2.3 to 4.5 molrmin mg .
protein , respectively.
3.2. Effects of nutrient density at different feed rates
3.2.1. Fish growth and body condition indices
In the second experiment, there were no differences in survival of red drum based upon dietary nutrient density and feeding rates with survival ranging from 81 to 94%. Increasing nutrient density above that of the 33r13 at 6 resulted in significantly increased weight gain of red drum although no improvements were made as nutrient
Ž .
density increased above that of the 40r15.5 at 5 treatment Table 5 . The 40r15.5 at satiate treatment resulted in practically identical weight gain as fish fed this diet at a
Table 4
Ammonia produced by red drum fed diets containing various energy levels as measured by aquarium ammonia
Ž Ž ..
levels mgrl kg BW at 2-h intervals postprandial. Values represent the mean of three replicate aquaria at each time point. Adjustments are made for nitrification occurring and total fish weight in each aquarium for expression per kg BW
Analysis of variance, P)F 0.1920 0.1813 0.0093 0.1598 0.8423 0.9627 0.9192 0.7836
Pooled standard error 0.18 0.24 0.31 0.45 0.32 0.40 0.35 0.26
a Ž . Ž .
()
McGoogan,
D.M.
Gatlin
III
r
Aquaculture
182
2000
271
–
285
279
Table 5
Production characteristics and body condition indices of red drum fed diets containing increasing protein and energy levels at decreasing feed rates
a b a,c a,d e,f e,g e,h
Ž .
Diet regime Weight gain % of initial weight Percent consumption Feed efficiency Protein efficiency HSI IPF ratio MR
i,k j l l k
33r13 at 6 628 98 0.61 1.60 1.55 0.23 34.7
j k k k j,k
40r15.5 at 5 950 92 0.87 1.90 1.72 0.36 36.7
j j j k j
50r18 at 4 986 99 1.08 1.91 1.81 0.58 37.2
j k j j k
40r15.5 at satiate 951 99 1.12 2.45 1.72 0.32 37.1
Analysis of variance, P)F 0.0009 0.0013 0.0001 0.0001 0.7751 0.0349 0.0593
Pooled standard error 41.8 4.65 0.02 0.03 0.31 0.15 1.21
a
Values represent means of three replicate aquaria of fish with average initial weight of approximately 3 grfish and fed for 8 weeks. b
Values were determined twice weekly on three replicate aquaria and represent the percent of offered feed consumed after 30 min. c
g gainrg feed fed. d
g gainrg protein fed. e
Values represent means of three fish from each of three replicate aquaria. f
HSI: liver weight=100rfish weight. g
IPF ratio: intraperitoneal fat weight=100rfish weight. h
MR: muscle weight=100rfish weight.
i Ž . Ž .
( )
B.B. McGoogan, D.M. Gatlin IIIrAquaculture 182 2000 271–285
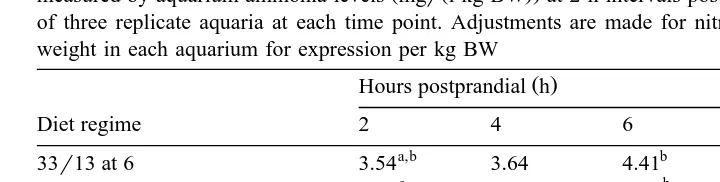
280 Table 6
Ammonia produced by red drum fed diets with increasing protein and energy levels at decreasing feed rates as
Ž Ž ..
measured by aquarium ammonia levels mgrl kg BW at 2-h intervals postprandial. Values represent means of three replicate aquaria at each time point. Adjustments are made for nitrification occurring and total fish weight in each aquarium for expression per kg BW
Ž .
Hours postprandial h
Diet regime 2 4 6 8 10
a,b b
33r13 at 6 3.54 3.64 4.41 4.83 4.68
c b
40r15.5 at 5 2.36 3.18 4.17 4.72 4.78
c b
50r18 at 4 2.58 3.19 4.32 4.80 5.06
c c
40r15.5 at satiate 2.58 3.35 3.51 4.65 4.79
Analysis of variance, P)F 0.0066 0.2184 0.0165 0.9825 0.8835
Pooled standard error 0.55 0.38 0.45 0.76 0.76
a Ž . Ž .
Values within the same column having different superscripts b,c are significantly different P-0.05 as determined by Duncan’s multiple-range test.
fixed 5% BWrday. Feed efficiency was significantly greater for fish in the 50r18 at 4 treatment than either the 33r13 at 6 or 40r15.5 at 5 treatments. Utilization of satiation feeding resulted in significantly better feed efficiency than feeding the same diet at a fixed 5% BWrday. Protein efficiency trends were similar to feed efficiency with values of fish in the 33r13 at 6 treatment being significantly poorer than those of fish in the 40r15.5 at 5 and 50r18 at 4 treatments. Feeding to apparent satiation again resulted in significantly better protein efficiency than feeding the same diet at a fixed 5% BWrday. The IPF ratio was affected by dietary and feeding rate manipulations but the treatments had no effect on MR and HSI. The highest IPF ratio value was exhibited by fish in the 50r18 at 4 treatment although it was not significantly higher than that of fish in the 40r15.5 at 5 treatment. In addition, IPF ratio values were similar when feeding at a fixed rate vs. feeding to apparent satiation. Fish in the 33r13 at 6 treatment had the lowest MR value although differences among treatments were not quite significant ŽPs0.0593 ..
3.2.2. Ammonia production
Ammonia production was significantly higher for fish in the 33r13 at 6 treatment
Ž .
compared to all other treatments at 2 h post-feeding Table 6 . However, at most time points, increasing nutrient density in conjunction with decreasing feed rate had no effect on ammonia production.
4. Discussion
It appears that dietary energy density in the range investigated in the first experiment
Ž .
had no effect on weight gain of red drum. Similarly, Hanley 1991 found increasing energy, by elevating lipid from 5 to 12% of diet, did not enhance weight gain of Nile
Ž .
improved with increases in dietary lipid, but dietary protein was decreased in conjunc-tion with higher lipid levels thus likely contributing to the improved protein efficiency. Beyond the scope of growth and feed efficiency, dietary energy levels were observed to impact body composition of red drum. From the first experiment, HSI and IPF ratio were significantly lower at the lower dietary energy levels. Increasing dietary energy, as
Ž lipid, has been shown to increase fat deposition in many species including cod Jobling
. Ž . Ž .
et al., 1991 , mahseer Bazaz and Keshavanath, 1993 , whitefish Koskela et al., 1998 ,
Ž .
and Atlantic salmon Grisdale-Helland and Helland, 1997 . High levels of fat deposition Ž
are believed to result in a reduced feed intake in some species Jobling and Miglavs, .
1993; Shearer et al., 1997 . Also, there has been evidence to demonstrate a reduced fat deposition when dietary energy levels reach a certain point which results in reduced
Ž .
consumption given that fish tend to eat to meet an energy need NRC, 1993 . Koskela et
Ž .
al. 1998 did not find reduced consumption of fish fed higher energy levels when measured by X-radiography. However, measurements of intake were only made three times during that experiment and consumption trends may have been missed, if present. Ammonia production by red drum tended to be reduced by higher dietary energy levels even though this was significantly the case only at 6 h postprandial in the first experiment. This is in agreement with a previous experiment from this laboratory where
Ž
higher dietary energy resulted in lower ammonia production McGoogan and Gatlin, .
1999 . Also in agreement with that earlier study was that reduced ammonia production with higher dietary energy did not manifest itself in growth improvement. This further strengthens the possibility that reduced feed consumption with an increase in dietary energy may account for the fact that ammonia production was reduced without
improv-Ž .
ing growth. Jobling and Wandsvik 1983 found that dietary energy was more important than protein in regulating appetite of Arctic charr. In that study, higher dietary energy was believed to result in reduced gut evacuation rate and subsequently reduce feeding activity.
Plasma glucose was not significantly different in red drum fed any of the diets in the first experiment at any time point postprandial. Even though red drum fed the diet with the highest energy level might have been expected to have the lowest plasma glucose levels due to the paucity of dextrin in that diet and the high concentration of lipid to meet energy needs, plasma glucose levels were not different in these fish compared to those fed any of the other diets. This seems to indicate that there is an obligatory amount of gluconeogenesis occurring related to meeting body glucose needs. Gillis and
Ballan-Ž .
tyne 1996 found that plasma glucose concentrations of lake sturgeon were maintained through gluconeogenesis from amino acids even during fasting conditions. Bever et al. Ž1981 noted that for the carnivorous kelp bass, incorporation of labeled amino acid. carbon was measurable in body glucose within 15 min of injection into fish. These authors speculated that this level of obligatory production of glucose from amino acids might be related to the need for carbohydrate precursors for synthesis of protective mucus which covers many species. The high level of amino acid catabolism to meet glucose needs may indicate a potential benefit of dietary carbohydrate in sparing gluconeogenesis from amino acids.
( )
B.B. McGoogan, D.M. Gatlin IIIrAquaculture 182 2000 271–285
282
of any of the enzymes. Although GLDH activity was not affected by increasing dietary energy in the present study, activity of this enzyme has been shown to be reduced with
Ž .
higher energy in a study with European eel Suarez et al., 1995 . Similarly, Lin et al.
´
Ž1977 found in coho salmon that hepatic activity of this enzyme was reduced with.Ž
increases in dietary lipid. In a previous study with red drum McGoogan and Gatlin, .
1999 , higher dietary energy at several different protein concentrations reduced hepatic glutaminase activity but did not affect the activity of GLDH or glutamine synthetase in two separate experiments. The reduction in glutaminase activity appeared to be due to a diminished need for gluconeogenesis at the higher dietary energy concentrations.
In the second experiment of the present study, significant growth differences did result although provisions were made to ensure that all fish received approximately the same digestible protein and energy if all diet offered was consumed. Red drum in the 33r13 at 6 treatment had significantly lower weight gain than fish in the other treatments. It is possible that fish fed this low protein and energy diet could not physically ingest all of the ration and thereby actually had reduced nutrient and energy
Ž .
intake relative to fish fed diets with higher nutrient density. Bromley and Adkins 1984 determined that rainbow trout fed diets containing increasing percentages of cellulose compensated for reduced nutrient density by consuming more diet to achieve compara-ble nutrient intake and growth. However, with diets containing 40–50% cellulose, fish were unable to consume adequate quantities to achieve comparable growth, even though stomach size was increased. This is similar to another study with rainbow trout in which fish fed diets with low and moderate energy levels were unable to compensate with
Ž
increased intake to achieve comparable growth as fish fed high energy levels Alanara,
¨ ¨
.1994 . In the present study, it is also conceivable that energy costs may have been higher for metabolizing larger quantities of a less nutrient-rich diet, leaving less energy available for growth.
Also in the second experiment, groups of fish fed the same diet at either a fixed 5% BWrday or daily to apparent satiation had practically identical weight gain, differing by less than 1%, over the course of 8 weeks. The satiation feeding strategy did result in greater feed efficiency and it could be concluded that fish fed a fixed 5% BWrday were overfed on some occasions, leading to poorer efficiency. This suggests that feeding at a fixed rate can result in a substantially poorer feed efficiency and may not be most desirable in a production scenario. However, these results suggest that feeding at a fixed rate, in slight excess of estimated satiation, provides weight gain similar to that expected from a satiation feeding regime. It should be considered that feeding at a fixed rate below estimated satiation is likely to produce quite different results than satiation
Ž .
feeding. Johansen and Jobling 1998 found that Atlantic salmon fed to satiation consumed more and grew faster than those restrictively fed diets predicted to provide good growth rates. Due to differences in actual feed intake between fish using these two strategies, considerable differences in nutrient intake frequently occur. Martınez-Palacios
´
Ž .
et al. 1996 determined that the predicted protein requirement for maximum gain of the Mexican cichlid is decidedly different when feeding to satiation vs. feeding at a fixed rate.
rate. The IPF ratio values were rather low at all nutrient density levels with the highest being in fish in the 50r18 at 4 treatment. This is surprising as red drum is a species which tends to deposit large quantities of lipid in the peritoneal cavity.
Even though growth and feed efficiency of red drum were significantly improved by increased dietary protein and energy levels at a reduced feeding rate, ammonia produc-tion was only slightly reduced. However, increasing protein and energy density does seem to be an effective dietary manipulation under conditions of reduced consumption to ensure that requirements for maximal growth are met. Additionally, the lowest dietary protein and energy levels were not high enough to support high growth rates and should
Ž .
be avoided. Similarly, Jirsa et al. 1997 found improved growth and feed efficiency in red drum fed diets with increasing protein and energy density. These researchers also found reduced chemical oxygen demand and suspended phosphorus with increasing
Ž .
protein and energy density. The inability of Jirsa et al. 1997 to see reductions in ammonia levels with manipulations of dietary protein and energy density were likely due to biofiltration and common water recirculation. The favorable results with increas-ing protein and energy seem to indicate reducincreas-ing dietary protein levels in favor of higher dietary energy may not be as valuable for red drum as increasing protein in conjunction with energy and feeding at a reduced rate. It should be realized that increasing protein and energy must be provided by highly digestible ingredients in order for the desired benefit to occur.
In conclusion, increasing dietary energy generally resulted in a favorable reduction in ammonia production by red drum but did not improve growth. Assessments of consump-tion are needed to determine if reducconsump-tions in ammonia producconsump-tion are attributable to reduced intake. Increasing dietary protein in conjunction with energy also may be a strategy for improving growth of red drum fed high-energy diets.
Acknowledgements
This research was supported in part by a grant from the National Marine Fisheries
Ž .
Service of the National Oceanic and Atmospheric Administration NOAA to the Texas Sea Grant College Program and by the Texas Agricultural Experiment Station under project H-6556. Views expressed in this manuscript are those of the authors and not those of NOAA or any of its subagencies. Thanks are extended to Omega Protein ŽHouma, LA and Reedville, VA for providing fish oil and fish meal for the experimen-. tal diets.
References
Alanara, A., 1994. The effect of temperature, dietary energy content and reward level on the demand feeding¨ ¨
Ž .
activity of rainbow trout Oncorhynchus mykiss . Aquaculture 126, 349–359.
Bazaz, M.M., Keshavanath, P., 1993. Effect of feeding different levels of sardine oil on growth, muscle composition and digestive enzyme activities of mahseer, Tor khudree. Aquaculture 115, 111–119. Bever, K., Chenoweth, M., Dunn, A., 1981. Amino acid gluconeogenesis and glucose turnover in kelp bass
( )
B.B. McGoogan, D.M. Gatlin IIIrAquaculture 182 2000 271–285
284
Brock, A.A., Chapman, S.A., Ulman, E.A., Wu, G., 1994. Dietary manganese deficiency decreases rat hepatic arginase activity. J. Nutr. 124, 340–344.
Bromley, P.J., Adkins, T.C., 1984. The influence of cellulose filler on feeding, growth and utilization of protein and energy in rainbow trout, Salmo gairdnerii Richardson. J. Fish Biol. 24, 235–244.
Ž .
Campbell, J.W., 1991. Excretory nitrogen metabolism. In: Prosser, C.L. Ed. , Environmental and Metabolic Animal Physiology. Wiley, New York, NY, pp. 277–324.
Ž .
Chamberlin, M.E., Clemet, H.C., Ballantyne, J.S., 1992. Glutamine metabolism in holostean Amia calÕa and
Ž .
teleost fish SalÕelinus namaycush . Am. J. Physiol. 260, R159–66.
Cho, C.Y., Bureau, D.P., 1997. Reduction of waste output from salmonid aquaculture through feeds and feeding. Prog. Fish-Cult. 59, 155–160.
Cho, C.Y., Hynes, J.D., Wood, K.R., Yoshida, H.K., 1994. Development of high nutrient-dense, low pollution diets and prediction of aquaculture wastes using biological approaches. Aquaculture 124, 293–305. de la Higuera, M., Murillo, A., Varela, G., Zamora, S., 1977. The influence of high dietary fat levels on
Ž .
protein utilization by the trout, Salmo gairdnerii . Comp. Biochem. Physiol. 56A, 37–41.
Gaylord, T.G., Gatlin, D.M. III, 1996. Determination of apparent digestibility coefficients of various feedstuffs
Ž .
for red drum Sciaenops ocellatus . Aquaculture 139, 303–314.
Gillis, T.E., Ballantyne, J.S., 1996. The effects of starvation on plasma free amino acid and glucose concentrations in lake sturgeon. J. Fish Biol. 49, 1306–1316.
Grisdale-Helland, B., Helland, S.J., 1997. Replacement of protein by fat and carbohydrate in diets for Atlantic
Ž .
salmon Salmo salar at the end of the freshwater stage. Aquaculture 152, 167–180.
Hanley, F., 1991. Effects of feeding supplementary diets containing varying levels of lipid on growth, food
Ž .
conversion, and body composition of Nile tilapia, Oreochromis niloticus L. . Aquaculture 93, 323–334. Jayaram, M.G., Beamish, F.W.H., 1992. Influence of dietary protein and lipid on nitrogen and energy losses in
lake trout, SalÕelinus namaycush. Can. J. Fish. Aquat. Sci. 49, 2267–2272.
Jirsa, D.O., Davis, D.A., Arnold, C.R., 1997. Effects of dietary nutrient density on water quality and growth of red drum Sciaenops ocellatus in closed systems. J. World Aquacult. Soc. 28, 68–78.
Jobling, M., Miglavs, I., 1993. The size of lipid depots — a factor contributing to the control of food intake in Arctic charr, SalÕelinus alpinus? J. Fish Biol. 43, 487–489.
Jobling, M., Wandsvik, A., 1983. An investigation of factors controlling food intake in Arctic charr, SalÕelinus
alpinus L. J. Fish Biol. 23, 397–404.
Jobling, M., Knudson, R., Pederson, P.S., Dos Santos, J., 1991. Effects of dietary composition and energy content on the nutritional energetics of cod, Gadus morhua. Aquaculture 92, 243–257.
Johansen, S.J.S., Jobling, M., 1998. The influence of feeding regime on growth and slaughter traits of cage-reared Atlantic salmon. Aquacult. Int. 6, 1–17.
Johnsen, F., Hillestad, M., Austreng, E., 1991. High energy diets for Atlantic salmon, effects on pollution. In:
Ž .
Kaushik, S.J., Luquet, P. Eds. , Fish Nutrition in Practice. Proceedings of the IVth International Symposium on Fish Nutrition and Feeding. INRA, Paris, France, pp. 391–401.
Koskela, J., Jobling, M., Savolainen, R., 1998. Influence of dietary fat level on feed intake, growth and fat deposition in the whitefish, Coregonus laÕaretus. Aquacult. Int. 6, 95–102.
Lin, H., Romsos, D.R., Tack, P.I., Leveille, G.A., 1977. Influence of dietary lipid on lipogenic enzyme activities in coho salmon, Oncorhynchus kisutch. J. Nutr. 107, 846–854.
Lowry, O.H., Rosenbrough, N.J., Farr, A.L., Randall, R.J., 1951. Protein measurement with the folin phenol reagent. J. Biol. Chem. 193, 265–275.
Martınez-Palacios, C.A., Harfush-Melendez, M., Chavez-Sanchez, C., Ross, L.G., 1996. The optimum dietary´ ´ ´
Ž .
protein level for the Mexican cichlid Cichlasoma uropthalmus Gunther : a comparison of estimates¨
derived from experiments using fixed-rate feeding and satiation feeding. Aquacult. Nutr. 2, 11–20. McGoogan, B., Gatlin, D.M. III, 1998. Metabolic requirements of red drum, Sciaenops ocellatus, for protein
and energy based on weight gain and body composition. J. Nutr. 128, 123–129.
McGoogan, B., Gatlin, D.M. III, 1999. Dietary manipulations affecting growth and nitrogenous waste production of red drum, Sciaenops ocellatus: I. Effects of dietary protein and energy levels. Aquaculture 178, 333–348.
Moon, H.Y.L., Gatlin, D.M. III, 1991. Total sulfur amino acid requirement of juvenile red drum, Sciaenops
ocellatus. Aquaculture 95, 97–106.
Ž .
SAS Institute, 1985. SAS User’s Guide: Statistics, Version 5 edn., Cary, NC. 956 pp.
Ž .
Schmidt, E., Schmidt, F.W., 1983. Glutamate dehydrogenase. In: Bergmeyer Ed. , Methods of Enzymatic Analysis, Vol. III. Enzymes 1: Oxidoreductases, Transferases. Verlag Chemie, Deerfield Beach, FL, pp. 216–227.
Serrano, J.A., Nematipour, G.R., Gatlin, D.M. III, 1992. Dietary protein requirement of the red drum and relative use of dietary carbohydrate and lipid. Aquaculture 101, 283–291.
Shearer, K.D., Silverstein, J.T., Plisetskaya, E.M., 1997. Role of adiposity in food intake control of juvenile
Ž .
chinook salmon Oncorhynchus tshawytscha . Comp. Biochem. Physiol. 118A, 1209–1215.
Suarez, M.D., Hidalgo, M.C., Garca Gallego, M., Sanz, A., de la Higuera, M., 1995. Influence of the relative´
proportions of energy yielding nutrients on liver intermediary metabolism of the European eel, Anguilla
anguilla. Comp. Biochem. Physiol. 111A, 421–428.
Vergara, J.M., Robaina, L., Izquierdo, M., de la Higuera, M., 1996. Protein sparing effect of lipids in diets for´
fingerlings of gilthead sea bream. Fish. Sci. 62, 624–628.